Learn Excel + Python: From Spreadsheet User to Automation Engineer
Goal: Master the bridge between Excel’s business-friendly interface and Python’s automation power. Move from manual Excel operations to automated, scalable data workflows that integrate Python’s capabilities into Excel environments.
Why Excel + Python Integration Matters
Excel is the world’s most popular data tool, used by billions. Python is the world’s most popular automation language. Combining them creates a superpower that bridges business users and engineers.
- Efficiency: Tasks that take hours in Excel take seconds with Python automation.
- Scale: Python can process millions of rows that would crash Excel.
- Repeatability: Python scripts eliminate human error in repetitive Excel workflows.
- Integration: Python can pull data from APIs, databases, and web sources directly into Excel.
- Advanced Analysis: Python’s libraries (pandas, numpy, scikit-learn) provide capabilities far beyond Excel formulas.
Real production systems don’t just use Excel or Python—they use both. You’ll learn to build systems where Excel is the user interface and Python is the engine.
Core Concept Analysis
1. The Excel-Python Architecture
Understanding how Excel and Python communicate is fundamental. There are three primary integration patterns:
┌─────────────────────────────────────────────────┐
│           INTEGRATION PATTERNS                  │
├─────────────────────────────────────────────────┤
│ Pattern 1: File-Based (openpyxl/xlwings)       │
│   Excel File → Python Script → Excel File      │
│                                                 │
│ Pattern 2: Live Connection (xlwings)           │
│   Excel VBA → Python Runtime → Excel           │
│                                                 │
│ Pattern 3: Excel as Output (pandas)            │
│   API/DB → Python → Excel Dashboard            │
└─────────────────────────────────────────────────┘
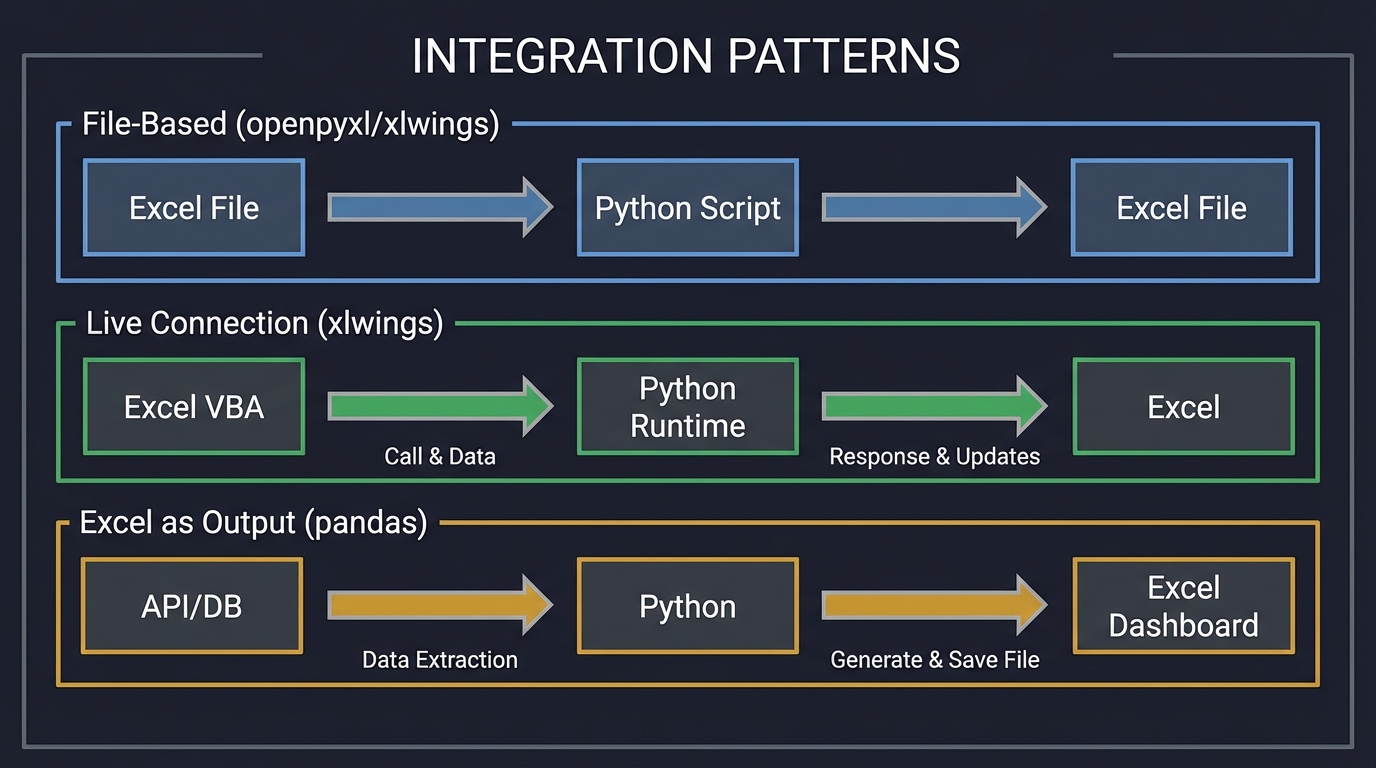
Key Takeaway: Choose the pattern based on your use case. File-based is simple but asynchronous. Live connection enables real-time interaction but requires setup.
2. The Data Transformation Pipeline
Excel users think in terms of sheets and cells. Python thinks in terms of DataFrames and arrays. The transformation between these mental models is critical.
Excel World                   Python World
┌──────────────┐             ┌──────────────┐
│ Sheet: Sales │             │ DataFrame    │
│ A1: Product  │  ───────►   │ Column: str  │
│ B1: Price    │  openpyxl   │ Column: float│
│ C1: Date     │             │ Column: date │
└──────────────┘             └──────────────┘
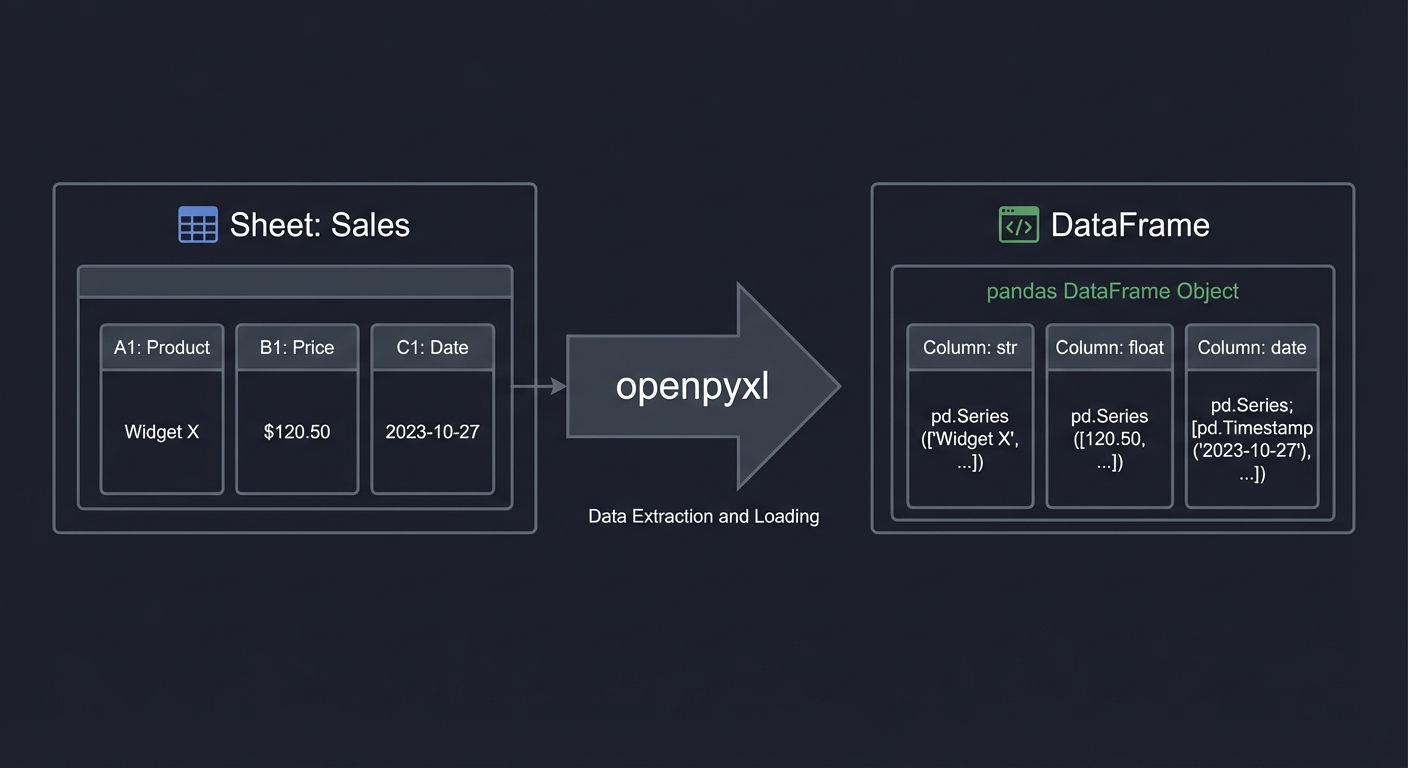
Key Takeaway: Understanding data type mapping (Excel number formats vs pandas dtypes) prevents bugs. Excel’s ambiguous cell types must be explicitly defined in Python.
3. The Automation Lifecycle
Production Excel+Python systems follow a lifecycle that ensures reliability:
1. EXTRACT        2. TRANSFORM       3. LOAD           4. VALIDATE
┌─────────┐      ┌──────────┐      ┌─────────┐      ┌──────────┐
│ Read    │      │ Clean    │      │ Write   │      │ Check    │
│ Excel   │ ───► │ Analyze  │ ───► │ Excel   │ ───► │ Format   │
│ Files   │      │ Enrich   │      │ Output  │      │ Formulas │
└─────────┘      └──────────┘      └─────────┘      └──────────┘
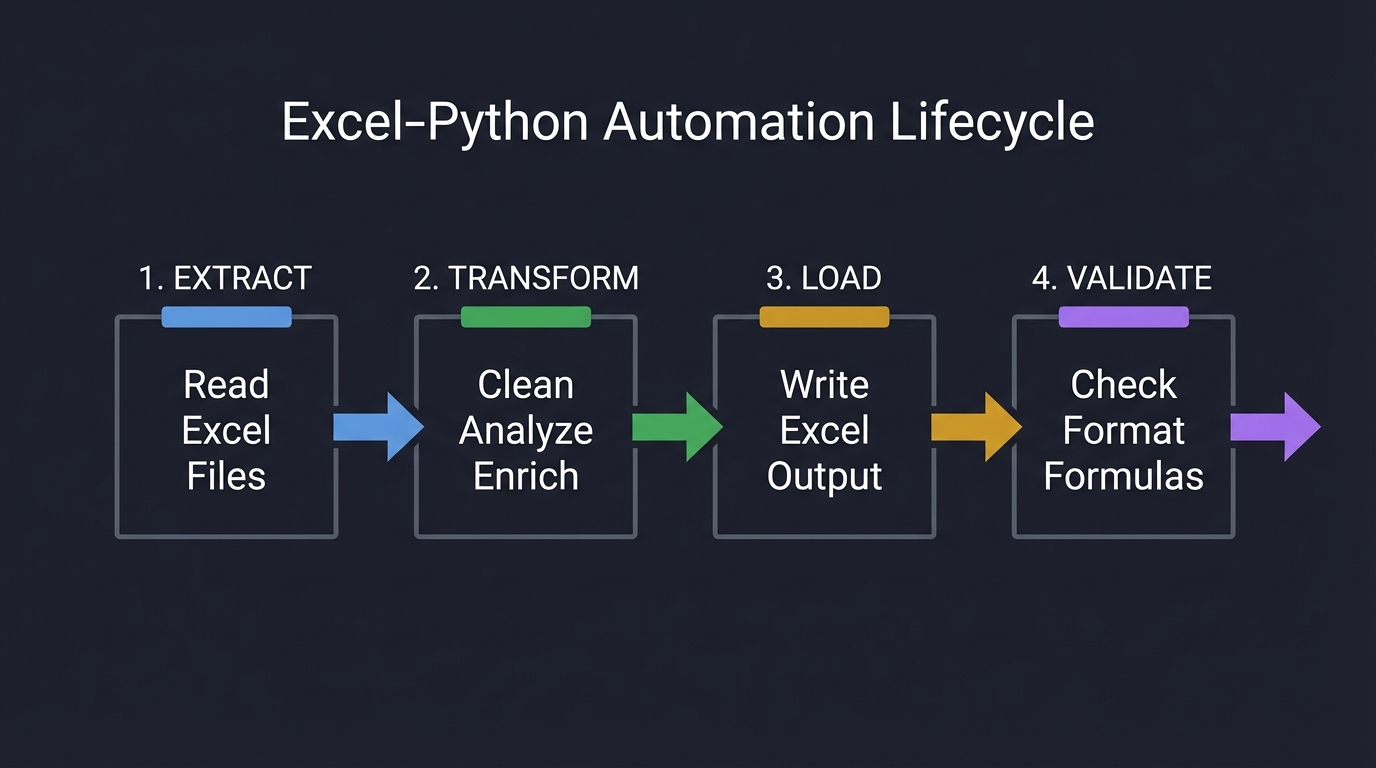
Key Takeaway: Each stage must handle errors gracefully. A production script must validate input, log transformations, and verify output integrity.
Concept Summary Table
| Concept Cluster | What You Need to Internalize |
|---|---|
| Library Selection | openpyxl for file manipulation, xlwings for live connection, pandas for data analysis, XlsxWriter for formatting. |
| Data Type Mapping | Excel cells are ambiguous; Python requires explicit types. Date/time handling requires special care. |
| Formula Preservation | Reading Excel doesn’t execute formulas—you get cached values. Writing formulas requires understanding Excel syntax. |
| Performance | Excel has ~1M row limit; Python can handle billions. Large files need chunking strategies. |
| User Interface | Excel is the UI layer; Python is the logic layer. Design for non-technical users. |
| Error Handling | Excel errors (DIV/0!, #N/A) must be handled explicitly in Python. Validation prevents corruption. |
Deep Dive Reading by Concept
Python-Excel Integration Libraries
| Concept | Resource |
|---|---|
| openpyxl | Official Documentation (openpyxl.readthedocs.io) - Read/write Excel 2010+ files |
| xlwings | Official Documentation (docs.xlwings.org) - Live Excel integration |
| pandas | “Python for Data Analysis” by Wes McKinney - Chapter 6 (Reading/Writing Data) |
Data Processing & Analysis
| Concept | Resource |
|---|---|
| pandas | “Python for Data Analysis” by Wes McKinney - Core reference |
| Data Cleaning | “Clean Code” by Robert Martin - Chapter 10 (Classes) - Structure your data pipelines |
Essential Reading Order
- Foundation (Week 1): openpyxl documentation - Basic read/write operations
- Data Analysis (Week 2): “Python for Data Analysis” Chapters 5-7
- Advanced Integration (Week 3): xlwings documentation and examples
Project List
Project 1: Monthly Sales Report Automation
Build a system that transforms raw sales data into formatted Excel reports with charts and summaries.
You work at a company that receives daily sales transactions in CSV format. Every month, someone spends hours copying data into Excel, formatting it, creating pivot tables, and generating charts. Your task: automate this entirely.
What you’ll build:
- A Python script that reads multiple CSV files (one per day)
- Combines them into a single Excel workbook with multiple sheets
- Applies professional formatting (fonts, colors, borders)
- Generates summary tables with totals and averages
- Creates embedded charts (bar chart for top products, line chart for daily trends)
- Saves the report with the current month’s name
Technologies:
pandasfor data manipulationopenpyxlfor Excel file creation and formattingdatetimefor month/date handling
Real World Outcome
When you run your script, here’s what happens:
$ python sales_report_automation.py

Reading sales data...
✓ Loaded sales_2024_12_01.csv (347 transactions)
✓ Loaded sales_2024_12_02.csv (412 transactions)
✓ Loaded sales_2024_12_03.csv (389 transactions)
... (continues for all days)

Processing data...
✓ Combined 30 files with 11,247 total transactions
✓ Calculated daily totals
✓ Identified top 10 products
✓ Generated regional breakdown

Creating Excel report...
✓ Sheet 'Raw Data' created with all transactions
✓ Sheet 'Daily Summary' created with formatted table
✓ Sheet 'Top Products' created with chart
✓ Sheet 'Regional Analysis' created with pivot-style summary
✓ Applied professional formatting (branded colors, borders, fonts)

Report saved: December_2024_Sales_Report.xlsx
When you open December_2024_Sales_Report.xlsx:
- Raw Data sheet: All 11,247 transactions in a clean table format
- Column headers in bold blue with filters enabled
- Date column formatted as “Dec 01, 2024”
- Currency columns showing “$1,234.56”
- Alternating row colors for readability
- Daily Summary sheet: A formatted summary table showing:
╔══════════════╦═══════════════╦════════════════╦═══════════════╗
║ Date         ║ Transactions  ║ Total Revenue  ║ Avg Sale      ║
╠══════════════╬═══════════════╬════════════════╬═══════════════╣
║ Dec 01, 2024 ║ 347           ║ $43,287.50     ║ $124.75       ║
║ Dec 02, 2024 ║ 412           ║ $51,640.25     ║ $125.34       ║
║ Dec 03, 2024 ║ 389           ║ $48,912.75     ║ $125.74       ║
║ ...          ║ ...           ║ ...            ║ ...           ║
║ TOTAL        ║ 11,247        ║ $1,405,887.25  ║ $125.02       ║
╚══════════════╩═══════════════╩════════════════╩═══════════════╝
Plus a line chart embedded below showing revenue trend over the month
- Top Products sheet:
- A ranked table of your top 10 products by revenue
- A horizontal bar chart showing the comparison visually
- Conditional formatting highlighting the #1 product in green
- Regional Analysis sheet:
- A breakdown by region (North, South, East, West)
- Each region’s total sales and percentage of overall revenue
- A pie chart showing the distribution
The transformation: What took a person 3-4 hours now happens in 2 seconds, with zero human error, perfect consistency, and immediate availability on the 1st of each month.
The Core Question You’re Answering
“How do I transform Python data into a professional Excel document that looks like a human formatted it?”
This isn’t about just exporting data. Excel users expect formatting, colors, charts, and layout. You’re learning to be the bridge between Python’s data processing power and Excel’s business-friendly presentation layer.
Concepts You Must Understand First
Stop and research these before coding:
- pandas DataFrames vs Excel Sheets
- How does a pandas DataFrame map to an Excel sheet?
- What happens to the index when you write to Excel?
- How do you preserve or reset the index?
- Book Reference: “Python for Data Analysis” Ch. 6 - Wes McKinney
- openpyxl Object Model
- What is a Workbook? A Worksheet? A Cell?
- How does openpyxl represent Excel’s structure in Python objects?
- What’s the difference between creating a new file and modifying an existing one?
- Documentation: openpyxl.readthedocs.io/en/stable/
- Excel Cell Formatting
- What properties can you control? (Font, fill, border, alignment, number format)
- How does openpyxl’s
NamedStylework? - What’s the difference between applying format to a cell vs a range?
- Book Reference: “Automate the Boring Stuff with Python” Ch. 13 - Al Sweigart
- Excel Chart Types
- What chart types does openpyxl support? (BarChart, LineChart, PieChart, etc.)
- How do you define chart data references?
- Where does the chart get placed in the worksheet?
- Documentation: openpyxl.readthedocs.io/en/stable/charts/introduction.html
- Data Aggregation with pandas
- How do you group data by date or category?
- What’s the difference between
.groupby()and.pivot_table()? - How do you calculate sums, means, counts?
- Book Reference: “Python for Data Analysis” Ch. 10 - Wes McKinney
Questions to Guide Your Design
Before implementing, think through these:
- Data Loading Strategy
- How do you find all CSV files in a directory?
- What if files have inconsistent column names or missing data?
- Should you validate data before processing?
- Sheet Structure
- How many sheets should your workbook have?
- What’s the purpose of each sheet?
- Should all sheets have the same data, just presented differently?
- Formatting Approach
- Should you format row-by-row, or apply styles to ranges?
- How do you make headers stand out without hardcoding row numbers?
- What colors convey professionalism? (Avoid bright colors)
- Chart Placement
- Where should charts appear? (New sheet or below data?)
- How large should charts be?
- How do you ensure chart data references are correct?
- Error Handling
- What if a CSV file is missing?
- What if data has unexpected formats (text in numeric columns)?
- How do you communicate errors to the user?
Thinking Exercise
Trace the Data Flow
Before coding, trace how data transforms through your system:
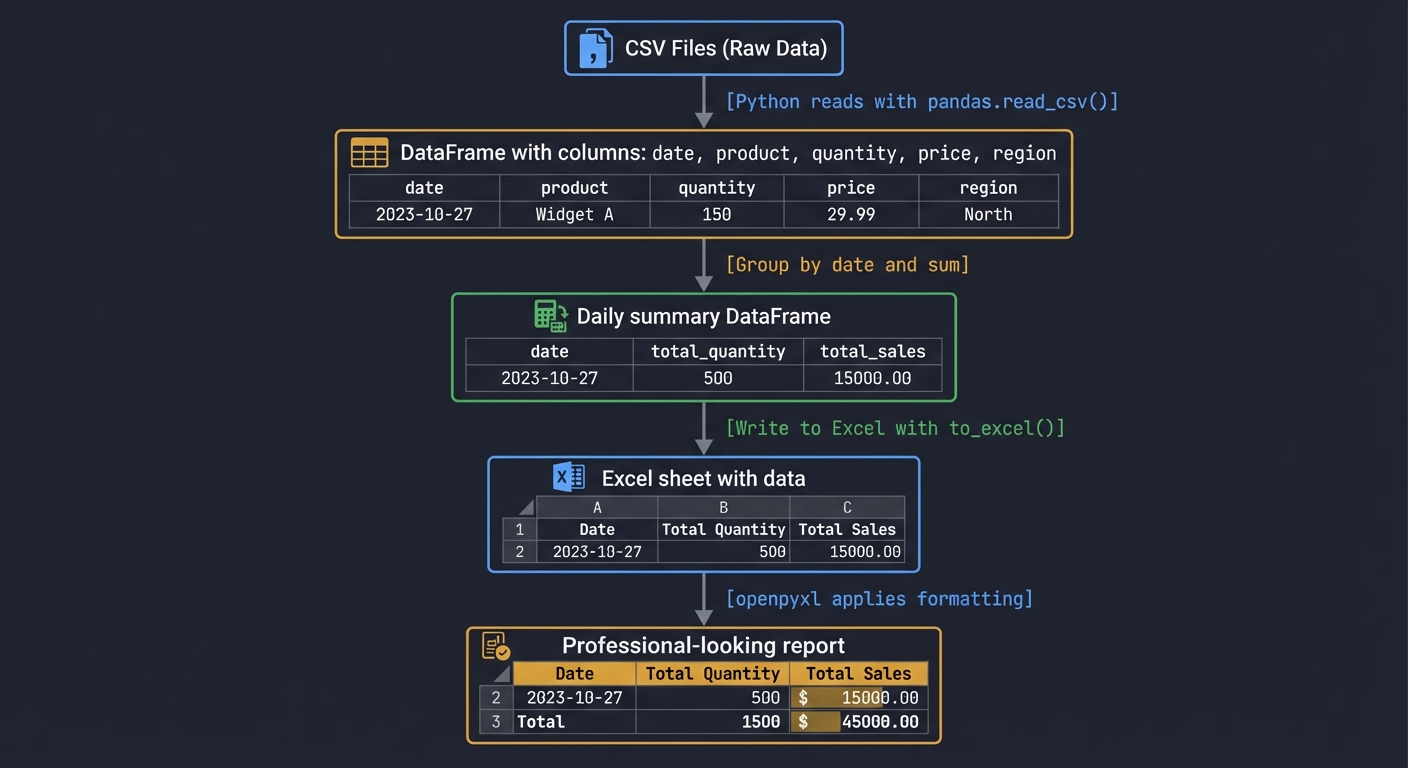
CSV Files (Raw Data)
└─> [Python reads with pandas.read_csv()]
    └─> DataFrame with columns: date, product, quantity, price, region
        └─> [Group by date and sum]
            └─> Daily summary DataFrame
                └─> [Write to Excel with to_excel()]
                    └─> Excel sheet with data
                        └─> [openpyxl applies formatting]
                            └─> Professional-looking report
Questions while tracing:
- At what point do you calculate the totals?
- When do you apply formatting—during write or after?
- How do you ensure the chart references the correct cells?
- What happens to the original CSV files? (They should remain unchanged)
The Interview Questions They’ll Ask
Prepare to answer these:
- “What’s the difference between
pandas.ExcelWriterandopenpyxl.Workbook.save()?” - “How would you handle a CSV file that’s too large to fit in memory?”
- “Why might you use
xlsxwriterinstead ofopenpyxl?” - “How do you preserve existing sheets when adding a new one to an Excel file?”
- “What’s the difference between formula-based calculations and pre-calculated values?”
- “How would you make your script idempotent (safe to run multiple times)?”
Hints in Layers
Hint 1: Start with Data Loading Read all CSVs and combine them:
import pandas as pd
import glob

csv_files = glob.glob('sales_*.csv')
dfs = [pd.read_csv(f) for f in csv_files]
combined = pd.concat(dfs, ignore_index=True)
Hint 2: Use ExcelWriter for Multiple Sheets
with pd.ExcelWriter('report.xlsx', engine='openpyxl') as writer:
    combined.to_excel(writer, sheet_name='Raw Data', index=False)
    daily_summary.to_excel(writer, sheet_name='Daily Summary', index=False)
Hint 3: Format After Writing Load the file back with openpyxl to apply formatting:
from openpyxl import load_workbook
from openpyxl.styles import Font, PatternFill

wb = load_workbook('report.xlsx')
ws = wb['Raw Data']

# Format headers
for cell in ws[1]:
    cell.font = Font(bold=True, color='FFFFFF')
    cell.fill = PatternFill(start_color='4472C4', end_color='4472C4', fill_type='solid')

wb.save('report.xlsx')
Hint 4: Add Charts
from openpyxl.chart import BarChart, Reference

chart = BarChart()
data = Reference(ws, min_col=2, min_row=1, max_row=11)
categories = Reference(ws, min_col=1, min_row=2, max_row=11)
chart.add_data(data, titles_from_data=True)
chart.set_categories(categories)
ws.add_chart(chart, 'E2')
Hint 5: Automate the Filename
from datetime import datetime

month_name = datetime.now().strftime('%B_%Y')
filename = f'{month_name}_Sales_Report.xlsx'
Books That Will Help
| Topic | Book | Chapter |
|---|---|---|
| pandas fundamentals | “Python for Data Analysis” by Wes McKinney | Ch. 5-6 |
| Reading/writing Excel with pandas | “Python for Data Analysis” by Wes McKinney | Ch. 6.3 |
| Excel automation with openpyxl | “Automate the Boring Stuff with Python” by Al Sweigart | Ch. 13 |
| Data aggregation and grouping | “Python for Data Analysis” by Wes McKinney | Ch. 10 |
| Chart creation with openpyxl | openpyxl official documentation | Charts section |
| Professional Python code structure | “Clean Code” by Robert C. Martin | Ch. 2-3 |
Project 2: Budget Variance Analyzer with Conditional Formatting
Build a tool that compares budgeted vs actual expenses and highlights variances automatically.
Every department submits a budget at the start of the year. Throughout the year, actual expenses are tracked. Finance needs to quickly identify where departments are over or under budget. Your task: create an automated variance analysis tool.
What you’ll build:
- Read budget data (planned expenses by category)
- Read actual expenses (real transactions throughout the year)
- Calculate variances (actual - budget) and percentage differences
- Apply conditional formatting (red for over budget, green for under budget)
- Add data bars to visualize variance magnitude
- Generate an executive summary sheet
Technologies:
pandasfor data comparisonopenpyxlfor advanced formatting (conditional rules, data bars)- Excel formulas embedded via Python
Real World Outcome
When you run your script:
$ python budget_variance_analyzer.py

Loading budget data...
✓ Loaded annual_budget_2024.xlsx (24 departments, 156 expense categories)

Loading actual expenses...
✓ Loaded expenses_Q1_2024.xlsx (1,247 transactions)
✓ Loaded expenses_Q2_2024.xlsx (1,389 transactions)
✓ Loaded expenses_Q3_2024.xlsx (1,423 transactions)
✓ Loaded expenses_Q4_2024.xlsx (1,512 transactions)

Calculating variances...
✓ Matched 156 expense categories
✓ Calculated dollar variances
✓ Calculated percentage variances
⚠ Found 12 categories over budget
✓ Found 23 categories under budget

Applying conditional formatting...
✓ Red highlights for over-budget items
✓ Green highlights for under-budget items
✓ Data bars showing variance magnitude
✓ Icon sets for quick visual scanning

Creating executive summary...
✓ Top 5 over-budget categories identified
✓ Top 5 under-budget categories identified
✓ Overall budget health: 95.3% spent

Report saved: Budget_Variance_Analysis_2024.xlsx
When you open the report, you see:
- Variance Analysis sheet:
╔══════════════════════╦═══════════╦═══════════╦═══════════╦════════════╦═══════════╗ ║ Category ║ Budget ║ Actual ║ Variance ║ Variance % ║ Status ║ ╠══════════════════════╬═══════════╬═══════════╬═══════════╬════════════╬═══════════╣ ║ Marketing - Digital ║ $50,000 ║ $47,500 ║ -$2,500 ║ -5.0% ║ ✓ Under ║ ← Green background ║ IT - Cloud Services ║ $120,000 ║ $134,500 ║ $14,500 ║ +12.1% ║ ⚠ Over ║ ← Red background ║ HR - Recruitment ║ $75,000 ║ $78,200 ║ $3,200 ║ +4.3% ║ ⚠ Over ║ ← Light red ║ ... ║ ... ║ ... ║ ... ║ ... ║ ... ║ ╚══════════════════════╩═══════════╩═══════════╩═══════════╩════════════╩═══════════╝- Conditional formatting automatically colors cells
- Data bars in the “Variance” column show magnitude visually
- Icon sets (✓, ⚠, ⛔) provide instant status recognition
- Columns auto-sized for readability
- Executive Summary sheet:
BUDGET HEALTH DASHBOARD Overall Status: 95.3% of Annual Budget Spent Remaining: $142,500 of $3,000,000 TOP OVER-BUDGET CATEGORIES: 1. IT - Cloud Services: +$14,500 (+12.1%) 2. Facilities - Maintenance: +$8,200 (+8.7%) 3. Legal - Consulting: +$6,800 (+13.6%) TOP UNDER-BUDGET CATEGORIES: 1. Travel - International: -$18,500 (-23.1%) 2. Training - External: -$12,300 (-16.4%) 3. Marketing - Events: -$9,700 (-19.4%) - Department Breakdown sheet:
- Each department’s total budget vs actual
- Sparkline charts showing spending trend by quarter
- Ranked from most over-budget to most under-budget
The transformation: Finance can now instantly see budget health. The conditional formatting draws the eye to problem areas. What used to require manual Excel formulas and formatting now updates automatically when new expense data arrives.
The Core Question You’re Answering
“How can I make Excel ‘smart’ so it automatically highlights what matters?”
You’re learning that Excel isn’t just a data container—it’s a decision support tool. Conditional formatting, formulas, and visual cues turn raw numbers into insights. Python lets you apply these features programmatically.
Concepts You Must Understand First
Stop and research these before coding:
- Excel Conditional Formatting Rules
- What types of conditional formatting exist? (Cell value, formula-based, color scales, data bars, icon sets)
- How does Excel evaluate conditional formatting rules?
- What’s the order of precedence when multiple rules apply?
- Resource: Excel official documentation on conditional formatting
- openpyxl Conditional Formatting API
- How do you create a
ColorScaleRule? - What’s the syntax for formula-based rules?
- How do you add data bars programmatically?
- Documentation: openpyxl.readthedocs.io/en/stable/formatting.html
- How do you create a
- Data Comparison Strategies
- How do you merge two DataFrames on a common key?
- What happens when keys don’t match (left join vs inner join)?
- How do you handle missing data after a merge?
- Book Reference: “Python for Data Analysis” Ch. 8 - Wes McKinney
- Percentage Calculations
- Formula: ((actual - budget) / budget) * 100
- How do you handle division by zero?
- Should percentages be stored as decimals (0.05) or whole numbers (5)?
- Concept: Basic arithmetic and error handling
- Excel Data Bars and Icon Sets
- How do data bars represent values visually?
- What are the threshold types? (Percent, number, formula, percentile)
- How do you customize colors and ranges?
- Resource: openpyxl documentation and Excel UI experimentation
Questions to Guide Your Design
Before implementing, think through these:
- Data Matching Strategy
- How do you ensure budget and actual data align correctly?
- What if actual expenses have categories not in the budget?
- Should you report unbudgeted expenses separately?
- Variance Definition
- Is positive variance good or bad? (Depends on context)
- What threshold defines “significantly over budget”? (>5%? >10%?)
- Should small variances be ignored or highlighted?
- Conditional Formatting Rules
- Should you use a color scale (gradient) or discrete colors?
- What colors are intuitive? (Red = bad, green = good is cultural)
- How many severity levels? (Just two, or green/yellow/red?)
- Formula vs Pre-calculated
- Should variance be calculated in Python and written as values?
- Or written as Excel formulas (
=C2-B2) that calculate live? - What are the tradeoffs?
- User Interaction
- Should users be able to edit the budget and see variance recalculate?
- Do you need to protect certain cells from editing?
- Should filters be enabled?
Thinking Exercise
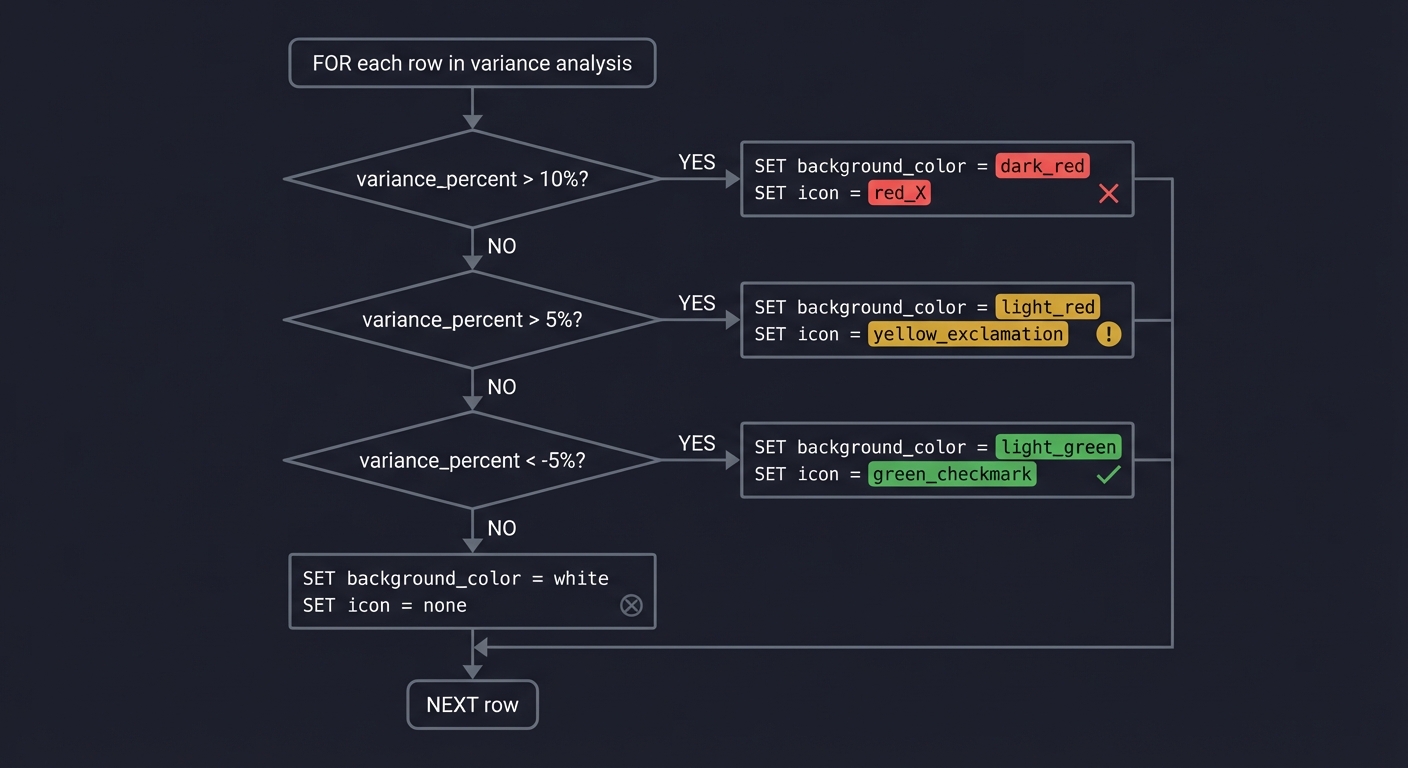
Design the Conditional Formatting Logic
Before coding, write pseudocode for your formatting rules:
FOR each row in variance analysis:
    IF variance_percent > 10%:
        SET background_color = dark_red
        SET icon = red_X
    ELSE IF variance_percent > 5%:
        SET background_color = light_red
        SET icon = yellow_exclamation
    ELSE IF variance_percent < -5%:
        SET background_color = light_green
        SET icon = green_checkmark
    ELSE:
        SET background_color = white
        SET icon = none
Questions while designing:
- Should you use rule-based (openpyxl applies rules) or cell-by-cell formatting?
- How do you handle edge cases (zero budget, missing actuals)?
- What if a category was budgeted but has no actual expenses yet?
The Interview Questions They’ll Ask
Prepare to answer these:
- “What’s the difference between applying formatting to individual cells vs using conditional formatting rules?”
- “How would you handle a budget file that’s updated mid-year?”
- “What’s the performance impact of formula-based cells vs pre-calculated values?”
- “How do you ensure your script doesn’t overwrite user’s manual edits to the Excel file?”
- “What Python data structure would you use to efficiently match budget to actual expenses?”
- “How would you extend this to handle multiple years of historical data?”
Hints in Layers
Hint 1: Merge Budget and Actual Data
budget_df = pd.read_excel('annual_budget_2024.xlsx')
actual_df = pd.read_excel('expenses_2024.xlsx')

# Group actual expenses by category
actual_summary = actual_df.groupby('Category')['Amount'].sum().reset_index()
actual_summary.columns = ['Category', 'Actual']

# Merge with budget
variance_df = budget_df.merge(actual_summary, on='Category', how='left')
variance_df['Actual'].fillna(0, inplace=True)  # Handle categories with no expenses
variance_df['Variance'] = variance_df['Actual'] - variance_df['Budget']
variance_df['Variance %'] = (variance_df['Variance'] / variance_df['Budget']) * 100
Hint 2: Apply Conditional Formatting with openpyxl
from openpyxl.formatting.rule import ColorScaleRule, DataBarRule, IconSetRule
from openpyxl.styles import PatternFill

# Color scale on variance percentage column
ws.conditional_formatting.add('E2:E157',
    ColorScaleRule(start_type='num', start_value=-20, start_color='00FF00',
                   mid_type='num', mid_value=0, mid_color='FFFF00',
                   end_type='num', end_value=20, end_color='FF0000'))

# Data bars on variance column
ws.conditional_formatting.add('D2:D157',
    DataBarRule(start_type='num', start_value=-50000, end_type='num', end_value=50000,
                color='638EC6'))
Hint 3: Add Icon Sets
from openpyxl.formatting.rule import IconSetRule

icon_set = IconSetRule('3Symbols', 'num', [5, 10], reverse=False)
ws.conditional_formatting.add('E2:E157', icon_set)
Hint 4: Create Executive Summary with Formulas
summary_ws = wb.create_sheet('Executive Summary')
summary_ws['A1'] = 'Total Budget'
summary_ws['B1'] = '=SUM(\'Variance Analysis\'!B:B)'
summary_ws['A2'] = 'Total Actual'
summary_ws['B2'] = '=SUM(\'Variance Analysis\'!C:C)'
Hint 5: Identify Top Variances
over_budget = variance_df[variance_df['Variance'] > 0].nlargest(5, 'Variance')
under_budget = variance_df[variance_df['Variance'] < 0].nsmallest(5, 'Variance')
Books That Will Help
| Topic | Book | Chapter |
|---|---|---|
| pandas merging and joining | “Python for Data Analysis” by Wes McKinney | Ch. 8 |
| Conditional formatting in Excel | “Excel 2024 Bible” by Michael Alexander | Ch. 21 |
| openpyxl formatting features | openpyxl official documentation | Conditional Formatting |
| Data aggregation | “Python for Data Analysis” by Wes McKinney | Ch. 10 |
| Handling missing data | “Python for Data Analysis” by Wes McKinney | Ch. 7 |
| Professional reporting | “Clean Code” by Robert C. Martin | Ch. 10 |
Project 3: Excel-to-Database ETL Pipeline
Build a system that extracts data from Excel files, transforms it, and loads it into a SQL database.
Your company receives client data in Excel spreadsheets from various sources. The data is inconsistent (different column names, date formats, missing values). You need to clean it, standardize it, and load it into a PostgreSQL database for analysis.
What you’ll build:
- Read Excel files with inconsistent structures
- Standardize column names (e.g., “Customer Name” vs “Client” vs “customer_name”)
- Clean and validate data (remove duplicates, handle missing values, validate emails)
- Transform data types (dates, phone numbers, zip codes)
- Load into a PostgreSQL database
- Generate a data quality report showing what was cleaned
Technologies:
pandasfor data transformationopenpyxlfor Excel readingSQLAlchemyfor database connectionpsycopg2for PostgreSQL- Data validation libraries
Real World Outcome
When you run your ETL pipeline:
$ python excel_to_db_etl.py

Starting ETL Pipeline...

[EXTRACT PHASE]
Scanning input directory...
✓ Found 7 Excel files to process

Loading client_data_vendor_A.xlsx...
  - Detected columns: ['Customer Name', 'Email Address', 'Phone', 'Join Date']
  - Loaded 1,247 rows

Loading client_data_vendor_B.xlsx...
  - Detected columns: ['client', 'email', 'phone_number', 'signup_date']
  - Loaded 892 rows

Loading client_data_vendor_C.xlsx...
  - Detected columns: ['name', 'contact_email', 'telephone', 'registration']
  - Loaded 1,534 rows

... (continues for all files)

Total rows loaded: 8,947

[TRANSFORM PHASE]
Standardizing column names...
  ✓ 'Customer Name', 'client', 'name' → 'customer_name'
  ✓ 'Email Address', 'email', 'contact_email' → 'email'
  ✓ 'Phone', 'phone_number', 'telephone' → 'phone'
  ✓ 'Join Date', 'signup_date', 'registration' → 'signup_date'

Cleaning data...
  ✓ Removed 247 duplicate records (based on email)
  ✓ Fixed 89 phone number formats (standardized to ###-###-####)
  ✓ Validated 8,700 email addresses
    ⚠ Flagged 34 invalid emails for review
  ✓ Parsed 8,700 dates (found 3 different date formats)
    ⚠ 12 unparseable dates set to NULL
  ✓ Standardized 412 zip codes (added leading zeros)
  ✓ Trimmed whitespace from all text fields

Data quality checks...
  ✓ customer_name: 100% populated
  ✓ email: 99.6% valid (34 invalid)
  ✓ phone: 87.3% populated (1,107 missing)
  ✓ signup_date: 99.9% valid (12 invalid)

[LOAD PHASE]
Connecting to PostgreSQL database...
✓ Connected to database 'company_db' on localhost

Creating/updating table 'customers'...
✓ Table structure validated

Loading data...
  ✓ Inserted 8,700 rows
  ✓ Skipped 247 duplicates
  ⚠ 34 rows flagged for manual review (saved to review_needed.xlsx)

[REPORTING PHASE]
Generating data quality report...
✓ Report saved: data_quality_report_2024-12-27.xlsx

Pipeline completed successfully!
━━━━━━━━━━━━━━━━━━━━━━━━━━━━━━━━━━━━━━━━━
Summary:
  • Files processed: 7
  • Total rows extracted: 8,947
  • Rows loaded to database: 8,700
  • Duplicates removed: 247
  • Rows needing review: 34
  • Success rate: 97.2%
━━━━━━━━━━━━━━━━━━━━━━━━━━━━━━━━━━━━━━━━━
When you open data_quality_report_2024-12-27.xlsx, you see:
- Summary Sheet:
- Total records processed
- Records successfully loaded
- Data quality scores per column
- Issues found and resolved
- Issues requiring manual intervention
- Transformation Log Sheet:
╔═══════════════════╦══════════════════╦═════════════════╦════════════════╗ ║ Source File ║ Original Rows ║ After Cleaning ║ Issues ║ ╠═══════════════════╬══════════════════╬═════════════════╬════════════════╣ ║ vendor_A.xlsx ║ 1,247 ║ 1,198 ║ 49 duplicates ║ ║ vendor_B.xlsx ║ 892 ║ 875 ║ 17 dup + invalid║ ║ vendor_C.xlsx ║ 1,534 ║ 1,512 ║ 22 duplicates ║ ╚═══════════════════╩══════════════════╩═════════════════╩════════════════╝ - Data Quality Metrics Sheet:
- Completeness: What % of each column is populated?
- Validity: What % passed validation rules?
- Consistency: How standardized is the data?
- Charts showing before/after quality scores
- Flagged Records Sheet:
- The 34 rows with invalid emails (for manual correction)
- The 12 rows with unparseable dates
- Highlighted in yellow for easy spotting
When you query the PostgreSQL database:
SELECT * FROM customers LIMIT 5;

 id | customer_name      | email                  | phone        | signup_date
----+--------------------+------------------------+--------------+-------------
  1 | John Smith         | john.smith@email.com   | 555-123-4567 | 2024-01-15
  2 | Jane Doe           | jane.doe@company.org   | 555-234-5678 | 2024-02-20
  3 | Robert Johnson     | robert.j@service.net   | 555-345-6789 | 2024-03-10
  4 | Maria Garcia       | maria.garcia@mail.com  | NULL         | 2024-04-05
  5 | Michael Williams   | mike.w@business.io     | 555-456-7890 | 2024-05-18
The transformation: Messy Excel files from multiple vendors are now clean, standardized data in a queryable database. The ETL pipeline is repeatable, logged, and produces a quality report for auditing.
The Core Question You’re Answering
“How do I reliably move data from Excel’s chaotic flexibility into a database’s structured rigidity?”
Excel allows anything in any cell. Databases enforce types, constraints, and structure. You’re learning to be the translator, handling the messy reality of real-world Excel data.
Concepts You Must Understand First
Stop and research these before coding:
- Database Schema vs Excel Flexibility
- What is a database schema?
- How do database constraints (NOT NULL, UNIQUE, FOREIGN KEY) differ from Excel?
- Why can’t you just “copy Excel into a database”?
- Book Reference: “The Practical SQL” Ch. 1-2 - Anthony DeBarros
- Data Type Mapping (Excel → SQL)
- How does an Excel “General” cell map to SQL types?
- What SQL type should you use for dates? (DATE, DATETIME, TIMESTAMP?)
- How do you handle Excel’s ambiguous numbers (zip code “02134” becomes 2134)?
- Resource: SQLAlchemy documentation on column types
- ETL Concepts (Extract, Transform, Load)
- What’s the purpose of each ETL phase?
- Why transform before loading (vs after)?
- What’s idempotency in ETL? Why does it matter?
- Book Reference: “Data Pipelines Pocket Reference” Ch. 1 - James Densmore
- pandas Data Cleaning
- How do you detect and remove duplicates? (
.drop_duplicates()) - How do you handle missing values? (
fillna(),dropna()) - How do you validate data? (regex, custom functions,
.apply()) - Book Reference: “Python for Data Analysis” Ch. 7 - Wes McKinney
- How do you detect and remove duplicates? (
- SQLAlchemy ORM vs Core
- What’s the difference between ORM (Object-Relational Mapping) and Core?
- How do you define a table schema in SQLAlchemy?
- How do you execute a bulk insert efficiently?
- Documentation: SQLAlchemy official docs
Questions to Guide Your Design
Before implementing, think through these:
- Column Mapping Strategy
- How do you detect that “Customer Name”, “client”, and “name” all mean the same thing?
- Should you hardcode mappings or auto-detect?
- What if a file has a column you don’t expect?
- Duplicate Detection
- What makes a record a duplicate? (Same email? Same name + date?)
- If duplicates exist, which one do you keep? (First, last, most recent?)
- Should you log what was removed?
- Validation Rules
- What makes an email “valid”? (Regex pattern? DNS check?)
- How do you standardize phone numbers? (US format? International?)
- What date formats should you support?
- Error Handling
- If one file has errors, do you stop the entire pipeline?
- Do you skip bad rows and continue?
- How do you report errors to a human for review?
- Database Loading
- Do you truncate and reload, or upsert (update existing, insert new)?
- How do you handle database connection failures?
- Should you use transactions (all-or-nothing)?
Thinking Exercise
Trace a Single Row Through the Pipeline
Take this row from vendor_B.xlsx:
| client          | email             | phone_number | signup_date |
|-----------------|-------------------|--------------|-------------|
| john smith      | JOHN@EMAIL.COM    | 5551234567   | 1/15/24     |
Trace its transformation:
- Extract: Read from Excel → becomes a pandas row
- Transform:
- Column rename:
client→customer_name - Name cleaning:
john smith→John Smith(title case) - Email cleaning:
JOHN@EMAIL.COM→john@email.com(lowercase) - Phone formatting:
5551234567→555-123-4567 - Date parsing:
1/15/24→2024-01-15(SQL DATE format)
- Column rename:
- Validate:
- Email regex check: ✓ valid
- Phone length check: ✓ 10 digits
- Date range check: ✓ reasonable (not future, not ancient)
- Load: Insert into database as:
INSERT INTO customers (customer_name, email, phone, signup_date)
VALUES ('John Smith', 'john@email.com', '555-123-4567', '2024-01-15');
Questions while tracing:
- At what point do you detect this might be a duplicate?
- What happens if the email regex fails?
- How do you preserve the original data for audit purposes?
The Interview Questions They’ll Ask
Prepare to answer these:
- “What’s the difference between an ETL and an ELT pipeline?”
- “How would you handle a 10GB Excel file that doesn’t fit in memory?”
- “What’s a database transaction and why is it important in data loading?”
- “How do you ensure your ETL pipeline is idempotent?”
- “What’s the CAP theorem and how does it relate to data consistency?”
- “How would you parallelize this pipeline to process files faster?”
Hints in Layers
Hint 1: Column Name Standardization
column_mapping = {
    'Customer Name': 'customer_name',
    'client': 'customer_name',
    'name': 'customer_name',
    'Email Address': 'email',
    'email': 'email',
    'contact_email': 'email',
    # ... etc
}

df.rename(columns=column_mapping, inplace=True)
Hint 2: Email Validation
import re

email_pattern = r'^[a-zA-Z0-9._%+-]+@[a-zA-Z0-9.-]+\.[a-zA-Z]{2,}$'

def is_valid_email(email):
    if pd.isna(email):
        return False
    return bool(re.match(email_pattern, str(email)))

df['email_valid'] = df['email'].apply(is_valid_email)
invalid_emails = df[~df['email_valid']]
Hint 3: Phone Number Cleaning
def clean_phone(phone):
    if pd.isna(phone):
        return None
    # Remove all non-digits
    digits = ''.join(filter(str.isdigit, str(phone)))
    if len(digits) == 10:
        return f'{digits[:3]}-{digits[3:6]}-{digits[6:]}'
    return None  # Invalid format

df['phone'] = df['phone'].apply(clean_phone)
Hint 4: Database Connection with SQLAlchemy
from sqlalchemy import create_engine, Table, Column, Integer, String, Date, MetaData

engine = create_engine('postgresql://user:password@localhost/company_db')
metadata = MetaData()

customers = Table('customers', metadata,
    Column('id', Integer, primary_key=True),
    Column('customer_name', String(255)),
    Column('email', String(255)),
    Column('phone', String(20)),
    Column('signup_date', Date)
)

metadata.create_all(engine)  # Creates table if not exists
Hint 5: Bulk Insert
# Convert DataFrame to list of dicts
records = df.to_dict('records')

# Insert in chunks for efficiency
chunk_size = 1000
for i in range(0, len(records), chunk_size):
    chunk = records[i:i+chunk_size]
    with engine.begin() as conn:
        conn.execute(customers.insert(), chunk)
Books That Will Help
| Topic | Book | Chapter |
|---|---|---|
| ETL fundamentals | “Data Pipelines Pocket Reference” by James Densmore | Ch. 1-2 |
| pandas data cleaning | “Python for Data Analysis” by Wes McKinney | Ch. 7 |
| Regular expressions for validation | “Python for Data Analysis” by Wes McKinney | Ch. 7.5 |
| SQL and database basics | “Practical SQL” by Anthony DeBarros | Ch. 1-4 |
| SQLAlchemy fundamentals | “Essential SQLAlchemy” by Jason Myers | Ch. 1-3 |
| Data validation strategies | “Clean Code” by Robert C. Martin | Ch. 7-8 |
Project 4: Live Excel Dashboard with xlwings
Build a real-time dashboard in Excel that calls Python functions to fetch and analyze data.
You’re building a sales dashboard that updates in real-time. Users want the familiarity of Excel, but need Python’s power for complex calculations, API calls, and machine learning predictions. Your task: create a live Excel dashboard where buttons and formulas trigger Python code.
What you’ll build:
- An Excel workbook with buttons that call Python functions
- Python UDFs (User-Defined Functions) callable from Excel formulas
- Real-time data refresh from APIs (e.g., fetch live stock prices, weather data)
- Complex calculations (statistical analysis, forecasts) done in Python but displayed in Excel
- Charts that update automatically when data refreshes
Technologies:
xlwingsfor bidirectional Excel-Python communicationrequestsfor API callspandasfor data manipulationscikit-learnfor forecasting (optional)- VBA macros to call Python functions
Real World Outcome
When you set up your dashboard and click the “Refresh Data” button in Excel:
# Python console output:
[2024-12-27 14:30:15] Excel called: refresh_sales_data()
[2024-12-27 14:30:15] Fetching data from API...
[2024-12-27 14:30:16] ✓ Retrieved 1,247 records
[2024-12-27 14:30:16] Calculating metrics...
[2024-12-27 14:30:16] ✓ Total revenue: $1,405,887
[2024-12-27 14:30:16] ✓ Average order: $125.02
[2024-12-27 14:30:16] ✓ Top product: Widget Pro
[2024-12-27 14:30:17] Generating forecast...
[2024-12-27 14:30:18] ✓ Next month prediction: $1,523,450 (±8.2%)
[2024-12-27 14:30:18] Writing results to Excel...
[2024-12-27 14:30:18] Dashboard updated successfully!
In Excel, you see the dashboard instantly update:
Dashboard Sheet:
╔═══════════════════════════════════════════════════════════╗
║              SALES DASHBOARD - LIVE DATA                  ║
║                Last Updated: 2024-12-27 14:30:18          ║
╠═══════════════════════════════════════════════════════════╣
║                                                            ║
║  📊 KEY METRICS                                           ║
║  ┌─────────────────┬─────────────────┬──────────────────┐ ║
║  │ Total Revenue   │ Orders          │ Avg Order Value  │ ║
║  │ $1,405,887      │ 11,247          │ $125.02          │ ║
║  │ ▲ +12.3%        │ ▲ +8.7%         │ ▲ +3.3%          │ ║
║  └─────────────────┴─────────────────┴──────────────────┘ ║
║                                                            ║
║  🏆 TOP PRODUCTS TODAY                                    ║
║  1. Widget Pro .......................... $145,234 (1,247 units)
║  2. Gadget Max .......................... $123,456 (987 units)
║  3. Tool Elite .......................... $98,765 (743 units)
║                                                            ║
║  📈 TREND CHART                                           ║
║  [Interactive line chart showing 30-day revenue trend]    ║
║                                                            ║
║  🔮 FORECAST                                              ║
║  Next Month Prediction: $1,523,450 (confidence: 91.8%)   ║
║  [Chart showing historical data + forecast with confidence bands]
║                                                            ║
║  [Refresh Data] [Export Report] [Settings]               ║
╚═══════════════════════════════════════════════════════════╝
Excel Formulas Using Python UDFs: In any Excel cell, you can now use custom Python functions:
=get_revenue("2024-12")          → Returns $1,405,887
=forecast_next_month()            → Returns $1,523,450
=top_products(5)                  → Returns array of top 5 products
=calculate_correlation(A2:A100, B2:B100)  → Python statistical analysis
When you type a formula, Python executes it instantly and returns the result to Excel.
The transformation: Business users get the Excel interface they love, but with Python’s unlimited computational power under the hood. The dashboard updates in seconds, not hours. Complex calculations that would be impossible in Excel formulas are now trivial Python calls.
The Core Question You’re Answering
“How do I give Excel users access to Python’s power without making them learn to code?”
You’re building a bridge. Excel is the user interface. Python is the engine. Users click buttons and use formulas—they don’t know (or care) that Python is doing the heavy lifting.
Concepts You Must Understand First
Stop and research these before coding:
- xlwings Architecture
- How does xlwings differ from openpyxl? (Live connection vs file manipulation)
- What’s the xlwings add-in and why do you need it?
- How does Excel call Python code? (VBA macros as bridges)
- Documentation: docs.xlwings.org/en/stable/quickstart.html
- User-Defined Functions (UDFs)
- What is a UDF in Excel?
- How do you decorate a Python function to make it callable from Excel?
- What data types can you pass between Excel and Python?
- How does caching work for UDFs?
- Documentation: docs.xlwings.org/en/stable/udfs.html
- VBA-Python Integration
- How does VBA’s
RunPythonwork? - What’s the execution model? (Excel → VBA → Python → back to Excel)
- How do you handle errors that occur in Python?
- Resource: xlwings documentation on calling Python from VBA
- How does VBA’s
- Excel Object Model via Python
- How do you reference specific ranges, sheets, workbooks in xlwings?
- What’s the difference between
.value,.formula, and.raw_value? - How do you read/write entire ranges efficiently?
- Documentation: docs.xlwings.org/en/stable/datastructures.html
- API Integration Basics
- How do you make HTTP requests in Python? (
requestslibrary) - What’s JSON and how do you parse it?
- How do you handle API authentication and rate limits?
- Book Reference: “Automate the Boring Stuff with Python” Ch. 14 - Al Sweigart
- How do you make HTTP requests in Python? (
Questions to Guide Your Design
Before implementing, think through these:
- UDF vs Button Click
- When should you use a UDF (formula-based)?
- When should you use a button that calls a Python function?
- What are the performance implications?
- Data Flow Direction
- Should Python push data to Excel, or should Excel pull from Python?
- How do you ensure the dashboard shows the latest data?
- Do you cache API responses or fetch fresh every time?
- Error Handling
- What happens if the API is down when a user clicks “Refresh”?
- How do you communicate errors to the Excel user?
- Should you show error messages in Excel cells or pop-ups?
- Performance
- How long can a user wait for a button click response? (2 seconds? 10 seconds?)
- Should long-running operations run asynchronously?
- How do you prevent Excel from freezing during Python execution?
- Distribution
- How do other users run your dashboard? (Do they need Python installed?)
- Can you package your Python code?
- What about security (macros must be enabled)?
Thinking Exercise
Design the Data Flow
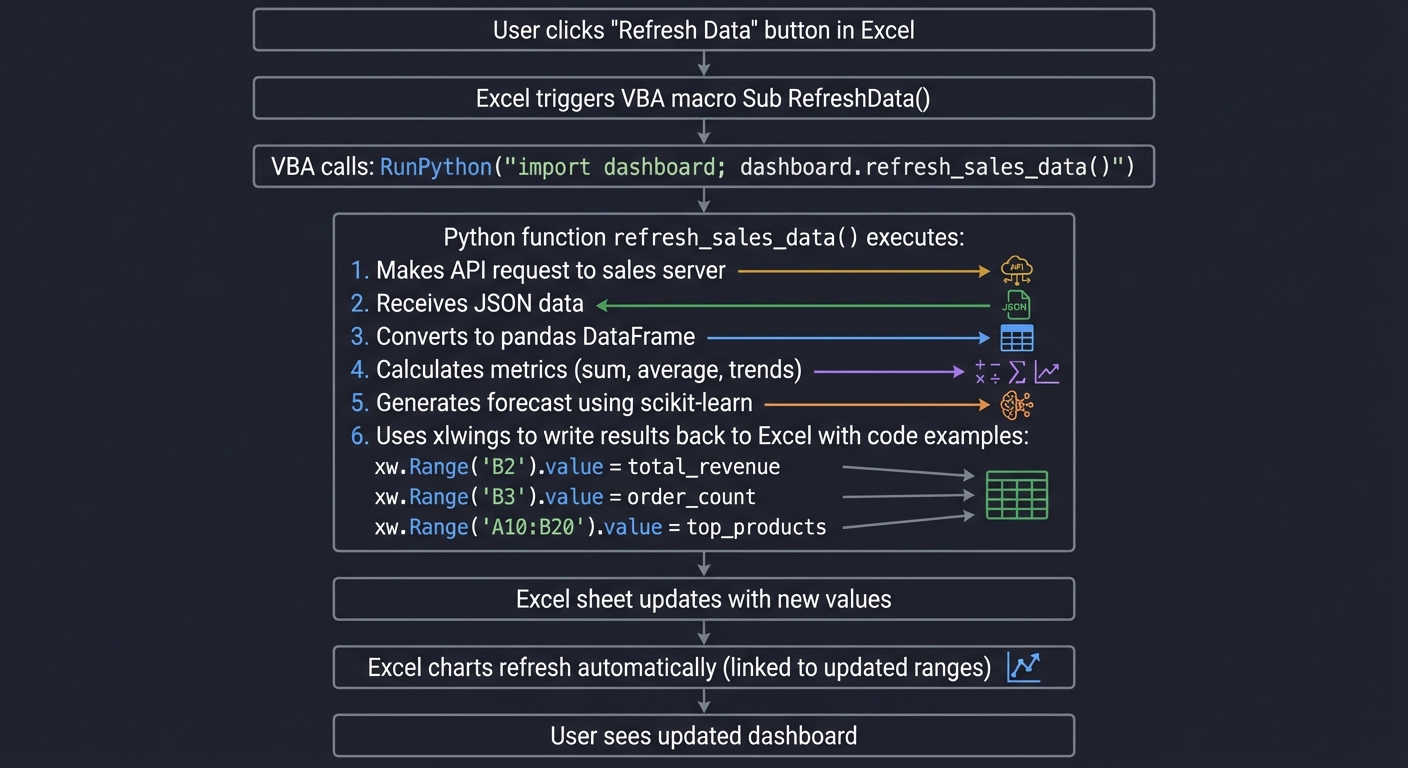
Trace what happens when a user clicks “Refresh Data”:
User clicks "Refresh Data" button in Excel
    ↓
Excel triggers VBA macro Sub RefreshData()
    ↓
VBA calls: RunPython("import dashboard; dashboard.refresh_sales_data()")
    ↓
Python function refresh_sales_data() executes:
    1. Makes API request to sales server
    2. Receives JSON data
    3. Converts to pandas DataFrame
    4. Calculates metrics (sum, average, trends)
    5. Generates forecast using scikit-learn
    6. Uses xlwings to write results back to Excel:
       - xw.Range('B2').value = total_revenue
       - xw.Range('B3').value = order_count
       - xw.Range('A10:B20').value = top_products
    ↓
Excel sheet updates with new values
    ↓
Excel charts refresh automatically (linked to updated ranges)
    ↓
User sees updated dashboard
Questions while tracing:
- What if the API call takes 30 seconds?
- How do you show a “Loading…” indicator?
- What if the API returns an error?
- How do you preserve chart formatting when data updates?
The Interview Questions They’ll Ask
Prepare to answer these:
- “What’s the difference between xlwings, openpyxl, and xlrd/xlsxwriter?”
- “How does xlwings handle Excel instances? (What if multiple Excel files are open?)”
- “What are the security implications of enabling macros for Excel-Python integration?”
- “How would you handle concurrent users trying to refresh the same Excel dashboard?”
- “What’s the performance impact of UDFs that recalculate on every cell change?”
- “How would you deploy this dashboard to users who don’t have Python installed?”
Hints in Layers
Hint 1: Set Up xlwings
# Install xlwings and create a new project
pip install xlwings
xlwings quickstart sales_dashboard
This creates:
sales_dashboard.xlsm(Excel file with macros enabled)sales_dashboard.py(Python code file)
Hint 2: Create a Simple UDF
# sales_dashboard.py
import xlwings as xw

@xw.func
def get_revenue(month):
    """Returns total revenue for specified month"""
    # Fetch from database or API
    data = fetch_sales_data(month)
    return sum(data['amount'])

# In Excel, use: =get_revenue("2024-12")
Hint 3: Create a Button-Triggered Function
# sales_dashboard.py
import xlwings as xw

def refresh_sales_data():
    """Called when user clicks Refresh button"""
    wb = xw.Book.caller()  # Get the workbook that called this function
    sheet = wb.sheets['Dashboard']

    # Fetch data
    data = fetch_from_api()

    # Write to Excel
    sheet.range('B2').value = data['total_revenue']
    sheet.range('B3').value = data['order_count']
    sheet.range('A10').value = data['top_products']  # Writes 2D array
VBA macro in Excel:
Sub RefreshData()
    RunPython("import sales_dashboard; sales_dashboard.refresh_sales_data()")
End Sub
Hint 4: Read Data from Excel into Python
def analyze_data():
    wb = xw.Book.caller()
    sheet = wb.sheets['Data']

    # Read range into pandas DataFrame
    data = sheet.range('A1').options(pd.DataFrame, header=True, index=False, expand='table').value

    # Perform analysis
    result = data.groupby('product')['revenue'].sum()

    # Write back
    sheet.range('E1').value = result
Hint 5: Handle Errors Gracefully
def refresh_sales_data():
    wb = xw.Book.caller()
    sheet = wb.sheets['Dashboard']

    try:
        sheet.range('A1').value = "Loading..."
        data = fetch_from_api()
        sheet.range('A1').value = "Last Updated: " + datetime.now().strftime('%Y-%m-%d %H:%M:%S')
        # ... update dashboard
    except Exception as e:
        sheet.range('A1').value = f"Error: {str(e)}"
        xw.apps.active.alert(f"Failed to refresh: {str(e)}")
Books That Will Help
| Topic | Book | Chapter |
|---|---|---|
| xlwings fundamentals | xlwings official documentation | Quickstart & Tutorial |
| VBA basics for Python integration | “Excel VBA Programming For Dummies” | Ch. 1-3 |
| API requests in Python | “Automate the Boring Stuff with Python” by Al Sweigart | Ch. 14 |
| pandas integration with xlwings | “Python for Data Analysis” by Wes McKinney | Ch. 6 |
| Excel object model | “Excel 2024 Power Programming with VBA” | Ch. 4-6 |
| Error handling in Python | “Fluent Python” by Luciano Ramalho | Ch. 7 |
Project 5: Automated Invoice Generator with Email Delivery
Build a system that generates personalized invoices in Excel and emails them to customers automatically.
Your company sends monthly invoices to hundreds of customers. Currently, someone manually fills in an Excel template for each customer, saves it as PDF, and emails it. Your task: automate the entire workflow.
What you’ll build:
- Read customer data and billing details from a database or Excel file
- For each customer, generate a personalized invoice using an Excel template
- Populate invoice with customer-specific data (name, items, amounts, taxes)
- Apply business logic (discounts, tax calculations, late fees)
- Save each invoice as a PDF
- Send invoices via email with personalized messages
- Generate a summary report of all invoices sent
Technologies:
openpyxlfor Excel template manipulationxlsxwriteroropenpyxlfor invoice generation- PDF generation (Excel’s built-in PDF export or
reportlab) smtplibfor email sendingjinja2for email template rendering (optional)
Real World Outcome
When you run your invoice automation system:
$ python generate_and_send_invoices.py --month 2024-12

╔════════════════════════════════════════════════════════════╗
║        AUTOMATED INVOICE GENERATION & DELIVERY             ║
╚════════════════════════════════════════════════════════════╝

[LOADING DATA]
✓ Loaded customer database (247 active customers)
✓ Loaded billing data for December 2024
✓ Loaded invoice template: invoice_template.xlsx

[GENERATING INVOICES]
Processing customer 1/247: Acme Corporation
  - Invoice #INV-2024-12-001
  - Items: 12 products, Total: $15,420.50
  - Discount applied: 10% (contract terms)
  - Tax calculated: $1,387.85 (9%)
  - Final amount: $16,808.35
  ✓ Invoice generated: invoices/2024-12/Acme_Corporation_INV-2024-12-001.xlsx
  ✓ PDF created: invoices/2024-12/Acme_Corporation_INV-2024-12-001.pdf

Processing customer 2/247: Beta Industries
  - Invoice #INV-2024-12-002
  - Items: 5 products, Total: $8,750.00
  - Late fee applied: $87.50 (payment overdue)
  - Tax calculated: $787.50 (9%)
  - Final amount: $9,625.00
  ⚠ Customer flagged: payment 15 days overdue
  ✓ Invoice generated: invoices/2024-12/Beta_Industries_INV-2024-12-002.xlsx
  ✓ PDF created: invoices/2024-12/Beta_Industries_INV-2024-12-002.pdf

... (continues for all customers)

Progress: ████████████████████████████████████ 247/247 (100%)

[SENDING EMAILS]
Connecting to SMTP server (smtp.gmail.com:587)...
✓ Connected and authenticated

Sending to customer 1/247: billing@acmecorp.com
  Subject: "Your December 2024 Invoice - $16,808.35"
  Attachments: Acme_Corporation_INV-2024-12-001.pdf
  ✓ Email sent successfully

Sending to customer 2/247: ap@betaindustries.com
  Subject: "Your December 2024 Invoice - $9,625.00 [PAYMENT OVERDUE]"
  Attachments: Beta_Industries_INV-2024-12-002.pdf
  ⚠ Email sent with overdue notice

... (continues for all customers)

Progress: ████████████████████████████████████ 247/247 (100%)

[GENERATING SUMMARY REPORT]
✓ Created summary: Invoice_Summary_2024-12.xlsx
  - Total invoices: 247
  - Total revenue: $2,847,623.50
  - Average invoice: $11,529.04
  - Customers with overdue payments: 18
  - Emails sent successfully: 245
  - Email failures: 2 (invalid addresses)

[COMPLETE]
━━━━━━━━━━━━━━━━━━━━━━━━━━━━━━━━━━━━━━━━━━━━━━━━━━━━━━
✓ Generated 247 invoices
✓ Created 247 PDFs
✓ Sent 245 emails
⚠ 2 emails failed (see failed_emails.log)
✓ Summary report saved

Total time: 3 minutes 42 seconds
Average time per invoice: 0.9 seconds
━━━━━━━━━━━━━━━━━━━━━━━━━━━━━━━━━━━━━━━━━━━━━━━━━━━━━━
What a Generated Invoice Looks Like (Excel/PDF):
╔══════════════════════════════════════════════════════════════════╗
║                      YOUR COMPANY NAME                            ║
║                   123 Business St, City, ST 12345                 ║
║                      Phone: (555) 123-4567                        ║
╠══════════════════════════════════════════════════════════════════╣
║                                                                    ║
║  INVOICE                                    Invoice #: INV-2024-12-001
║                                             Date: December 31, 2024
║                                             Due Date: January 30, 2025
║                                                                    ║
║  BILL TO:                                                         ║
║  Acme Corporation                                                 ║
║  456 Client Ave                                                   ║
║  Customer City, ST 67890                                          ║
║  Contact: John Smith (john@acmecorp.com)                         ║
║                                                                    ║
║  ┌────┬─────────────────────┬─────┬──────────┬────────────┬─────────────┐
║  │ #  │ Description         │ Qty │ Unit Price│ Amount     │ Tax        │
║  ├────┼─────────────────────┼─────┼──────────┼────────────┼─────────────┤
║  │ 1  │ Widget Pro          │ 50  │ $125.00  │ $6,250.00  │ $562.50    │
║  │ 2  │ Gadget Max          │ 30  │ $89.50   │ $2,685.00  │ $241.65    │
║  │ 3  │ Tool Elite          │ 75  │ $67.30   │ $5,047.50  │ $454.28    │
║  │... │ ...                 │ ... │ ...      │ ...        │ ...        │
║  └────┴─────────────────────┴─────┴──────────┴────────────┴─────────────┘
║                                                                    ║
║                                              Subtotal: $15,420.50 ║
║                                         Discount (10%): -$1,542.05║
║                                            Subtotal: $13,878.45   ║
║                                              Tax (9%): $1,249.06  ║
║                                                                    ║
║                                         TOTAL DUE: $15,127.51     ║
║                                                                    ║
║  Payment Terms: Net 30 days                                       ║
║  Payment Methods: Check, Wire Transfer, Credit Card               ║
║                                                                    ║
║  Thank you for your business!                                     ║
╚══════════════════════════════════════════════════════════════════╝
Email Sent to Customer:
From: billing@yourcompany.com
To: billing@acmecorp.com
Subject: Your December 2024 Invoice - $15,127.51

Dear John Smith,

Thank you for your continued business with Your Company Name.

Please find attached your invoice for December 2024.

Invoice Details:
  Invoice Number: INV-2024-12-001
  Invoice Date: December 31, 2024
  Amount Due: $15,127.51
  Due Date: January 30, 2025

Your 10% contract discount has been applied.

For your convenience, you can pay online at: https://yourcompany.com/pay/INV-2024-12-001

If you have any questions about this invoice, please contact our billing department.

Best regards,
Your Company Accounts Receivable Team

---
This is an automated message. Please do not reply to this email.
The transformation: What used to take an employee 2-3 full days now happens in under 4 minutes. Zero human error. Perfect consistency. Immediate delivery. Customers receive invoices at the exact same time every month.
The Core Question You’re Answering
“How do I transform data into personalized, professional documents at scale?”
This is template-based document automation—a foundational pattern in business automation. You’re learning to separate structure (the template) from content (the data), then merge them programmatically.
Concepts You Must Understand First
Stop and research these before coding:
- Template-Based Document Generation
- What is a template? (A document with placeholders)
- How do you identify placeholders? (Special markers like
{{customer_name}}) - How do you fill in placeholders with real data?
- Pattern: Template Method pattern from design patterns
- Excel as a PDF Source
- How do you export Excel to PDF from Python?
- What are the differences between libraries? (openpyxl, xlsxwriter, win32com)
- What about print area, page breaks, headers/footers?
- Resource: openpyxl documentation on printing
- SMTP Email Fundamentals
- What is SMTP? (Simple Mail Transfer Protocol)
- How do you authenticate? (Username/password, OAuth, app passwords)
- What’s the difference between To, CC, BCC?
- How do you attach files to emails?
- Book Reference: “Automate the Boring Stuff with Python” Ch. 18 - Al Sweigart
- Email MIME Types
- What is a MIME multipart message?
- How do you create both plain text and HTML email bodies?
- How are attachments encoded?
- Resource: Python
emailmodule documentation
- Business Logic (Discounts, Taxes, Fees)
- How do you calculate percentage-based discounts?
- How do you apply tiered pricing?
- What’s the order of operations? (Discount first, then tax?)
- Concept: Business rules and domain logic
Questions to Guide Your Design
Before implementing, think through these:
- Template Design
- Should you use an actual Excel file as template, or generate from scratch?
- How do you mark placeholders? (Specific cell values like
{{name}}?) - How do you handle variable-length lists (e.g., line items)?
- Data Source
- Where does customer and billing data come from? (Database, CSV, another Excel file?)
- What if customer data is missing or incomplete?
- How do you validate data before generating invoices?
- Business Rules
- How do you determine which discount applies to each customer?
- Are tax rates fixed or location-based?
- When should late fees be applied?
- PDF Generation
- Should you save both Excel and PDF, or just PDF?
- How do you ensure PDF formatting matches Excel exactly?
- What if Excel isn’t installed (Linux server)?
- Email Delivery
- How do you handle email failures? (Retry? Log and continue?)
- Should you send immediately or queue and batch-send?
- How do you avoid being marked as spam?
- What about rate limiting (max emails per hour)?
Thinking Exercise
Design the Invoice Template
Before coding, sketch out your Excel template structure:
Row 1-5: Company header (logo, address, contact)
Row 7: "INVOICE" title
Row 8: Invoice # (cell B8 contains: "{{invoice_number}}")
Row 9: Date (cell B9 contains: "{{invoice_date}}")
Row 10: Due Date (cell B10 contains: "{{due_date}}")

Row 12-15: Customer info
  Cell B12: "{{customer_name}}"
  Cell B13: "{{customer_address}}"
  Cell B14: "{{customer_city_state_zip}}"
  Cell B15: "{{customer_contact}}"

Row 17: Table header (Item # | Description | Qty | Unit Price | Amount | Tax)
Row 18-47: Line items (up to 30 items)
  Each row: "{{item_N_description}}", "{{item_N_qty}}", etc.

Row 49: Subtotal = "{{subtotal}}"
Row 50: Discount = "{{discount}}"
Row 51: Subtotal after discount
Row 52: Tax = "{{tax}}"
Row 53: TOTAL DUE = "{{total}}"

Row 55-60: Payment terms and thank you message
Questions while designing:
- How do you handle customers with > 30 line items?
- Should formulas calculate totals, or should Python pre-calculate?
- How do you ensure the template isn’t accidentally modified?
The Interview Questions They’ll Ask
Prepare to answer these:
- “How would you handle invoices that need to be generated in multiple languages?”
- “What’s the best way to prevent email from being marked as spam?”
- “How do you securely store SMTP credentials?”
- “What if a customer needs a correction to an already-sent invoice?”
- “How would you scale this to handle 10,000 invoices instead of 247?”
- “What’s the difference between generating Excel then converting to PDF vs generating PDF directly?”
Hints in Layers
Hint 1: Load Template and Customer Data
from openpyxl import load_workbook
import pandas as pd

# Load template
template = load_workbook('invoice_template.xlsx')

# Load customer data
customers = pd.read_excel('customer_billing_data.xlsx')
Hint 2: Fill Template for One Customer
def generate_invoice(customer_data, invoice_num):
    wb = load_workbook('invoice_template.xlsx')
    ws = wb.active

    # Fill in customer data
    ws['B8'] = f'INV-2024-12-{invoice_num:03d}'
    ws['B9'] = datetime.now().strftime('%B %d, %Y')
    ws['B10'] = (datetime.now() + timedelta(days=30)).strftime('%B %d, %Y')
    ws['B12'] = customer_data['name']
    ws['B13'] = customer_data['address']
    ws['B14'] = f"{customer_data['city']}, {customer_data['state']} {customer_data['zip']}"

    # Fill line items
    row = 18
    subtotal = 0
    for item in customer_data['items']:
        ws[f'A{row}'] = item['description']
        ws[f'B{row}'] = item['quantity']
        ws[f'C{row}'] = item['unit_price']
        ws[f'D{row}'] = item['quantity'] * item['unit_price']
        subtotal += item['quantity'] * item['unit_price']
        row += 1

    # Calculate totals
    discount = subtotal * customer_data['discount_rate']
    subtotal_after_discount = subtotal - discount
    tax = subtotal_after_discount * 0.09
    total = subtotal_after_discount + tax

    ws['D49'] = subtotal
    ws['D50'] = -discount
    ws['D52'] = tax
    ws['D53'] = total

    filename = f"invoices/2024-12/{customer_data['name'].replace(' ', '_')}_INV-2024-12-{invoice_num:03d}.xlsx"
    wb.save(filename)
    return filename, total
Hint 3: Convert Excel to PDF
# On Windows with Excel installed:
import win32com.client

def excel_to_pdf(excel_file, pdf_file):
    excel = win32com.client.Dispatch("Excel.Application")
    excel.Visible = False
    wb = excel.Workbooks.Open(excel_file)
    wb.ExportAsFixedFormat(0, pdf_file)  # 0 = PDF format
    wb.Close()
    excel.Quit()

# Alternative: Use xlsxwriter (limited formatting)
# Alternative: Use reportlab to generate PDF directly
Hint 4: Send Email with Attachment
import smtplib
from email.mime.multipart import MIMEMultipart
from email.mime.text import MIMEText
from email.mime.base import MIMEBase
from email import encoders

def send_invoice_email(customer_email, customer_name, pdf_file, invoice_amount):
    sender = 'billing@yourcompany.com'
    password = 'your_app_password'

    msg = MIMEMultipart()
    msg['From'] = sender
    msg['To'] = customer_email
    msg['Subject'] = f'Your December 2024 Invoice - ${invoice_amount:,.2f}'

    body = f"""Dear {customer_name},

Thank you for your continued business with Your Company Name.

Please find attached your invoice for December 2024.

Amount Due: ${invoice_amount:,.2f}

Best regards,
Your Company Accounts Receivable Team
"""
    msg.attach(MIMEText(body, 'plain'))

    # Attach PDF
    with open(pdf_file, 'rb') as f:
        part = MIMEBase('application', 'octet-stream')
        part.set_payload(f.read())
        encoders.encode_base64(part)
        part.add_header('Content-Disposition', f'attachment; filename={os.path.basename(pdf_file)}')
        msg.attach(part)

    # Send email
    server = smtplib.SMTP('smtp.gmail.com', 587)
    server.starttls()
    server.login(sender, password)
    server.send_message(msg)
    server.quit()
Hint 5: Process All Customers with Progress Tracking
from tqdm import tqdm  # Progress bar library

total_revenue = 0
email_failures = []

for idx, customer in tqdm(customers.iterrows(), total=len(customers), desc="Processing"):
    try:
        # Generate invoice
        excel_file, total = generate_invoice(customer, idx + 1)
        pdf_file = excel_to_pdf(excel_file)

        # Send email
        send_invoice_email(customer['email'], customer['name'], pdf_file, total)

        total_revenue += total
    except Exception as e:
        email_failures.append({'customer': customer['name'], 'error': str(e)})

print(f"Total revenue: ${total_revenue:,.2f}")
print(f"Email failures: {len(email_failures)}")
Books That Will Help
| Topic | Book | Chapter |
|---|---|---|
| Excel automation with openpyxl | “Automate the Boring Stuff with Python” by Al Sweigart | Ch. 13 |
| Email automation | “Automate the Boring Stuff with Python” by Al Sweigart | Ch. 18 |
| PDF generation | “Automate the Boring Stuff with Python” by Al Sweigart | Ch. 15 |
| Template pattern | “Design Patterns” by Gang of Four | Template Method |
| Business logic design | “Clean Code” by Robert C. Martin | Ch. 6 |
| Error handling and logging | “Fluent Python” by Luciano Ramalho | Ch. 7 |