Project 9: Network Diagnostic Toolkit
Build a CLI suite that wraps core networking tools into a consistent, automated diagnostic workflow.
Quick Reference
| Attribute | Value |
|---|---|
| Difficulty | Level 3: Advanced |
| Time Estimate | 2-3 weeks |
| Language | Bash (Alternatives: Python, Go) |
| Prerequisites | Projects 3-6, basic TCP/IP, familiarity with curl and ping |
| Key Topics | network diagnostics, parallel execution, parsing, reporting |
1. Learning Objectives
By completing this project, you will:
- Automate common network diagnostics into a single CLI.
- Parse and normalize outputs from tools like
ping,traceroute,dig. - Run checks in parallel with timeouts and retries.
- Generate human-readable and machine-readable reports.
- Build a modular diagnostic framework for new checks.
2. Theoretical Foundation
2.1 Core Concepts
- Latency and packet loss: Measuring reliability and responsiveness.
- DNS resolution: Tracing issues across resolvers.
- Routing: Understanding hop-by-hop paths and bottlenecks.
- Connectivity vs reachability: The difference between TCP connectivity and ICMP reachability.
- Timeouts and retries: Robustness for flaky networks.
2.2 Why This Matters
When networks fail, time is critical. A repeatable diagnostic tool reduces guesswork, supports incident response, and provides evidence for root cause analysis.
2.3 Historical Context / Background
Tools like ping and traceroute date back to early Unix systems and remain foundational. Modern environments wrap these tools into automated playbooks; you will build your own.
2.4 Common Misconceptions
- “Ping failure means host is down.” ICMP may be blocked.
- “DNS works if one resolver works.” Cached results can hide issues.
- “Traceroute always shows the real path.” Firewalls and load balancing distort paths.
3. Project Specification
3.1 What You Will Build
A CLI toolkit called netdiag that performs a standard diagnostic suite: ping, DNS lookup, traceroute, TCP port check, and HTTP request validation. It outputs a summary report plus optional JSON.
3.2 Functional Requirements
- Ping test: Latency and packet loss.
- DNS test: Resolve via system and custom resolvers.
- Traceroute: Show hop latency and detect breaks.
- Port check: TCP connect test to host:port.
- HTTP check: Validate response code and headers.
- Parallel mode: Run multiple hosts concurrently.
- Output: Summary + JSON report.
3.3 Non-Functional Requirements
- Reliability: Handle missing tools gracefully.
- Speed: Parallel checks with timeouts.
- Usability: Clear summary and exit codes.
3.4 Example Usage / Output
$ netdiag example.com --port 443 --http
[netdiag] ping: avg=14ms loss=0%
[netdiag] dns: system=93.184.216.34 resolver=93.184.216.34
[netdiag] tcp: 443 open (12ms)
[netdiag] http: 200 OK
3.5 Real World Outcome
You can run netdiag during outages to quickly identify whether failures are DNS, routing, firewall, or service-level issues.
4. Solution Architecture
4.1 High-Level Design
hosts -> check runner -> parsers -> report builder -> stdout/json
                 |         |
                 |         +-> normalized metrics
                 +-> parallel workers
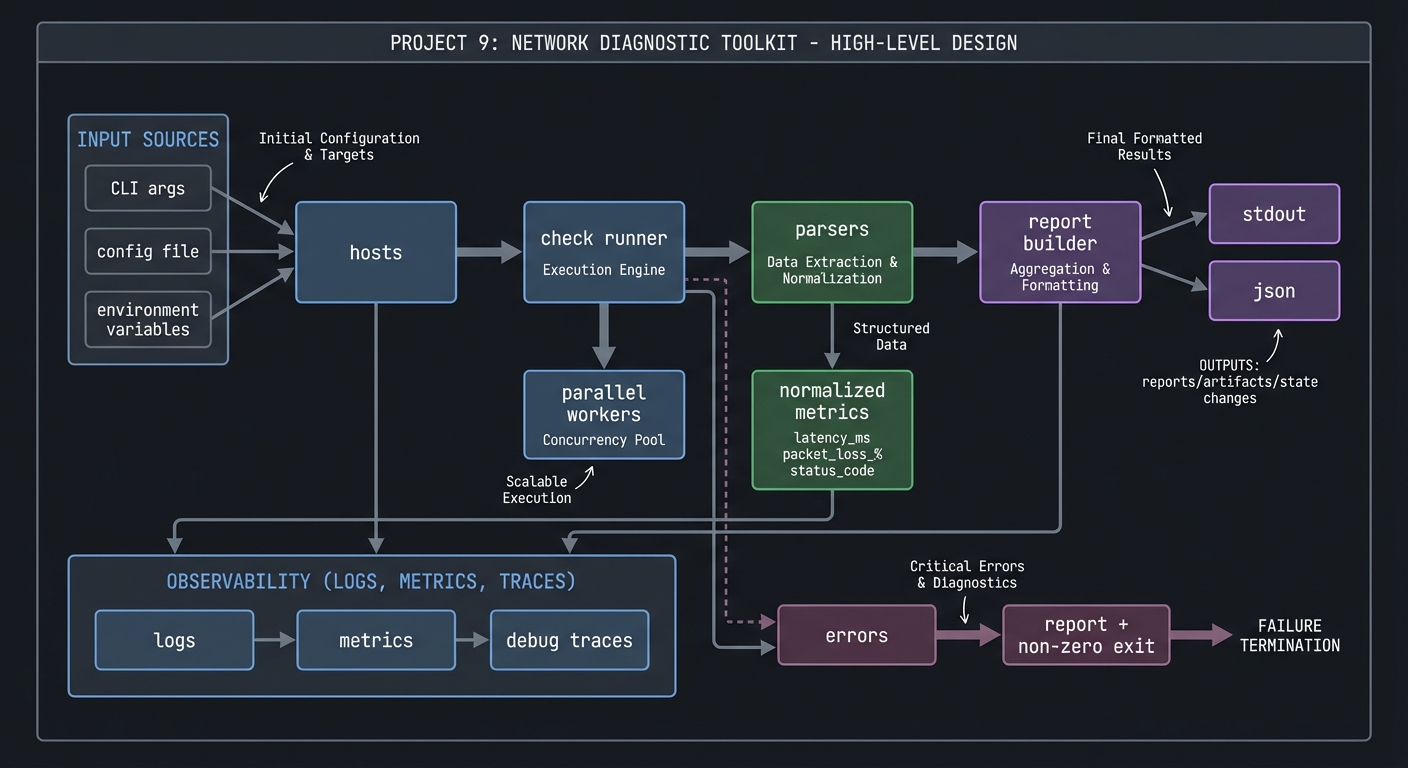
4.2 Key Components
| Component | Responsibility | Key Decisions |
|---|---|---|
| Runner | Orchestrate checks | sequential vs parallel |
| Parsers | Normalize outputs | regex vs field parsing |
| Report builder | Summarize results | table + JSON |
| Tool adapter | Detect tool availability | fallback strategies |
4.3 Data Structures
RESULT[ping_avg]=14
RESULT[dns_ip]="93.184.216.34"
4.4 Algorithm Overview
Key Algorithm: Parallel Checks
- Build job list from host + check.
- Spawn background jobs with timeouts.
- Collect exit codes and outputs.
- Merge results into report.
Complexity Analysis:
- Time: O(h*c) with parallelism (h hosts, c checks)
- Space: O(h*c) for results
5. Implementation Guide
5.1 Development Environment Setup
sudo apt-get install iputils-ping traceroute dnsutils curl
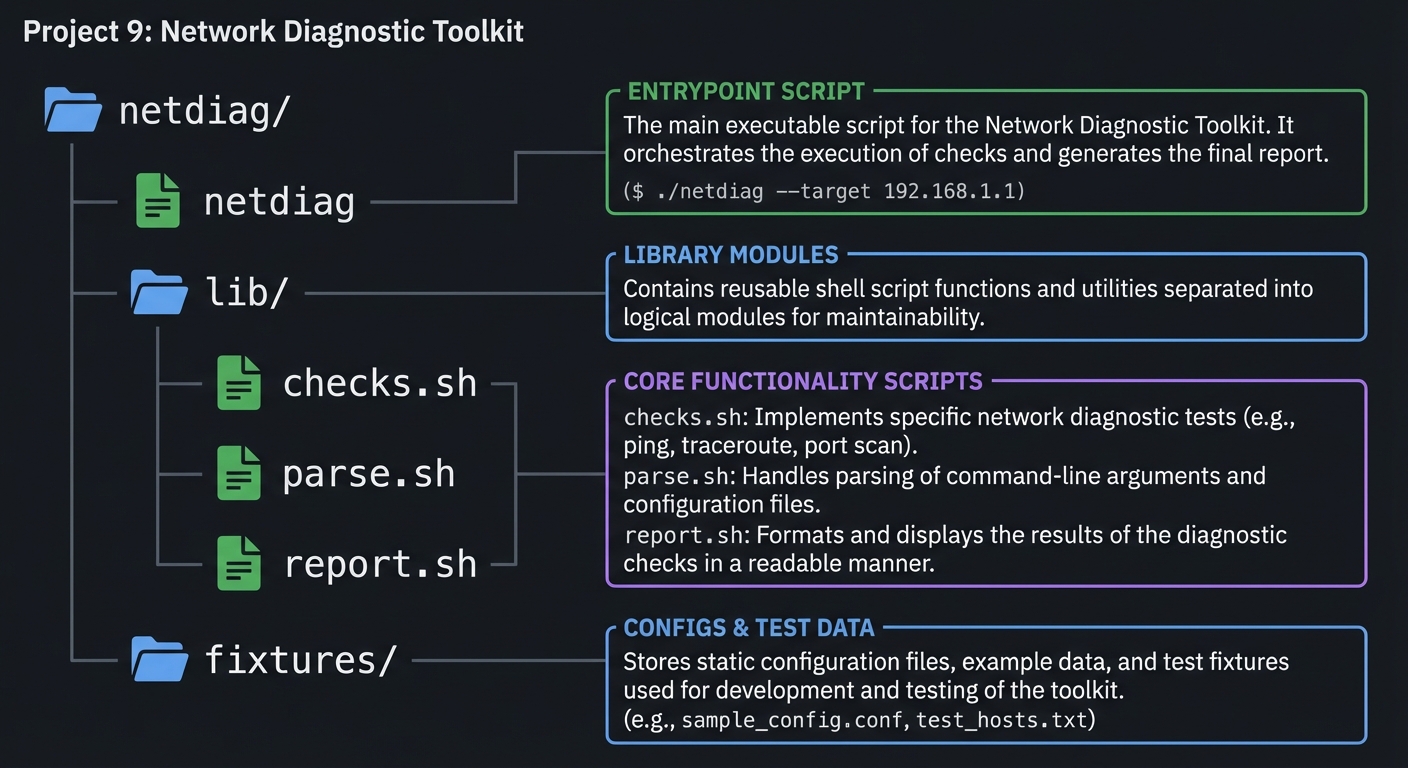
5.2 Project Structure
netdiag/
|-- netdiag
|-- lib/
|   |-- checks.sh
|   |-- parse.sh
|   `-- report.sh
`-- fixtures/
5.3 The Core Question You Are Answering
“How can I prove where the network is failing, not just that it is failing?”
5.4 Concepts You Must Understand First
- ICMP vs TCP checks
- DNS resolution and caching
- Timeouts and retry strategies
5.5 Questions to Guide Your Design
- How will you standardize outputs from different tools?
- How do you handle missing
tracerouteor restricted ICMP? - What exit code should represent “partial failure”?
5.6 Thinking Exercise
Create a flowchart for a failed HTTP check: is it DNS? TCP? TLS? HTTP?
5.7 The Interview Questions They Will Ask
- Why might ping fail but TCP still succeed?
- How do you detect DNS resolution issues?
- How do you design retries without amplifying outages?
5.8 Hints in Layers
Hint 1: Start by wrapping ping and parsing avg latency.
Hint 2: Add DNS resolution with dig +short.
Hint 3: Add nc -z for TCP port tests.
Hint 4: Add parallelism with & and wait.
5.9 Books That Will Help
| Topic | Book | Chapter |
|---|---|---|
| Networking basics | “Computer Networking: A Top-Down Approach” | Ch. 1-2 |
| Linux networking tools | “Linux Network Administrators Guide” | Ch. 6 |
5.10 Implementation Phases
Phase 1: Core Checks (4-5 days)
Goals:
- Ping, DNS, TCP check.
Tasks:
- Implement check functions with parsers.
- Build summary output.
Checkpoint: Output matches manual commands.
Phase 2: Parallel Execution (4-5 days)
Goals:
- Run checks concurrently.
Tasks:
- Background jobs per host.
- Collect and merge results.
Checkpoint: Performance improves with multiple hosts.
Phase 3: Reports and Polish (3-4 days)
Goals:
- JSON output and error handling.
Tasks:
- Add
--jsonoutput. - Add timeouts and retries.
Checkpoint: JSON output is valid and consistent.
5.11 Key Implementation Decisions
| Decision | Options | Recommendation | Rationale |
|---|---|---|---|
| Parallelism | background jobs vs xargs | background jobs | simplest |
| Parsing | regex vs structured flags | structured flags | more reliable |
| Output | table only vs JSON | both | human + machine |
6. Testing Strategy
6.1 Test Categories
| Category | Purpose | Examples |
|---|---|---|
| Unit | Parser correctness | ping output fixtures |
| Integration | Multi-check runs | local host tests |
| Edge Cases | Tool missing | simulate traceroute absent |
6.2 Critical Test Cases
- DNS resolver returns NXDOMAIN.
- TCP port closed returns exit code 1.
- Ping loss > 50% triggers warning.
6.3 Test Data
fixtures/ping_sample.txt
fixtures/dig_sample.txt
7. Common Pitfalls and Debugging
7.1 Frequent Mistakes
| Pitfall | Symptom | Solution |
|---|---|---|
| Parsing localized output | regex fails | force LANG=C |
| No timeout | commands hang | use timeout |
| Blind retries | extended outages | cap retries |
7.2 Debugging Strategies
- Log raw tool output in debug mode.
- Compare output with manual runs.
7.3 Performance Traps
Over-parallelizing can overwhelm DNS resolvers or networks. Limit concurrency.
8. Extensions and Challenges
8.1 Beginner Extensions
- Add
--verbosemode. - Add saved reports.
8.2 Intermediate Extensions
- Add TLS handshake timing.
- Add bandwidth test integration (iperf).
8.3 Advanced Extensions
- Build a continuous monitoring mode.
- Add Slack or email notifications.
9. Real-World Connections
9.1 Industry Applications
- Network troubleshooting in SRE.
- Site reliability triage tools.
9.2 Related Open Source Projects
- mtr: combined ping/traceroute tool.
- smokeping: latency monitoring.
9.3 Interview Relevance
- Demonstrates understanding of network diagnostics.
- Shows ability to automate operational playbooks.
10. Resources
10.1 Essential Reading
man ping,man traceroute,man dig,man nc
10.2 Video Resources
- “How Traceroute Works” (YouTube)
10.3 Tools and Documentation
curl,nc,dig,timeout
10.4 Related Projects in This Series
- Project 3: Log Parser & Alert System
- Project 10: Deployment Automation
11. Self-Assessment Checklist
11.1 Understanding
- I can explain why ICMP and TCP checks differ.
- I can interpret traceroute output.
11.2 Implementation
- Reports generate for multiple hosts.
- JSON output validates.
11.3 Growth
- I can extend with new checks quickly.
12. Submission / Completion Criteria
Minimum Viable Completion:
- Ping, DNS, TCP checks with summary
Full Completion:
- Parallel mode + JSON output
Excellence (Going Above & Beyond):
- Continuous monitoring + notifications