Project 6: System Health Monitor and Dashboard
Build a real-time TUI system monitor that reads kernel metrics directly and presents actionable dashboards with alerts.
Quick Reference
| Attribute | Value |
|---|---|
| Difficulty | Level 3: Advanced |
| Time Estimate | 2-3 weeks |
| Language | Bash (Alternatives: POSIX sh, Python, Go) |
| Prerequisites | Projects 3-5, solid CLI comfort, basic OS concepts, familiarity with /proc |
| Key Topics | /proc parsing, ANSI TUI, signal handling, rate calculations, process inspection |
1. Learning Objectives
By completing this project, you will:
- Read CPU, memory, disk, and network stats directly from
/procand/sys. - Compute rates (CPU%, bytes/sec) using time-delta sampling.
- Render a flicker-free TUI dashboard with ANSI cursor control.
- Implement interactive controls (kill, sort, refresh rate) safely.
- Build an alerting layer with thresholds and cooldowns.
2. Theoretical Foundation
2.1 Core Concepts
- /proc filesystem: How Linux exposes kernel state as pseudo-files.
- Sampling and deltas: Why CPU%, bandwidth, and I/O rates require two samples.
- Terminal control: ANSI escape sequences, cursor movement, and full-screen redraws.
- Signals and cleanup: Using
trapto restore terminal state and exit cleanly. - Process accounting: Parsing
/proc/[pid]/*and handling permissions safely.
2.2 Why This Matters
Monitoring is the nervous system of operations. If you can build a reliable monitor from scratch, you understand how every metric is derived and can trust or challenge any third-party tool. This skill transfers directly to diagnosing production issues.
2.3 Historical Context / Background
Tools like top and htop are thin veneers over /proc. Their core value is sampling and presentation. Rebuilding a subset demystifies these tools and teaches you how the kernel exposes system health.
2.4 Common Misconceptions
- “CPU usage is a snapshot.” It is a delta of cumulative counters.
- “/proc is consistent across all systems.” Layout varies by kernel and distro.
- “ANSI TUI is just printing.” Without cursor control, you get flicker and scroll.
3. Project Specification
3.1 What You Will Build
A CLI tool called sysmon that renders a full-screen terminal dashboard showing CPU, memory, disk, and network metrics, plus a top-process table. It supports alerts, sorting, and interactive hotkeys.
3.2 Functional Requirements
- CPU panel: Show total CPU %, and per-state breakdown (user/system/idle).
- Memory panel: Display used/available, cache/buffers, and swap usage.
- Disk panel: Show usage per mount, percent used, and warnings for thresholds.
- Network panel: Show RX/TX rates per interface (bytes/sec).
- Process table: Show top N processes by CPU or memory with PID, user, cmd.
- Alerts: Allow thresholds like
cpu > 90ordisk / > 95with cooldowns. - Controls: Keys for quit, refresh rate, sort order, and kill.
3.3 Non-Functional Requirements
- Performance: Avoid heavy external commands in the refresh loop.
- Reliability: Continue if a metric file is missing or unreadable.
- Usability: Clear labels, consistent units, and aligned columns.
- Portability: Linux-first, but degrade gracefully on macOS.
3.4 Example Usage / Output
$ sysmon --refresh 1 --sort cpu --alert "cpu > 90" --alert "disk / > 95"
[sysmon] Alerts enabled (2 rules)
3.5 Real World Outcome
You run sysmon during high load and immediately see CPU saturation, which processes are responsible, and whether disk or network are bottlenecks. Alerts trigger only after thresholds persist for a configured time window.
$ sysmon

+---------------------------------------------------------------------+
|                    SYSTEM MONITOR v1.0                               |
| Host: devbox | Uptime: 5 days, 3:24:15 | Refresh: 1s                 |
|---------------------------------------------------------------------|
| CPU ###############........... 47%  user:34 sys:10 idle:53            |
| MEM #################........ 72%  8.2 / 16.0 GB (swap 0.2/2.0 GB)    |
|---------------------------------------------------------------------|
| DISK                                                                  |
| /        ###############..... 62%  124G/200G                          |
| /home    ###########......... 38%   76G/200G                          |
|---------------------------------------------------------------------|
| NET                         | PROCESSES                              |
| eth0: v12.5MB/s ^2.3MB/s    | Total: 312  Running: 4  Zombie: 0       |
|---------------------------------------------------------------------|
| TOP BY CPU                                                       ^   |
| PID   USER     CPU%  MEM%   TIME      COMMAND                         |
| 1234  douglas  45.2  3.4    02:34:56  node server.js                   |
| 5678  douglas  12.1  8.2    00:45:12  chrome                           |
+---------------------------------------------------------------------+
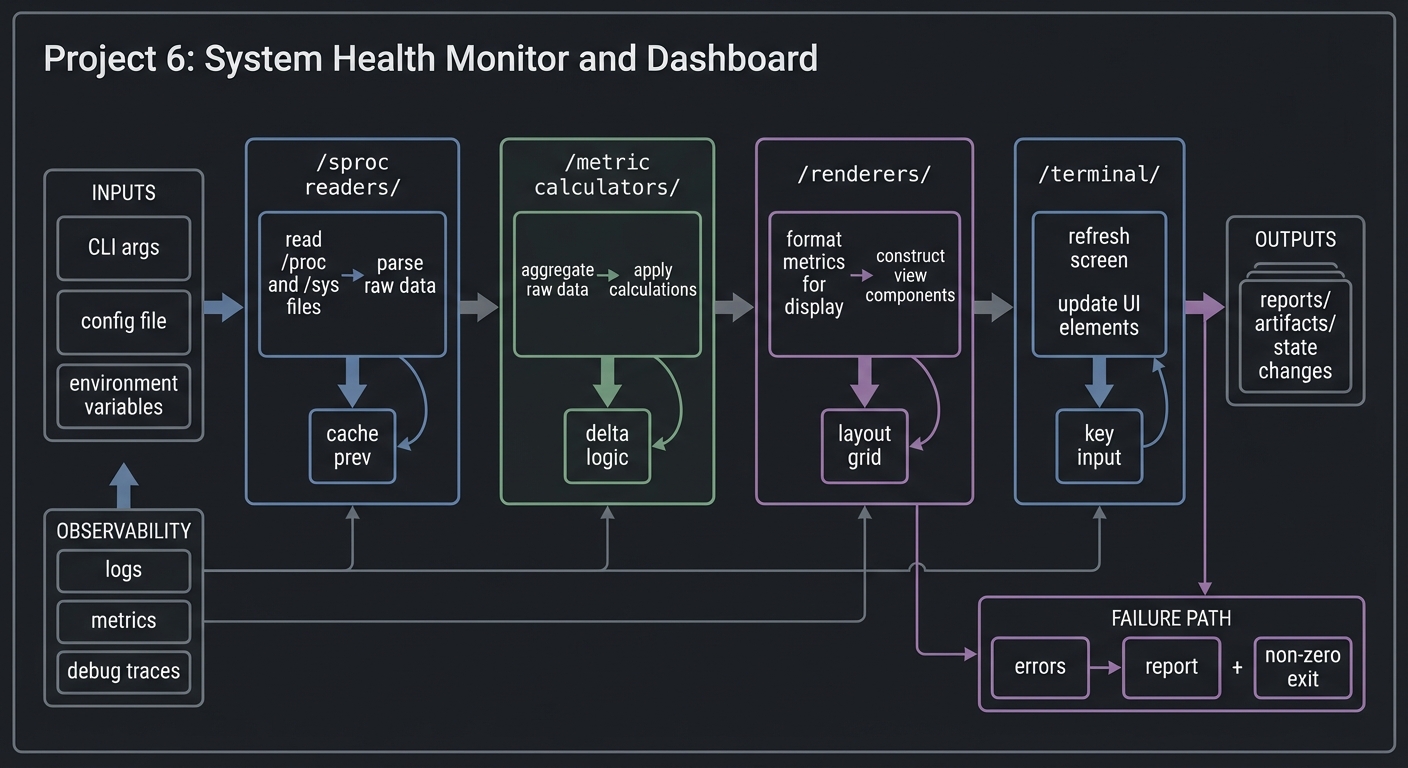
4. Solution Architecture
4.1 High-Level Design
/sproc readers/ -> /metric calculators/ -> /renderers/ -> /terminal/
        |                 |                    |          |
        |                 |                    |          +--> key input
        +--> cache prev   +--> delta logic      +--> layout grid
4.2 Key Components
| Component | Responsibility | Key Decisions |
|---|---|---|
| Metrics reader | Parse /proc and /sys files |
Use builtin parsing vs awk |
| Sampler | Store previous values and compute deltas | In-memory state map |
| Renderer | Build screen frames and emit ANSI | Full redraw vs partial redraw |
| Input handler | Read keys without blocking | stty raw mode vs read -rsn1 |
| Alert engine | Evaluate thresholds, debounce, notify | Rule DSL + cooldowns |
4.3 Data Structures
Use associative arrays for metric snapshots:
# Example (bash associative arrays)
declare -A cpu_prev cpu_now net_prev net_now
cpu_prev=( [user]=4000 [system]=1000 [idle]=50000 )
4.4 Algorithm Overview
Key Algorithm: CPU Usage Calculation
- Read
/proc/stattotal counters at time T1. - Sleep for refresh interval.
- Read counters at T2.
- Compute delta total and delta idle.
- CPU% = 100 * (delta_total - delta_idle) / delta_total.
Complexity Analysis:
- Time: O(n) per refresh (n = number of processes + disks + interfaces)
- Space: O(n) for cached metrics
5. Implementation Guide
5.1 Development Environment Setup
brew install bash coreutils # macOS
sudo apt-get install bash procps # Linux
5.2 Project Structure
project-root/
|-- sysmon
|-- lib/
|   |-- metrics.sh
|   |-- render.sh
|   |-- input.sh
|   `-- alerts.sh
|-- data/
|   `-- rules.conf
`-- README.md

5.3 The Core Question You Are Answering
“How can I transform raw kernel counters into real-time, human-friendly system insight?”
5.4 Concepts You Must Understand First
- /proc counters are cumulative: You need deltas to compute rates.
- Terminal raw mode: Reading keys without blocking the render loop.
- Signal cleanup: Always restore terminal state on exit.
5.5 Questions to Guide Your Design
- How will you avoid flicker while refreshing every second?
- Which metrics are expensive to compute, and how will you cache them?
- What should happen when a process disappears between reads?
5.6 Thinking Exercise
Sketch a single refresh cycle on paper: read metrics -> compute deltas -> render frame -> handle input. Identify where each function should store state.
5.7 The Interview Questions They Will Ask
- How do you compute CPU usage from
/proc/stat? - How do you make a TUI responsive without threads?
- How do you handle permissions when reading
/proc/[pid]/stat?
5.8 Hints in Layers
Hint 1: Start by printing just CPU and memory once. No TUI yet.
Hint 2: Build a render_frame() that returns a string and print it once.
Hint 3: Add printf '\e[H\e[2J' to clear the screen and reprint.
Hint 4: Use trap 'cleanup' EXIT to restore terminal state.
5.9 Books That Will Help
| Topic | Book | Chapter |
|---|---|---|
| /proc internals | “The Linux Programming Interface” | Ch. 12 |
| Terminal control | “The Linux Command Line” | Ch. 32 |
| Signals | “Advanced Programming in the UNIX Environment” | Ch. 10 |
5.10 Implementation Phases
Phase 1: Foundation (3-4 days)
Goals:
- Read CPU/memory stats from
/proc. - Render a static dashboard.
Tasks:
- Implement CPU and memory parsers.
- Print a single snapshot layout.
Checkpoint: Dashboard renders correct values vs top.
Phase 2: Core Functionality (5-7 days)
Goals:
- Add refresh loop with deltas.
- Implement process listing and sorting.
Tasks:
- Cache previous stats for delta calculation.
- Add process table with top N.
Checkpoint: CPU% and network throughput match top/iftop.
Phase 3: Alerts and Polish (3-4 days)
Goals:
- Alert rules, cooldowns, and hotkeys.
- Handle resize and clean exit.
Tasks:
- Implement rule parser.
- Add key bindings and resize handling.
Checkpoint: Alerts trigger once per cooldown and exit restores terminal.
5.11 Key Implementation Decisions
| Decision | Options | Recommendation | Rationale |
|---|---|---|---|
| Refresh loop | sleep in loop vs tput refresh |
Simple sleep | Predictable timing |
| Process listing | parse /proc vs ps |
/proc for full control |
Avoids parsing differences |
| Rendering | full redraw vs partial | full redraw | Simpler, acceptable at 1s |
6. Testing Strategy
6.1 Test Categories
| Category | Purpose | Examples |
|---|---|---|
| Unit | Parsing correctness | /proc sample fixtures |
| Integration | End-to-end refresh | Run with captured fixtures |
| Edge Cases | Missing files, permissions | Simulate restricted /proc |
6.2 Critical Test Cases
/proc/statparsing with multi-core lines.- Network throughput calculation with counter rollover.
- Process list handles disappearing PIDs.
6.3 Test Data
fixtures/proc_stat_t1
fixtures/proc_stat_t2
fixtures/proc_meminfo
7. Common Pitfalls and Debugging
7.1 Frequent Mistakes
| Pitfall | Symptom | Solution |
|---|---|---|
| Using single snapshot for CPU% | CPU stuck at 0 or 100 | Use deltas |
| Not restoring terminal | Shell looks broken after exit | trap cleanup |
Parsing with cut in loop |
Slow refresh | Use built-in parsing |
7.2 Debugging Strategies
- Print raw counters alongside computed values for comparison.
- Compare against
topin another terminal.
7.3 Performance Traps
Running external commands inside the refresh loop (ps, df) every second can be expensive. Cache results or reduce frequency.
8. Extensions and Challenges
8.1 Beginner Extensions
- Add a battery panel (for laptops).
- Add a color theme switch.
8.2 Intermediate Extensions
- Support per-core CPU graphs.
- Add historical sparkline graphs.
8.3 Advanced Extensions
- Remote monitoring via SSH.
- Export metrics to Prometheus text format.
9. Real-World Connections
9.1 Industry Applications
- On-call dashboards for production systems.
- Lightweight monitoring on embedded servers.
9.2 Related Open Source Projects
- htop: canonical TUI monitor implementation.
- glances: Python-based monitoring suite.
9.3 Interview Relevance
- Demonstrates knowledge of
/proc, signals, and performance. - Shows ability to build responsive terminal UIs.
10. Resources
10.1 Essential Reading
- “The Linux Programming Interface” – /proc and process metrics.
- “The Linux Command Line” – terminal control.
10.2 Video Resources
- “Linux /proc Explained” (YouTube)
- “ANSI Escape Codes” (YouTube)
10.3 Tools and Documentation
man proc,man terminfo,man sttyshellcheckfor script linting
10.4 Related Projects in This Series
- Project 3: Log Parser & Alert System
- Project 8: Process Supervisor & Job Scheduler
11. Self-Assessment Checklist
11.1 Understanding
- I can explain why CPU% requires two samples.
- I can describe how
/procexposes process state.
11.2 Implementation
- Dashboard updates without flicker.
- Alerts trigger correctly with cooldowns.
11.3 Growth
- I can explain this project in a job interview.
- I know one improvement I would make.
12. Submission / Completion Criteria
Minimum Viable Completion:
- Working dashboard with CPU, memory, disk, network panels
- Basic process table
- Clean exit with terminal restore
Full Completion:
- Alerts with cooldown
- Interactive controls (sort, refresh, kill)
Excellence (Going Above & Beyond):
- Historical graphs or remote monitoring export
- Theme support and resize handling