Project 3: Log Parser and Alert System
Build a log analysis tool that summarizes, monitors, and alerts on error patterns.
Quick Reference
| Attribute | Value |
|---|---|
| Difficulty | Level 2: Intermediate |
| Time Estimate | 1-2 weeks |
| Language | Bash (Alternatives: AWK, Perl, Python) |
| Prerequisites | Project 2, basic regex knowledge, familiarity with log files |
| Key Topics | regex, pipes, streaming, aggregation, alerting |
1. Learning Objectives
By completing this project, you will:
- Parse and normalize multiple log formats.
- Aggregate metrics using awk and pipelines.
- Implement real-time monitoring with tail and filters.
- Trigger alerts based on rate thresholds.
2. Theoretical Foundation
2.1 Core Concepts
- Stream processing: Why pipes allow scalable log analysis without loading files into memory.
- Regex extraction: Pulling structured data from unstructured lines.
- Aggregation: Counting events and computing distributions.
- Alerting thresholds: Defining meaningful triggers that avoid noise.
2.2 Why This Matters
Log analysis is the most common production debugging workflow. If you can parse logs, you can diagnose systems without GUI tools.
2.3 Historical Context / Background
Classic tools like logwatch and logrotate rely on shell pipelines. The shell remains a first-class log analysis tool even in modern systems.
2.4 Common Misconceptions
- Grep alone is enough. It is not; aggregation and context matter.
- Real-time monitoring means
tail -fonly. It needs filtering and rate control.
3. Project Specification
3.1 What You Will Build
A log parser that can summarize a file, filter by time window, and run a live watch mode that alerts when error patterns exceed a threshold.
3.2 Functional Requirements
- Summary mode: Count status codes, top paths, top IPs.
- Filter mode: Show errors in the last N minutes.
- Watch mode: Tail logs and alert on patterns.
- Format support: Accept at least two formats (nginx + syslog).
- Output modes: Human-readable and CSV summary.
3.3 Non-Functional Requirements
- Efficiency: Handle large logs in streaming mode.
- Clarity: Clean, aligned summary output.
- Safety: Do not alter log files.
3.4 Example Usage / Output
$ logparse /var/log/nginx/access.log --summary
Total requests: 145832
Top status: 200 (89.2%)
Top path: /api/users (28432)
3.5 Real World Outcome
You can point the tool at system logs and immediately understand traffic patterns, error bursts, and top offenders. In watch mode, you see alerts within seconds of spikes.
$ logparse /var/log/syslog --watch --alert-on "ERROR|CRITICAL"
[logparse] Alert threshold: 10 per minute
[ALERT] 14:32:10 - 12 errors in the last minute
4. Solution Architecture
4.1 High-Level Design
[file reader] -> [parser] -> [aggregator] -> [reporter]
                     |
                     -> [watch mode] -> [alerting]
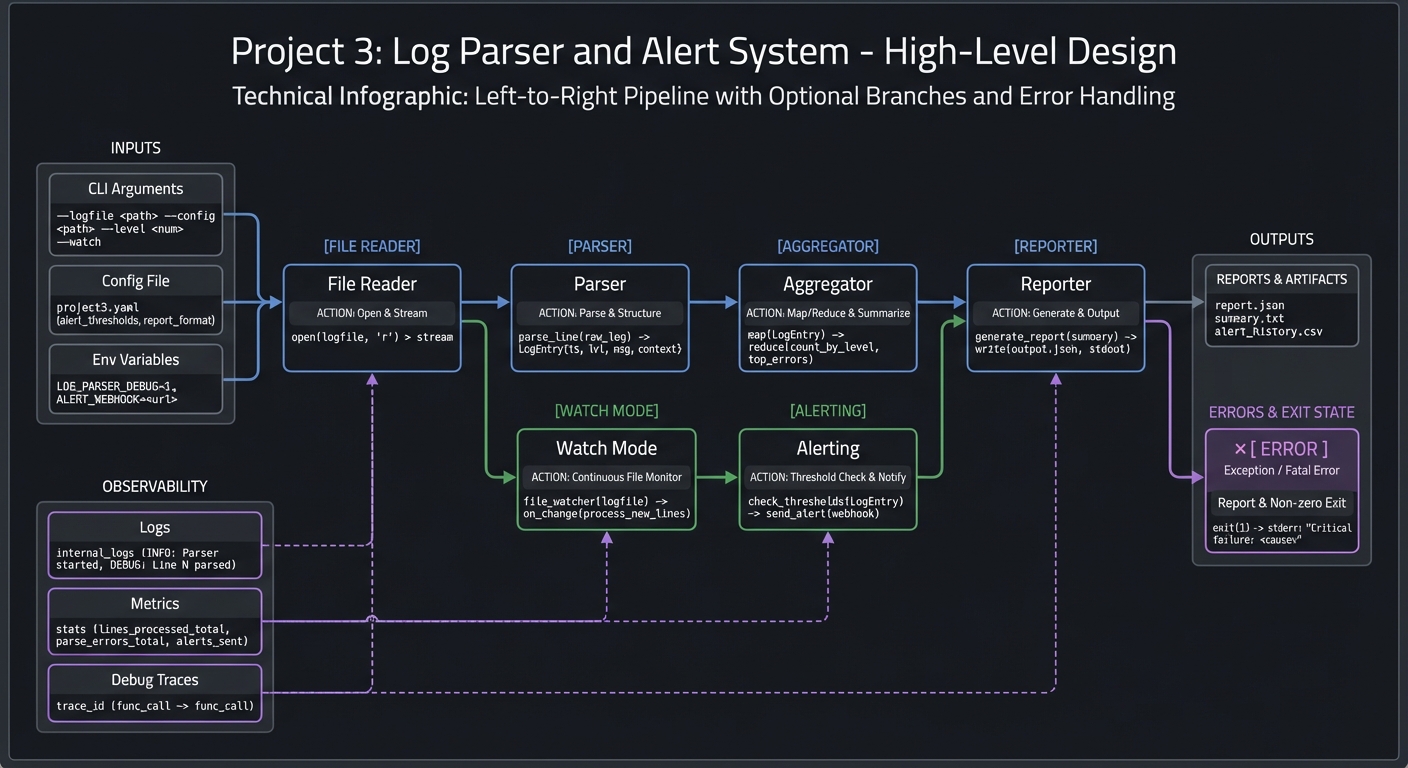
4.2 Key Components
| Component | Responsibility | Key Decisions |
|---|---|---|
| Parser | Extract fields | Regex per format |
| Aggregator | Count metrics | awk arrays |
| Reporter | Render output | Table vs CSV |
| Watcher | Tail and filter | Line-buffered pipes |
| Alerting | Threshold logic | Rate window size |
4.3 Data Structures
Represent aggregates as simple key-value maps in awk:
status[code]++
path[path]++
ip[ip]++
4.4 Algorithm Overview
- Detect log format or accept format flag.
- Parse each line into fields.
- Update counters and summaries.
- Render summary table and optional CSV.
- For watch mode, process streaming input and compute rate per window.
Complexity Analysis:
- Time: O(n) for n lines
- Space: O(k) for unique keys
5. Implementation Guide
5.1 Development Environment Setup
# Ensure awk, sed, grep are available
awk --version
sed --version
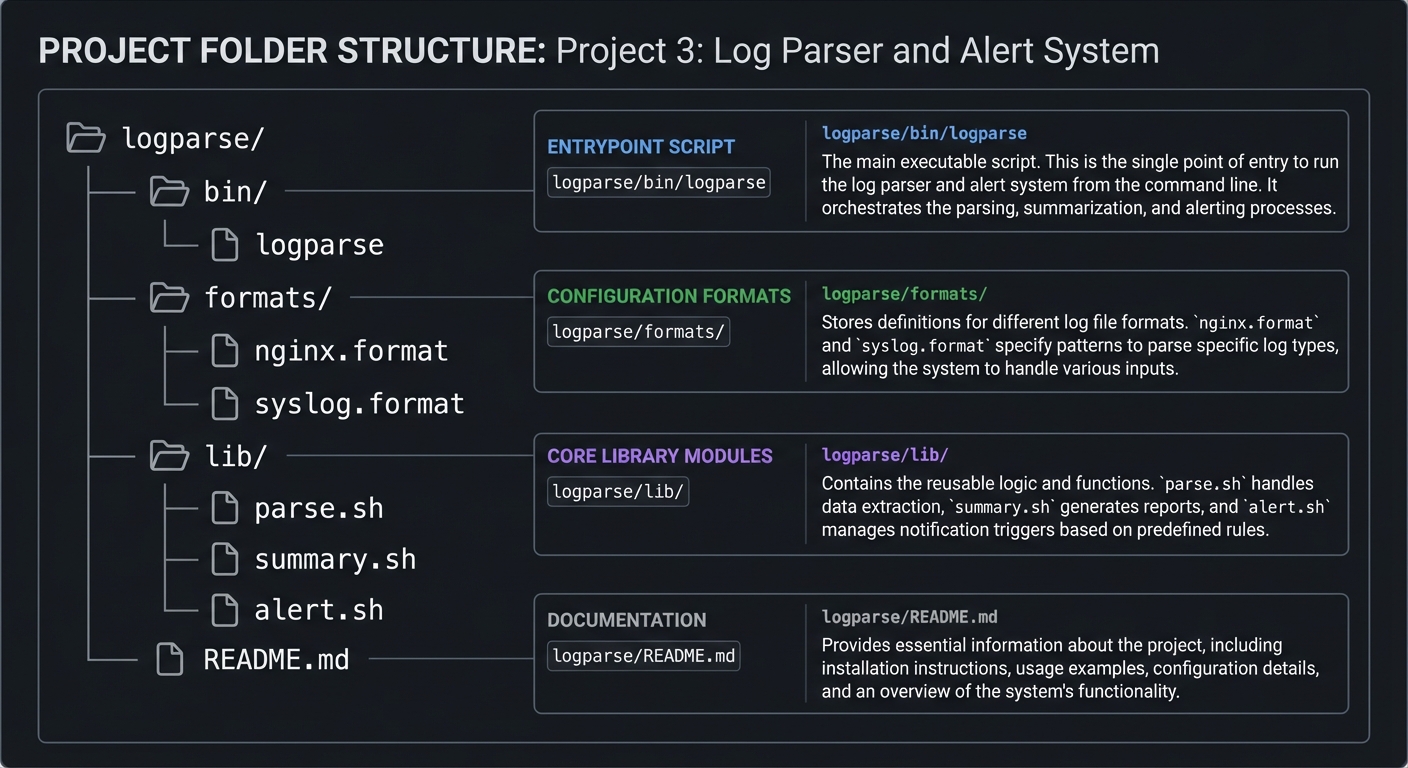
5.2 Project Structure
logparse/
|-- bin/
|   `-- logparse
|-- formats/
|   |-- nginx.format
|   `-- syslog.format
|-- lib/
|   |-- parse.sh
|   |-- summary.sh
|   `-- alert.sh
`-- README.md
5.3 The Core Question You Are Answering
“How do I turn raw, messy logs into structured insight without writing a full application?”
5.4 Concepts You Must Understand First
- Regex basics and capture groups.
- Streaming with pipes and line buffering.
- Counting and grouping using awk.
5.5 Questions to Guide Your Design
- What fields matter most for summary?
- How will you detect format differences?
- How will you avoid alert storms?
5.6 Thinking Exercise
Write a regex that extracts status codes and paths from an nginx log line.
5.7 The Interview Questions They Will Ask
- Why is streaming better than loading logs into memory?
- How do you avoid false positives in alerts?
- What is the difference between
grepandawkin this context?
5.8 Hints in Layers
Hint 1: Start with a summary for one log format.
Hint 2: Add CSV output to validate parsing.
Hint 3: Implement watch mode with line buffering.
Hint 4: Treat alerting as a separate component.
5.9 Books That Will Help
| Topic | Book | Chapter |
|---|---|---|
| Regex and pipes | “Effective Shell” | Ch. 10-15 |
| Stream processing | “The Linux Command Line” | Ch. 20 |
| AWK usage | “The AWK Programming Language” | Early chapters |
5.10 Implementation Phases
Phase 1: Foundation (2-3 days)
Goals:
- Parse one log format and show summary
Tasks:
- Write parser for nginx or syslog
- Add counters and summary output
Checkpoint: Summary matches manual counts.
Phase 2: Core Functionality (3-4 days)
Goals:
- Add multiple formats and filters
Tasks:
- Add format selection
- Add time-window filtering
Checkpoint: Filtered output is accurate.
Phase 3: Watch and Alerts (3-4 days)
Goals:
- Implement watch mode and alert thresholds
Tasks:
- Add tail-based streaming
- Add alert counters and rate limits
Checkpoint: Alerts fire only when thresholds are met.
5.11 Key Implementation Decisions
| Decision | Options | Recommendation | Rationale |
|---|---|---|---|
| Format selection | auto, flag | flag | Safer and explicit |
| Alerts | email, stdout | stdout first | Easier to validate |
| Aggregation | awk, python | awk | Native and fast |
6. Testing Strategy
6.1 Test Categories
| Category | Purpose | Examples |
|---|---|---|
| Unit Tests | Parser correctness | One log line -> fields |
| Integration Tests | Full summaries | Known log file sample |
| Edge Case Tests | Weird lines | Malformed entries |
6.2 Critical Test Cases
- Parser handles missing fields gracefully.
- Summary counts match manual counts.
- Watch mode does not flood alerts.
6.3 Test Data
small nginx log sample
small syslog sample
7. Common Pitfalls and Debugging
7.1 Frequent Mistakes
| Pitfall | Symptom | Solution |
|---|---|---|
| Greedy regex | Wrong fields extracted | Use explicit patterns |
| Mixed formats | Summary nonsense | Require format flag |
| Buffering delays | Alerts late | Use line buffering |
7.2 Debugging Strategies
- Print parsed fields for a sample line.
- Compare counts against
grep -c.
7.3 Performance Traps
Avoid piping to multiple processes per line. Keep it in one pipeline when possible.
8. Extensions and Challenges
8.1 Beginner Extensions
- Add CSV export for summary
- Add top-user agent reporting
8.2 Intermediate Extensions
- Add JSON output
- Add log rotation awareness
8.3 Advanced Extensions
- Add alert routing (email, webhook)
- Add anomaly detection rules
9. Real-World Connections
9.1 Industry Applications
- Web server monitoring and incident response.
9.2 Related Open Source Projects
- GoAccess: Interactive web log analyzer
- Logwatch: Summary reports for syslogs
9.3 Interview Relevance
- Log parsing and debugging pipelines are common shell interview topics.
10. Resources
10.1 Essential Reading
- “Effective Shell” by Dave Kerr - regex and pipelines
- “The Linux Command Line” by William Shotts - text processing
10.2 Video Resources
- Short AWK and grep tutorials
10.3 Tools and Documentation
man awk,man grep,man tail
10.4 Related Projects in This Series
- Previous: Project 2 (Smart File Organizer)
- Next: Project 4 (Git Hooks Framework)
11. Self-Assessment Checklist
11.1 Understanding
- I can explain stream processing and why it is efficient.
- I can write regex for log fields.
11.2 Implementation
- Summary output is accurate.
- Watch mode alerts correctly.
11.3 Growth
- I can extend the parser for another log format.
12. Submission / Completion Criteria
Minimum Viable Completion:
- Summarize a log file correctly.
- Watch mode detects error patterns.
Full Completion:
- Supports multiple formats and CSV output.
Excellence (Going Above and Beyond):
- Alert routing and anomaly detection.
This guide was generated from CLI_TOOLS/LEARN_SHELL_SCRIPTING_MASTERY.md. For the complete learning path, see the parent directory README.