Learn Threat Detection & Logging: From Zero to Detection Engineering Master
Goal: Deeply understand threat detection and logging—from why audit trails exist and how they’re structured, to how anomaly detection works, to how high-value events are defined and tuned, to how alerts are validated and improved. You will learn how event data flows from systems into analysis pipelines, how detection logic is built and tested, how false positives are reduced, and how investigators use logs to reconstruct incidents. You will also understand the tradeoffs behind the scenes: storage cost vs fidelity, signal vs noise, real-time vs batch, and human-in-the-loop vs automation.
Why Threat Detection & Logging Matters
Security failures rarely happen in one loud moment. They unfold as a chain of small, often ambiguous events. Logging is the memory of systems, and detection is the method that turns raw memory into actionable signals.
Historical Context
The Evolution of Security Logging:
- 1970s-1980s: Early systems logged for debugging and operations only
- 1990s: Compliance requirements (SOX, HIPAA) drove security logging adoption
- 2000s: Network growth made manual review impossible, birthing SIEM platforms
- 2010s: Advanced persistent threats forced behavioral detection and anomaly analysis
- 2020s-Present: AI/ML integration and cloud-native logging reshape the landscape
The SIEM market generated USD 10.78 billion in revenue in 2025 and is forecast to reach USD 19.13 billion by 2030, growing at 10-16% CAGR. Threat Detection retained 32.7% of 2024 revenue, demonstrating it remains the dominant application (Mordor Intelligence, 2025).
Real-World Impact Statistics
Detection Effectiveness:
- 67% of organizations rely on log analysis as their primary breach detection method
- Incident response requires audit trails to reconstruct timelines—without logs, attribution fails
- Organizations receive 500,000+ alerts daily, with 95-98% being false positives (OX Security, 2025)
Alert Fatigue Crisis:
- 90% of SOCs are overwhelmed by backlogs and false positives (Osterman Research)
- Alert fatigue causes SOCs to miss up to 30% of security alerts that go uninvestigated
- 84% of security professionals report feeling burned out from alert volume (1Password Study)
- 16% of SOC professionals manage only half of their alert workload weekly (Cybereason Research)
Compliance Requirements:
- Regulations (SOX, HIPAA, PCI DSS, GDPR, NIS2) mandate traceable, immutable logs
- Most standards require 3-18 month retention periods (AuditBoard, 2025)
- Banking/Financial Services (BFSI) sector holds the largest SIEM market share at 27% (Market Analysis, 2025)
What Understanding This Unlocks
After mastering threat detection and logging, you will be able to:
- Design logging strategies based on detection requirements, not just vendor defaults
- Build detection rules that are resilient, explainable, and tunable
- Reduce alert fatigue by balancing precision, recall, and analyst workload
- Reconstruct incidents from distributed logs with forensic-grade confidence
- Defend log integrity using cryptographic chains and immutable storage
- Map detection coverage to attack techniques (MITRE ATT&CK)
- Validate alerts with structured playbooks that reduce triage time
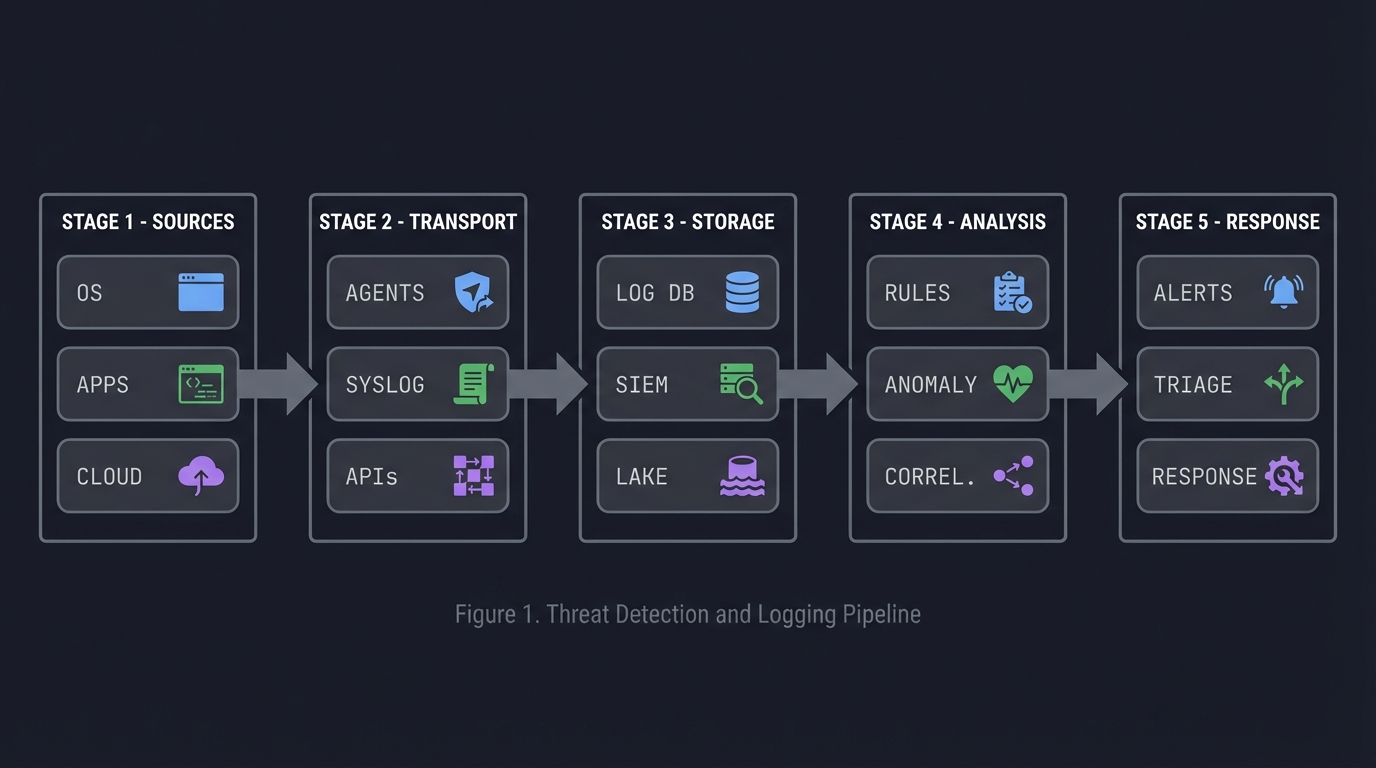
ASCII view of the detection pipeline:
Sources         Transport          Storage          Analysis            Response
┌────────┐     ┌────────┐        ┌────────┐       ┌──────────┐        ┌──────────┐
│ OS     │ --> │ Agents │ -----> │ Log DB │ ----> │ Rules    │ -----> │ Alerts   │
│ Apps   │     │ Syslog │        │ SIEM   │       │ Anomaly  │        │ Triage   │
│ Cloud  │     │ APIs   │        │ Lake   │       │ Correl.  │        │ Response │
└────────┘     └────────┘        └────────┘       └──────────┘        └──────────┘
2025 Trends Shaping Threat Detection
AI-Driven Detection is Accelerating:
- AI-driven SIEM solutions are growing at 20% CAGR through 2030 (IDC, 2025)
- AI techniques reduce investigation time by up to 60% and cut false positives significantly
- Large Language Models (LLMs) for anomaly detection: The “TAD-GP” framework achieves 79-97% F1 score improvements on benchmark datasets (Nature Scientific Reports, 2025)
- Graph Neural Networks (GNN) model network traffic as graphs, detecting complex attack patterns like botnets by analyzing relational dependencies (ScienceDirect, 2025)
Cloud-Native Logging:
- Cloud-based SIEM expanding at 13.4% CAGR as enterprises migrate workloads (Market Research, 2025)
- API security monitoring becomes non-negotiable with forgotten endpoints and zero visibility into east-west API traffic creating under-monitored attack surfaces (Graylog, 2025)
- Data strategy becomes selective and purpose-built: teams focus on logs supporting investigation flow and cost-predictable retention (Graylog, 2025)
Shift from Volume to Precision:
- Teams are not struggling with visibility—they’re struggling with interpretation, prioritization, and sustainable process (Graylog, 2025)
- Dashboards evolve to be outcome-oriented: supporting triage and pivot into investigation through entity-centric insights
- The goal is faster confidence, not more information
Major Market Consolidation:
- Cisco acquired Splunk for USD 28 billion, combining network telemetry with observability data
- Palo Alto Networks folded IBM QRadar SaaS into Cortex for USD 500 million, aligning SOC, XDR, and automation
- Exabeam merged with LogRhythm in USD 3.5 billion private-equity deal, pooling UEBA and log-ingestion expertise (Market Analysis, 2025)
Regulatory & Compliance Drivers:
- Immutable storage becomes best practice: data cannot be modified or deleted once written, ensuring integrity and compliance (TechTarget, 2025)
- Log retention periods of 3-18 months required for GDPR, HIPAA, NIS2, ISO27001, SOC2 compliance (AuditBoard, 2025)
- RBAC (Role-Based Access Control) restricts log access to authorized personnel only
Prerequisites & Background Knowledge
Before diving into threat detection and logging projects, assess your readiness and prepare your environment.
Essential Prerequisites (Must Have)
1. Basic Security Concepts
- Understanding of the CIA triad (Confidentiality, Integrity, Availability)
- Familiarity with common attack vectors (phishing, malware, credential theft)
- Knowledge of authentication vs authorization
2. System Administration Fundamentals
- Comfortable reading system logs (syslog, Windows Event Logs, application logs)
- Basic command-line proficiency (Linux/Windows)
- Understanding of user accounts, permissions, and access control
3. Programming/Scripting
- Python basics (data structures, file I/O, loops, conditionals)
- Familiarity with JSON, CSV data formats
- Ability to write simple scripts for automation
4. Networking Basics
- TCP/IP fundamentals
- Understanding of IP addresses, ports, protocols
- Basic network troubleshooting
Helpful But Not Required (You’ll Learn These)
Advanced Topics Covered in Projects:
- Statistical analysis and anomaly detection algorithms
- Cryptographic hash functions and integrity chains
- SIEM architecture and correlation engines
- MITRE ATT&CK framework mapping
- Incident response procedures
- Machine learning for threat detection
Self-Assessment Questions
Answer “Yes” to at least 7 of these before starting:
- Can you explain what a log file contains and why it exists?
- Can you read and interpret timestamps in different formats?
- Can you write a Python script to parse a CSV file?
- Do you understand what an IP address represents?
- Can you explain the difference between authentication and authorization?
- Have you used grep, awk, or similar tools to search text?
- Do you know what a hash function is and why it’s one-way?
- Can you explain what “correlation” means in the context of events?
- Have you heard of SIEM tools (Splunk, Elastic, QRadar)?
- Do you understand what a false positive is?
If you answered “No” to more than 3: Spend 1-2 weeks reviewing security fundamentals and basic scripting before starting Project 1.
Development Environment Setup
Required Tools:
- Operating System:
- Linux (Ubuntu 22.04+ recommended) or macOS
- Windows with WSL2 if on Windows
- Programming Environment:
- Python 3.9+ with pip
- Virtual environment tool (venv or conda)
- Code editor (VS Code, PyCharm, or similar)
- Log Generation:
- Access to system logs (/var/log on Linux, Event Viewer on Windows)
- Optional: Docker for running test services that generate logs
- Optional: VirtualBox or VMware for isolated test environments
- Data Analysis Libraries (Python):
pip install pandas numpy matplotlib scikit-learn - Optional but Recommended:
- Git for version control
- Jupyter Notebook for exploratory analysis
- jq for JSON manipulation
- Elastic Stack (ELK) or Splunk Free (for SIEM projects)
Recommended Cloud Resources:
- AWS Free Tier or Azure Free Account for CloudTrail/Azure Monitor logs
- DigitalOcean or Linode for disposable VMs (optional, ~$5-10/month)
Time Investment Expectations
Per Project Breakdown:
| Project | Expected Time | Daily Commitment |
|---|---|---|
| Projects 1-3 | 1-2 weeks | 1-2 hours/day |
| Projects 4-7 | 2-4 weeks | 2-3 hours/day |
| Projects 8-10 | 1-3 weeks | 1-2 hours/day |
| Final Project | 4-6 weeks | 3-4 hours/day |
Total Time: 4-6 months to complete all projects thoroughly (including reading and research).
Accelerated Path: 2-3 months if you have prior SOC/SIEM experience and can dedicate 4+ hours daily.
Important Reality Check
This learning path is NOT:
- A quick certification prep guide
- A “learn SIEM in 30 days” course
- Focused on specific vendor tools (Splunk, QRadar, Sentinel)
- A replacement for hands-on SOC experience
This learning path IS:
- Conceptual and foundational - You’ll build your own mini-SIEM components
- Tool-agnostic - Concepts apply to any SIEM platform
- Challenging - You’ll get stuck, and that’s where learning happens
- Practical - Every project produces working code you can demonstrate
Expected Struggle Points:
- Project 4 (Anomaly Detection): Statistical concepts can be unintuitive
- Project 5 (Correlation): Event sequencing logic gets complex quickly
- Project 7 (Integrity Chain): Cryptographic concepts require careful implementation
- Project 10 (Timeline Reconstruction): Merging multi-source logs is messier than expected
When You’ll Feel Confident:
- After Project 3, you’ll understand log normalization deeply
- After Project 6, you’ll grasp alert tuning tradeoffs
- After Project 10, you’ll be able to reconstruct any incident from logs
Foundational Concepts: The Six Pillars
1. Audit Trails — The Immutable Story
An audit trail answers: who did what, when, where, and with what outcome.
Audit Trail Invariant:
┌──────────────────────────────────────────────┐
│ Every security-relevant action is traceable │
│ to an identity, time, and context.           │
└──────────────────────────────────────────────┘
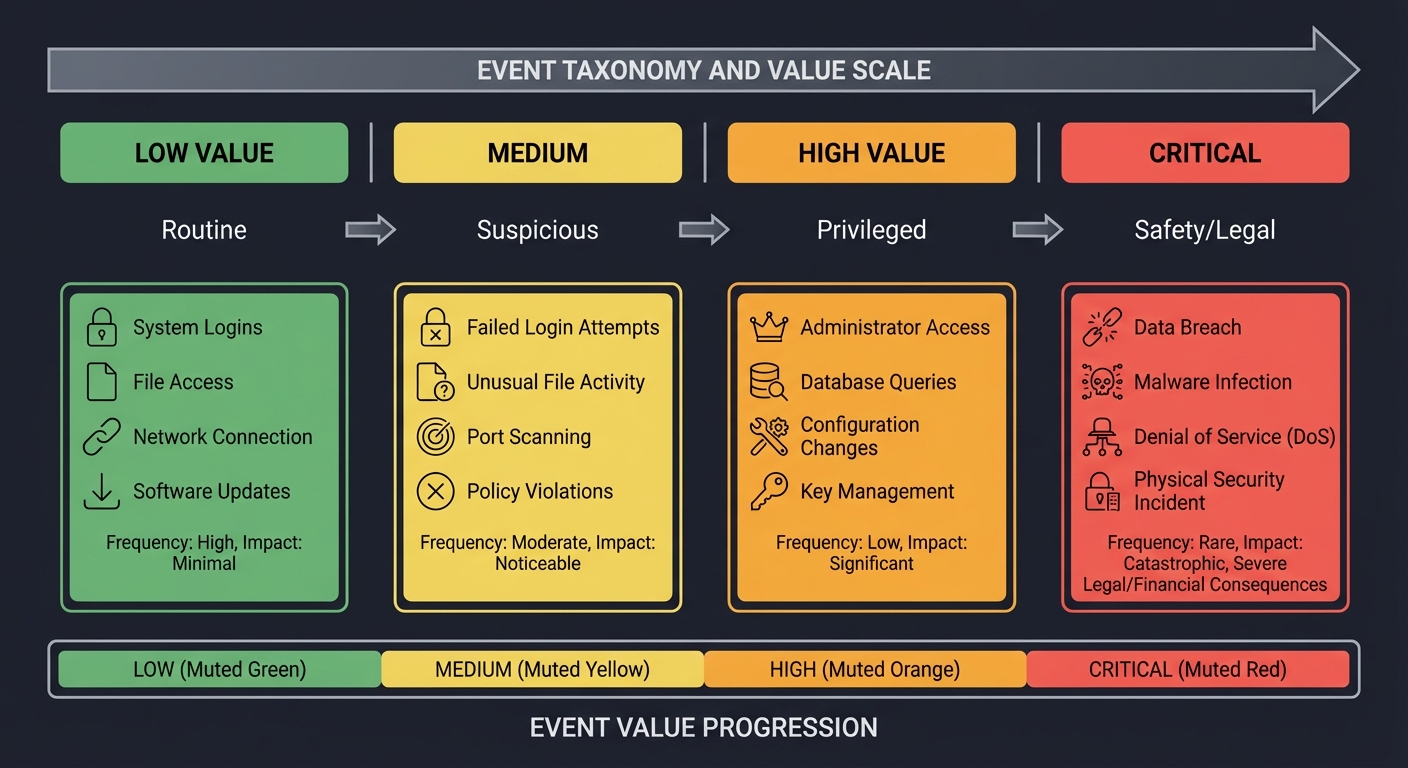
2. Event Taxonomy — Separating Signal from Noise
Not all events are equal. You must categorize:
LOW VALUE  ->  MEDIUM  ->  HIGH VALUE  ->  CRITICAL
Routine        Suspicious  Privileged     Safety/Legal
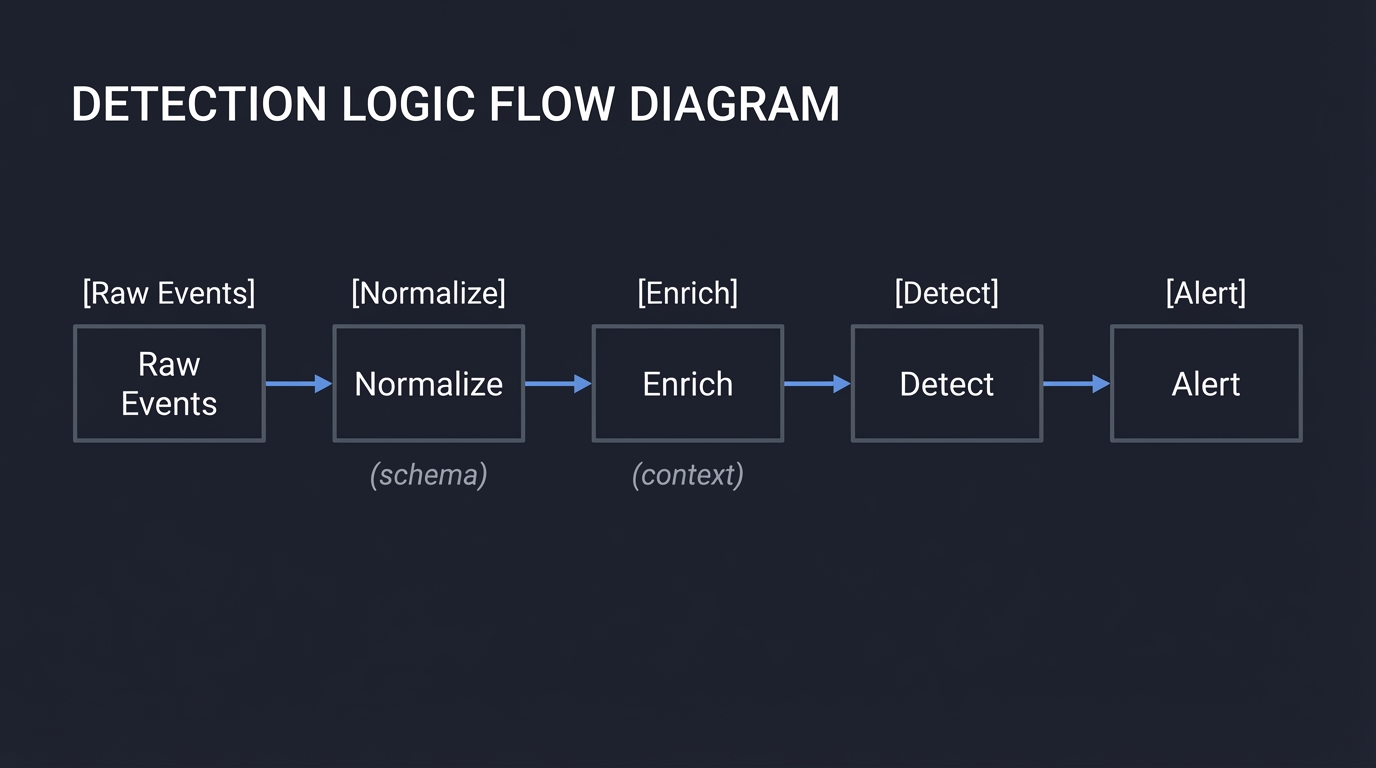
3. Detection Logic — Rules, Correlations, Anomalies
Detection is a decision system layered on top of logs:
Raw Events -> Normalize -> Enrich -> Detect -> Alert
             (schema)      (context)
4. Alert Tuning — The Art of Precision
An alert is only useful if it is trusted.
Precision = True Alerts / Total Alerts
Recall    = True Alerts / Total Malicious Events
5. Attribution & Context — Making Events Meaningful
Events without context are noise. Add:
- Asset value
- User role
- Geo-location
- Known maintenance windows
6. Integrity & Retention — Trusting the Record
If logs are tampered with, detection collapses. This requires:
- Hash chains
- WORM storage
- Clear retention policies
Core Concept Analysis
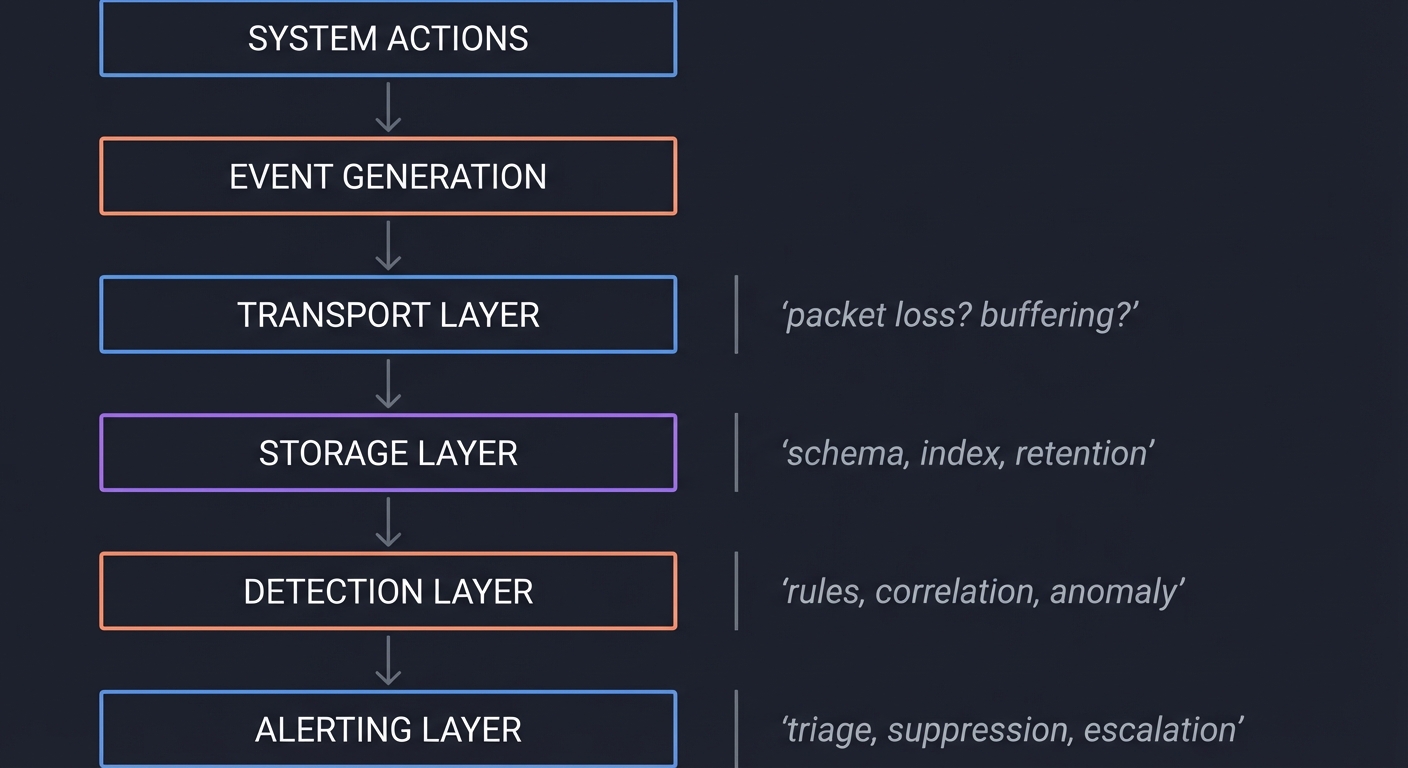
The Logging Stack as a System
[System Actions]
      |
      v
[Event Generation]
      |
      v
[Transport Layer] --- packet loss? buffering?
      |
      v
[Storage Layer] --- schema, index, retention
      |
      v
[Detection Layer] --- rules, correlation, anomaly
      |
      v
[Alerting Layer] --- triage, suppression, escalation
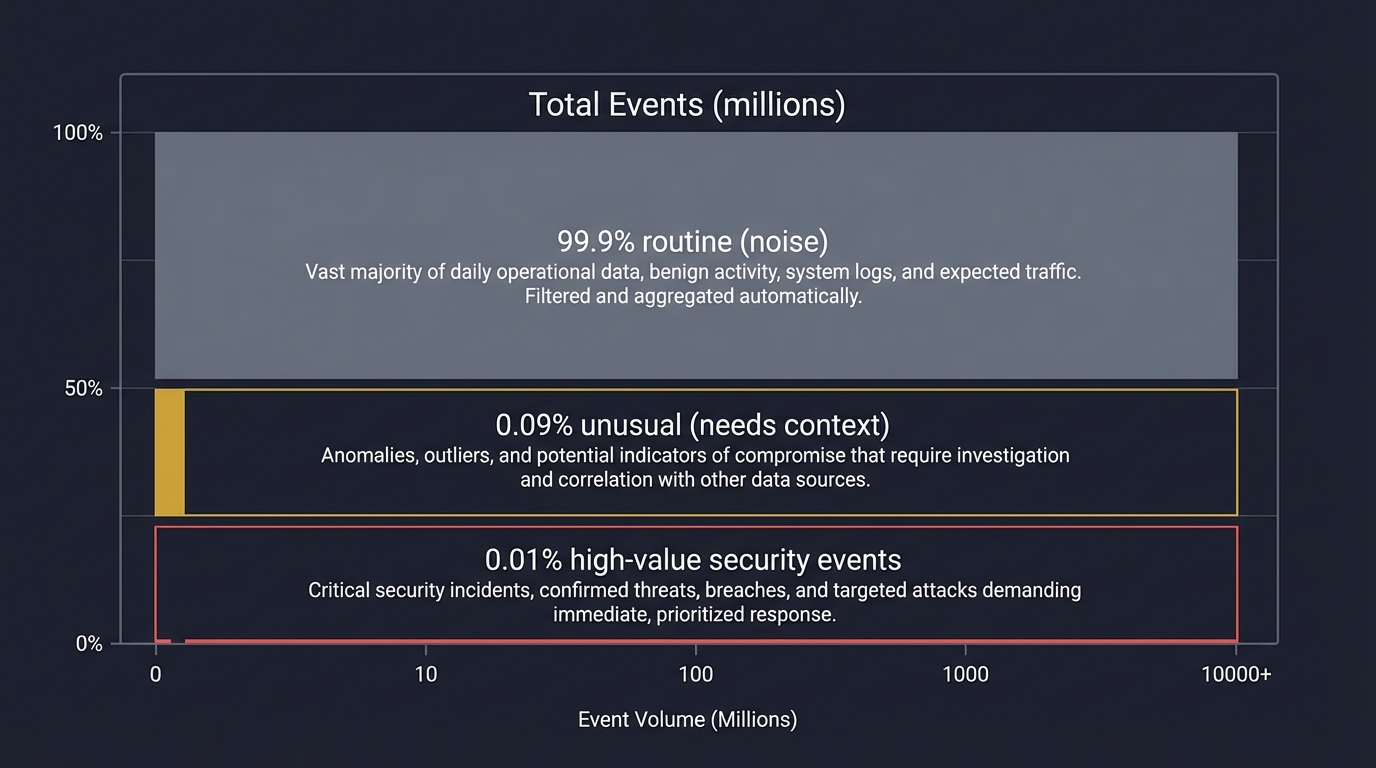
The High-Value Event Problem
Most logs are low value. High-value events are rare but critical. The job of detection is to surface them without losing context.
Total Events (millions)
┌───────────────────────────────────────────┐
│ 99.9% routine (noise)                      │
│ 0.09% unusual (needs context)              │
│ 0.01% high-value security events           │
└───────────────────────────────────────────┘
Anomaly Detection Mechanics
Anomaly detection is about learning normal and spotting deviations.
Baseline (Normal) -> Variation Range -> Outlier
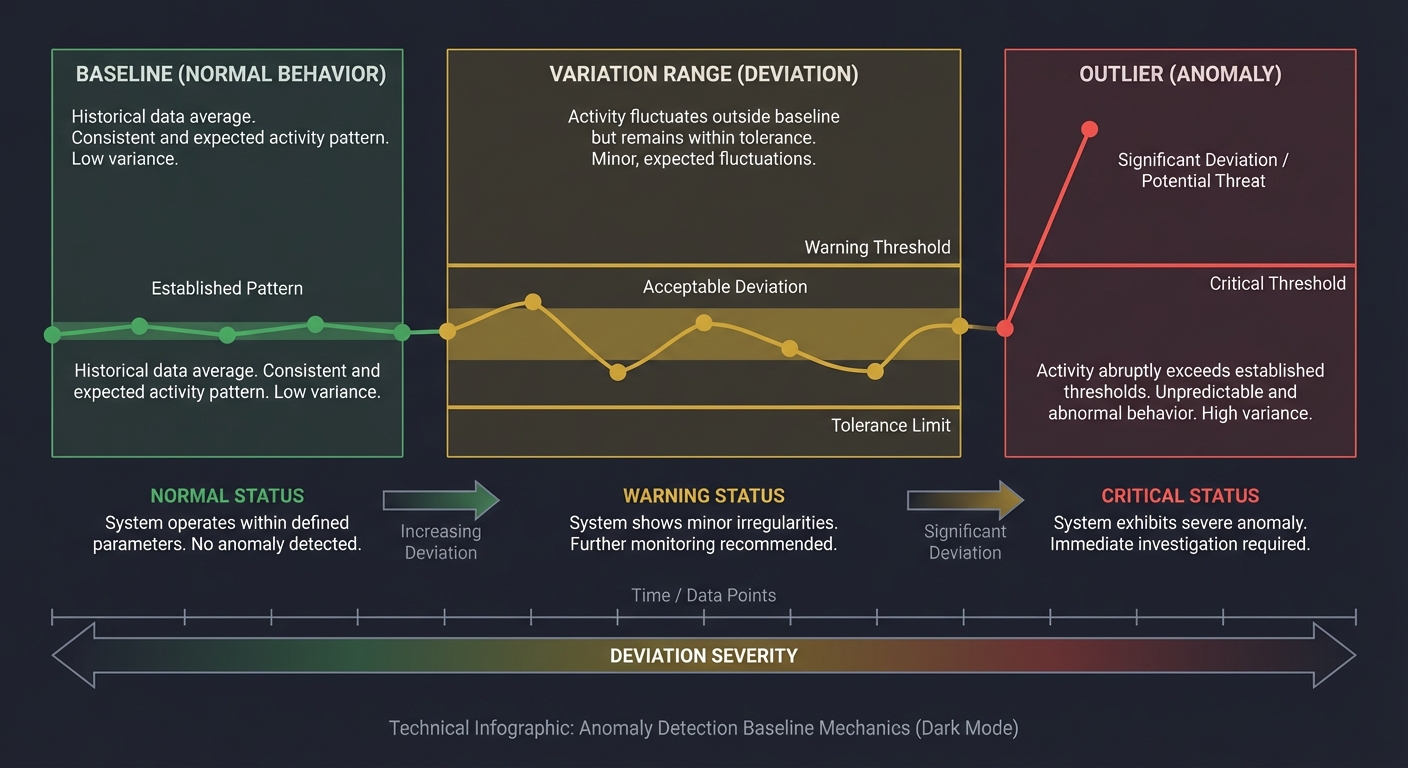
Key pitfalls:
- Seasonality (weekend vs weekday)
- Sparse data (rare events look anomalous)
- Concept drift (normal changes over time)
Concept Summary Table
| Concept Cluster | What You Need to Internalize |
|---|---|
| Audit Trails | Every action must be traceable, consistent, and tamper-resistant. |
| Event Taxonomy | You must classify events by security value and context. |
| Detection Logic | Rules and anomalies are complementary; both require tuning. |
| Alert Tuning | Precision, recall, and fatigue must be balanced deliberately. |
| Context & Enrichment | Logs are only useful when enriched with asset/user context. |
| Integrity & Retention | If logs cannot be trusted or retained, investigations fail. |
Deep Dive Reading by Concept
This section maps each concept to specific chapters for deeper understanding.
Audit Trails & Logging
| Concept | Book & Chapter |
|---|---|
| Audit logging fundamentals | “Security Engineering” by Ross Anderson — Ch. 10: “Logging and Monitoring” |
| Log design and audit evidence | “The Practice of Network Security Monitoring” by Richard Bejtlich — Ch. 2: “Logging” |
Detection Engineering
| Concept | Book & Chapter |
|---|---|
| Detection lifecycle | “Practical Security Monitoring” by Chris Sanders — Ch. 4: “Detection and Response” |
| SIEM detection patterns | “Blue Team Handbook” by Don Murdoch — Ch. 8: “Monitoring” |
Anomaly Detection & Tuning
| Concept | Book & Chapter |
|---|---|
| Anomalies and baselines | “Applied Network Security Monitoring” by Sanders & Smith — Ch. 5: “Baseline and Anomaly” |
| Alert fatigue and tuning | “Security Operations Center” by Joseph Muniz — Ch. 7: “Alert Management” |
Integrity & Forensics
| Concept | Book & Chapter |
|---|---|
| Log integrity and evidence | “Incident Response & Computer Forensics” by Luttgens et al. — Ch. 4: “Evidence Handling” |
| Retention and storage design | “The Practice of Network Security Monitoring” by Bejtlich — Ch. 9: “Storage” |
Essential Reading Order
- Foundation (Week 1):
- Security Engineering Ch. 10 (logging mindset)
- Practice of Network Security Monitoring Ch. 2 (log design)
- Detection (Week 2):
- Practical Security Monitoring Ch. 4
- Blue Team Handbook Ch. 8
- Anomaly & Tuning (Week 3):
- Applied Network Security Monitoring Ch. 5
- Security Operations Center Ch. 7
- Integrity & Forensics (Week 4):
- Incident Response & Computer Forensics Ch. 4
- Practice of Network Security Monitoring Ch. 9
Quick Start Guide: Your First 48 Hours
Feeling overwhelmed? Start here. This condensed path gets you from zero to working detection in two days.
Day 1: Understanding What You’re Building
Morning (2-3 hours):
- Read the “Why This Matters” section - Understand the crisis (alert fatigue, 500k daily alerts)
- Skim the Six Pillars - Don’t memorize, just get familiar with concepts
- Review Prerequisites - Install Python, set up your editor, test access to system logs
Afternoon (2-3 hours):
- Start Project 1 - Build the Audit Trail Inventory
- List 5 critical actions in your environment (logins, file access, config changes)
- Find where each is logged (auth.log, syslog, cloud audit logs)
- Create a simple coverage table in a spreadsheet or markdown file
Evening (1 hour):
- Read “Real World Outcome” for Projects 2-3 - See what you’re building toward
- Identify gaps - What actions have no logs? Write them down.
Day 2: Building Your First Detection
Morning (2-3 hours):
- Start Project 2 - Log Schema Normalizer
- Pick 2 log sources (e.g., auth.log and cloud audit logs)
- Extract sample events from each
- Define 5 common fields: user, action, result, timestamp, source_ip
Afternoon (2-3 hours):
- Write normalization code - Simple Python script:
- Parse each log format
- Map to your 5 common fields
- Output as JSON or CSV
Evening (1 hour):
- Test your normalizer - Run it on real log samples
- Reflect - You now understand why SIEM vendors charge so much for normalization!
Next Steps After 48 Hours
Week 1: Complete Projects 1-2 fully Week 2: Tackle Project 3 (High-Value Event Classifier) Week 3: Read assigned chapters from “Practice of Network Security Monitoring” Week 4+: Continue with Projects 4-10 based on your pace
Key Insight: The first 3 projects are foundational. Don’t skip them. They make everything else make sense.
Recommended Learning Paths
Choose your path based on your background and goals. All paths complete the same projects but in different orders with different emphasis.
Path 1: The SOC Analyst (I Work in Security Operations)
Your Goal: Reduce alert fatigue and improve detection accuracy in your current role.
Recommended Order:
- Project 3 - High-Value Event Classifier (understand what you’re drowning in)
- Project 6 - Alert Tuning Lab (immediately applicable to your job)
- Project 8 - Alert Validation Playbook (standardize triage today)
- Project 1 - Audit Trail Inventory (find logging gaps)
- Project 2 - Log Schema Normalizer (fix your data quality)
- Project 4 - Anomaly Baseline Builder (reduce false positives)
- Project 5 - Correlated Detection Rules (catch multi-step attacks)
- Project 9 - Detection Coverage Map (prove completeness)
- Project 7 - Audit Log Integrity (defend evidence)
- Project 10 - Incident Timeline Builder (speed up IR)
Why This Order: Starts with immediate pain points (alert volume), then builds backward to root causes (logging quality).
Path 2: The Detection Engineer (I Build Detection Rules)
Your Goal: Master the full detection engineering lifecycle from scratch.
Recommended Order:
- Project 1 - Audit Trail Inventory (know your evidence sources)
- Project 2 - Log Schema Normalizer (data quality first)
- Project 3 - High-Value Event Classifier (prioritization logic)
- Project 9 - Detection Coverage Map (gap analysis)
- Project 5 - Correlated Detection Rules (build complex detections)
- Project 4 - Anomaly Baseline Builder (behavioral detection)
- Project 6 - Alert Tuning Lab (optimize precision/recall)
- Project 8 - Alert Validation Playbook (enable analysts)
- Project 7 - Audit Log Integrity (defend your data)
- Project 10 - Incident Timeline Builder (validate detection outcomes)
Why This Order: Follows the logical detection engineering workflow from requirements to validation.
Path 3: The Incident Responder (I Investigate Breaches)
Your Goal: Reconstruct incidents faster and defend evidence in legal proceedings.
Recommended Order:
- Project 10 - Incident Timeline Builder (your core skill)
- Project 7 - Audit Log Integrity (evidence admissibility)
- Project 1 - Audit Trail Inventory (know what evidence exists)
- Project 2 - Log Schema Normalizer (merge multi-source evidence)
- Project 3 - High-Value Event Classifier (find pivots quickly)
- Project 5 - Correlated Detection Rules (understand attack chains)
- Project 9 - Detection Coverage Map (identify blind spots post-incident)
- Project 4 - Anomaly Baseline Builder (spot deviations)
- Project 8 - Alert Validation Playbook (improve triage)
- Project 6 - Alert Tuning Lab (reduce noise for future incidents)
Why This Order: Starts with reconstruction skills, then builds toward proactive detection.
Path 4: The Security Architect (I Design Logging Infrastructure)
Your Goal: Build scalable, defensible logging systems from first principles.
Recommended Order:
- Project 1 - Audit Trail Inventory (requirements gathering)
- Project 9 - Detection Coverage Map (gap analysis and threat modeling)
- Project 7 - Audit Log Integrity (design for tamper-resistance)
- Project 2 - Log Schema Normalizer (design schema standards)
- Project 3 - High-Value Event Classifier (optimize storage/retention)
- Project 5 - Correlated Detection Rules (design for correlation)
- Project 4 - Anomaly Baseline Builder (plan for behavioral analytics)
- Project 6 - Alert Tuning Lab (model analyst capacity)
- Project 8 - Alert Validation Playbook (design SOC workflows)
- Project 10 - Incident Timeline Builder (design for forensics)
Why This Order: Focuses on design decisions, requirements, and architecture tradeoffs.
Path 5: The Beginner (I’m New to Security)
Your Goal: Build foundational understanding through hands-on projects.
Recommended Order:
- Project 1 - Audit Trail Inventory (learn what logs are)
- Project 2 - Log Schema Normalizer (learn data processing)
- Project 8 - Alert Validation Playbook (learn triage workflows)
- Project 3 - High-Value Event Classifier (learn prioritization)
- Project 6 - Alert Tuning Lab (learn metrics)
- Project 9 - Detection Coverage Map (learn threat modeling)
- Project 4 - Anomaly Baseline Builder (learn statistics)
- Project 5 - Correlated Detection Rules (learn correlation)
- Project 7 - Audit Log Integrity (learn cryptography)
- Project 10 - Incident Timeline Builder (learn forensics)
Why This Order: Gradually increases complexity while building on prior concepts.
Path 6: The SIEM Engineer (I Manage SIEM Platforms)
Your Goal: Understand SIEM internals to troubleshoot and optimize platforms.
Recommended Order:
- Project 2 - Log Schema Normalizer (your daily pain point)
- Project 1 - Audit Trail Inventory (know your data sources)
- Project 5 - Correlated Detection Rules (build correlation engine)
- Project 6 - Alert Tuning Lab (optimize SIEM output)
- Project 3 - High-Value Event Classifier (reduce noise)
- Project 4 - Anomaly Baseline Builder (implement behavioral analytics)
- Project 7 - Audit Log Integrity (ensure data trustworthiness)
- Project 9 - Detection Coverage Map (prove value)
- Project 8 - Alert Validation Playbook (support analysts)
- Project 10 - Incident Timeline Builder (enable IR teams)
Why This Order: Mirrors typical SIEM implementation lifecycle.
Project List
Projects are ordered from foundational logging to advanced detection tuning.
Project 1: Audit Trail Inventory & Gap Analyzer
- File: THREAT_DETECTION_LOGGING_PROJECTS.md
- Main Programming Language: Python
- Alternative Programming Languages: Go, Rust, Bash
- Coolness Level: Level 2: Practical but Forgettable
- Business Potential: 3. The “Service & Support” Model (B2B Utility)
- Difficulty: Level 1: Beginner
- Knowledge Area: Logging / Audit Trails
- Software or Tool: Syslog / OS audit logs
- Main Book: “Security Engineering” by Ross Anderson
What you’ll build: A structured audit-trail inventory that maps every system action to its corresponding log source, field coverage, and gaps.
Why it teaches threat detection & logging: You cannot detect what you do not log. This project forces you to understand audit trail completeness.
Core challenges you’ll face:
- Building a taxonomy of security-relevant actions
- Mapping actions to actual log sources
- Identifying missing or low-fidelity logging
Key Concepts
- Audit trail coverage: Security Engineering — Ross Anderson
- Logging vs monitoring: The Practice of Network Security Monitoring — Bejtlich
- Threat modeling for logs: Practical Security Monitoring — Sanders
Difficulty: Beginner Time estimate: Weekend Prerequisites: Basic OS familiarity, ability to read system logs, basic scripting
Real World Outcome
Deliverables:
- Detection rules and alert output
- Triage report for sample events
Validation checklist:
- Sample attacks trigger alerts
- False positives are documented
- Logs include required context
You will produce a structured report (table + narrative) that lists the top 30 security-relevant actions in your environment and exactly where each action is logged (or not logged).
You will see:
- A coverage matrix with rows as actions and columns as log sources
- A list of “missing evidence” areas
- A prioritized backlog of logging improvements
Example Output:
Audit Coverage Report
=====================
Action: Privileged login
  Source: /var/log/auth.log
  Coverage: user, timestamp, source IP
  Gap: missing device ID

Action: New admin role assignment
  Source: Cloud audit logs
  Coverage: who/when/role
  Gap: missing approver identity

Action: Failed MFA attempt
  Source: IdP logs
  Coverage: user, timestamp, result
  Gap: missing IP and device
The Core Question You’re Answering
“What do I need to log to make security-relevant actions provable and traceable?”
Before you write anything, sit with this question. The biggest mistake in detection engineering is assuming logs already capture what you need.
Concepts You Must Understand First
Stop and research these before coding:
- Audit trails
- What makes an audit record legally defensible?
- What is the difference between audit and debug logs?
- How can audit logs be tampered with?
- Book Reference: “Security Engineering” Ch. 10 — Ross Anderson
- Log sources
- What are the default OS log sources on your system?
- What events do cloud platforms emit by default?
- Book Reference: “The Practice of Network Security Monitoring” Ch. 2 — Bejtlich
Questions to Guide Your Design
Before implementing, think through these:
- Scope
- Which systems and applications are in scope?
- What constitutes a “security-relevant” action in your environment?
- Coverage assessment
- How will you decide if an action is fully covered?
- How will you measure gaps consistently?
Thinking Exercise
Trace the Evidence Chain
Before coding, draw a timeline for a privileged login and list every log record that should exist. Then ask:
Questions while tracing:
- What if the attacker deletes local logs?
- What if the action occurs in a cloud control plane?
- What evidence proves the user’s intent vs automation?
The Interview Questions They’ll Ask
Prepare to answer these:
- “What is the difference between audit logging and operational logging?”
- “How do you determine if a logging strategy is complete?”
- “What are common gaps in audit trails?”
- “How would you defend the integrity of audit logs?”
- “What is the minimum evidence needed to prove an action occurred?”
Hints in Layers
Hint 1: Start with a small system Pick one server or one SaaS app and list its critical actions.
Hint 2: Build a simple action taxonomy Group actions into authentication, authorization, data access, and configuration.
Hint 3: Add source mapping For each action, list the exact log file or API event.
Hint 4: Validate with a test event Trigger one real action and confirm it appears in the mapped log.
Books That Will Help
| Topic | Book | Chapter |
|---|---|---|
| Audit logging | “Security Engineering” by Ross Anderson | Ch. 10 |
| Log design | “The Practice of Network Security Monitoring” by Richard Bejtlich | Ch. 2 |
| Evidence handling | “Incident Response & Computer Forensics” by Luttgens et al. | Ch. 4 |
Implementation Hints Focus on building a clear taxonomy first. Your inventory must be stable enough to update as systems change, or it will be abandoned.
Learning milestones:
- You can list critical actions and find their log sources
- You can explain why some actions have weak audit trails
- You can propose concrete logging improvements with confidence
Common Pitfalls & Debugging
Problem 1: “My coverage matrix is too large and unmanageable”
- Why: You’re trying to audit everything at once
- Fix: Start with 5-10 high-value actions (privileged access, data deletion, config changes)
- Quick test: Can you explain each action to a non-technical person?
Problem 2: “I don’t know what counts as ‘security-relevant’“
- Why: No threat model or risk framework exists
- Fix: Ask: “If this action went wrong, would we need evidence?” If yes, it’s security-relevant
- Quick test: Review past incidents—were those actions logged?
Problem 3: “Log sources don’t map cleanly to actions”
- Why: Most real systems log actions across multiple sources
- Fix: Mark “Partial” coverage when multiple sources are needed; document the combination
- Quick test: Trigger one action and verify all expected logs appear
Problem 4: “Cloud logs are incomplete or missing”
- Why: Cloud audit logging often requires explicit enablement (AWS CloudTrail, Azure Monitor)
- Fix: Check that audit logging is enabled for all services and regions
- Quick test: Perform a known action in the cloud console and verify it appears in logs within 15 minutes
Problem 5: “I can’t find documentation for log formats”
- Why: Vendor documentation is often incomplete or outdated
- Fix: Generate test events and reverse-engineer the format; use jq or log parsing tools
- Quick test: Parse 10 sample events successfully before declaring coverage
Project 2: Log Schema Normalizer & Field Dictionary
- File: THREAT_DETECTION_LOGGING_PROJECTS.md
- Main Programming Language: Python
- Alternative Programming Languages: Go, JavaScript
- Coolness Level: Level 3: Genuinely Clever
- Business Potential: 2. The “Micro-SaaS / Pro Tool”
- Difficulty: Level 2: Intermediate
- Knowledge Area: Data Normalization / Logging
- Software or Tool: JSON / CSV log formats
- Main Book: “Applied Network Security Monitoring” by Sanders & Smith
What you’ll build: A schema normalization tool that converts multiple raw log formats into a single consistent field dictionary.
Why it teaches threat detection & logging: Detection rules only work when fields are consistent. This project teaches the hidden discipline of log normalization.
Core challenges you’ll face:
- Defining a consistent field vocabulary
- Mapping different log sources to common fields
- Handling missing or ambiguous fields
Key Concepts
- Log normalization: Applied Network Security Monitoring — Sanders & Smith
- Field naming consistency: Practical Security Monitoring — Sanders
- Data quality checks: Security Operations Center — Muniz
Difficulty: Intermediate Time estimate: 1-2 weeks Prerequisites: Basic data processing, familiarity with JSON/CSV, project 1 complete
Real World Outcome
Deliverables:
- Detection rules and alert output
- Triage report for sample events
Validation checklist:
- Sample attacks trigger alerts
- False positives are documented
- Logs include required context
You will have a normalized dataset where authentication, system, and cloud logs all share common fields like user, action, result, src_ip, and asset.
You will see:
- A field dictionary document
- A transformed dataset that is ready for detection rules
- A report of missing or inconsistent fields
Example Output:
Normalized Field Dictionary
===========================
user: identity performing the action
action: verb describing the event
result: success | failure
src_ip: source IP address
asset: system or service targeted

Normalization Summary
=====================
Source: auth.log -> mapped 12 fields
Source: cloud_audit.json -> mapped 15 fields
Missing: device_id in auth.log
The Core Question You’re Answering
“How can I make logs from different systems speak the same language?”
Most detection failures come from inconsistent data. Normalization is how you enable automation.
Concepts You Must Understand First
- Log schemas
- What are the essential fields for security analysis?
- How do schemas differ across vendors?
- Book Reference: “Applied Network Security Monitoring” Ch. 3 — Sanders & Smith
- Data quality
- What makes a field reliable enough for detection?
- How do you handle missing values?
- Book Reference: “Security Operations Center” Ch. 7 — Muniz
Questions to Guide Your Design
- Field vocabulary
- Which fields are mandatory for all events?
- Which fields are optional but valuable?
- Mapping rules
- How will you document mapping from each source?
- How will you handle fields that do not exist in some sources?
Thinking Exercise
Normalize Three Events
Take three real events (login success, file delete, role change). Write down their raw fields from each log source. Now map them to your unified schema and note what information is lost.
Questions while mapping:
- Which fields are ambiguous?
- Which fields are missing entirely?
- Which fields are most critical for detection?
The Interview Questions They’ll Ask
- “Why is normalization essential for detection rules?”
- “What are common schema pitfalls across log sources?”
- “How do you handle missing or inconsistent fields?”
- “What is the tradeoff between normalization and raw log fidelity?”
- “How would you design a field dictionary for security events?”
Hints in Layers
Hint 1: Start with a minimal schema Begin with user, action, result, timestamp, asset.
Hint 2: Add context fields Add src_ip, user_role, device, session_id.
Hint 3: Build mapping tables Create a per-source mapping table before transforming data.
Hint 4: Validate with samples Test your mapping on a small sample before scaling.
Books That Will Help
| Topic | Book | Chapter |
|---|---|---|
| Log normalization | “Applied Network Security Monitoring” by Sanders & Smith | Ch. 3 |
| Detection data prep | “Practical Security Monitoring” by Chris Sanders | Ch. 4 |
| Alert management | “Security Operations Center” by Joseph Muniz | Ch. 7 |
Implementation Hints Your dictionary is a contract. Treat it like a schema that all detections will depend on.
Learning milestones:
- You can normalize two different log sources into one schema
- You can explain which fields are essential and why
- You can use normalized fields to support rule logic
Common Pitfalls & Debugging
Problem 1: “Field names don’t match across sources”
- Why: Different vendors use different terminology (username vs user_id vs principal)
- Fix: Create explicit mapping tables per source; document aliases
- Quick test: Normalize 5 events from each source and verify field consistency
Problem 2: “Timestamp formats are inconsistent”
- Why: Logs use different time zones, formats (ISO8601, Unix epoch, custom formats)
- Fix: Convert everything to UTC and ISO8601 format during normalization
- Quick test: Parse timestamps from all sources and sort chronologically
Problem 3: “Missing fields break my normalizer”
- Why: Not all log sources provide all fields (e.g., no src_ip in local logs)
- Fix: Define required vs optional fields; use null/empty for missing values
- Quick test: Process logs with missing fields without crashing
Problem 4: “Normalized data loses important context”
- Why: Over-normalization discards vendor-specific details
- Fix: Keep original raw log alongside normalized version; add vendor-specific fields as optional
- Quick test: Verify you can still answer vendor-specific questions from normalized data
Problem 5: “Normalization performance is too slow”
- Why: Processing millions of events with complex regex/parsing
- Fix: Use compiled regex, batch processing, or stream processing frameworks
- Quick test: Process 10,000 events in under 10 seconds
Project 3: High-Value Event Classifier
- File: THREAT_DETECTION_LOGGING_PROJECTS.md
- Main Programming Language: Python
- Alternative Programming Languages: Go, Rust
- Coolness Level: Level 3: Genuinely Clever
- Business Potential: 3. The “Service & Support” Model (B2B Utility)
- Difficulty: Level 2: Intermediate
- Knowledge Area: Event Taxonomy / Risk Scoring
- Software or Tool: Log database / CSV datasets
- Main Book: “The Practice of Network Security Monitoring” by Richard Bejtlich
What you’ll build: A classifier that tags events as routine, suspicious, high-value, or critical based on context and asset importance.
Why it teaches threat detection & logging: High-value events drive alerting. This teaches how to separate signal from noise.
Core challenges you’ll face:
- Defining severity criteria
- Incorporating asset and user context
- Handling ambiguous or borderline cases
Key Concepts
- Event triage: The Practice of Network Security Monitoring — Bejtlich
- Context enrichment: Security Operations Center — Muniz
- Risk-based prioritization: Practical Security Monitoring — Sanders
Difficulty: Intermediate Time estimate: 1-2 weeks Prerequisites: Project 2, basic data analysis
Real World Outcome
Deliverables:
- Detection rules and alert output
- Triage report for sample events
Validation checklist:
- Sample attacks trigger alerts
- False positives are documented
- Logs include required context
You will produce a labeled event dataset and a report that shows:
- How many events fall into each value bucket
- Which assets generate the highest-value events
- Which users are associated with most critical actions
Example Output:
High-Value Event Summary
========================
Critical: 12 events
High: 87 events
Suspicious: 1,240 events
Routine: 85,600 events

Top Critical Events
- Admin role change on payroll system
- Deletion of audit log retention policy
- Service account token creation
The Core Question You’re Answering
“Which events deserve immediate attention, and why?”
Without a value model, every alert feels equally urgent.
Concepts You Must Understand First
- Event severity
- What differentiates routine vs high-value?
- How do business assets affect severity?
- Book Reference: “The Practice of Network Security Monitoring” Ch. 4 — Bejtlich
- Context enrichment
- What contextual data changes an event’s value?
- Book Reference: “Security Operations Center” Ch. 6 — Muniz
Questions to Guide Your Design
- Value model
- How will you score events?
- Which fields are most important for severity?
- Ambiguity handling
- How will you handle events that could be routine or malicious?
Thinking Exercise
Rank Events by Value
Pick five events from your logs. Rank them from routine to critical and write one sentence justifying each rank.
Questions while ranking:
- What if the event occurred on a crown-jewel system?
- What if the user is a contractor vs an admin?
- What if the event is outside business hours?
The Interview Questions They’ll Ask
- “How do you define a high-value security event?”
- “What context fields increase event severity?”
- “How do you avoid over-prioritizing noisy events?”
- “How would you implement risk-based alerting?”
- “What is the role of asset criticality in detection?”
Hints in Layers
Hint 1: Start with a manual rubric Define 3-5 severity rules before automating.
Hint 2: Add asset criticality Create a simple asset tier list and map it to severity.
Hint 3: Add user role weighting Privileged accounts raise event value.
Hint 4: Validate with real incidents Compare your rankings to past incidents if available.
Books That Will Help
| Topic | Book | Chapter |
|---|---|---|
| Event triage | “The Practice of Network Security Monitoring” by Richard Bejtlich | Ch. 4 |
| Context in alerts | “Security Operations Center” by Joseph Muniz | Ch. 6 |
| Risk-based detection | “Practical Security Monitoring” by Chris Sanders | Ch. 5 |
Implementation Hints Design a transparent scoring method. If you cannot explain why an event is high value, the system will not be trusted.
Learning milestones:
- You can justify why specific events are high value
- You can classify events with consistent logic
- You can use classification to drive alert routing
Common Pitfalls & Debugging
Problem 1: “Everything gets classified as high-value or low-value (nothing in between)”
- Why: Your scoring rubric is binary instead of graduated
- Fix: Use weighted scoring across multiple dimensions (asset + action + user role + time)
- Quick test: Your distribution should be roughly: 5% critical, 15% high, 30% suspicious, 50% routine
Problem 2: “Routine admin tasks keep getting flagged as high-value”
- Why: Context is missing (maintenance windows, change tickets)
- Fix: Add exception lists or scheduled task awareness; enrich with CMDB data
- Quick test: Known maintenance windows should not generate high-value events
Problem 3: “Can’t decide between ‘suspicious’ and ‘high-value’“
- Why: Ambiguous classification criteria
- Fix: Define clear thresholds: High-value = privileged action on critical asset. Suspicious = unusual but not yet proven malicious
- Quick test: Two analysts should classify the same 10 events identically
Problem 4: “Asset criticality data is outdated or missing”
- Why: Asset inventory is not maintained or integrated
- Fix: Start with a small tier list (crown jewels, production, dev, test); update quarterly
- Quick test: Manually verify the top 10 critical assets are correctly classified
Problem 5: “Event classification changes too often”
- Why: Scoring rules keep getting tweaked without versioning
- Fix: Version your classification logic; track changes; analyze impact before deploying
- Quick test: Re-classify last month’s data with new rules and compare distribution changes
Project 4: Anomaly Baseline Builder for Authentication Events
- File: THREAT_DETECTION_LOGGING_PROJECTS.md
- Main Programming Language: Python
- Alternative Programming Languages: R, Julia
- Coolness Level: Level 4: Hardcore Tech Flex
- Business Potential: 2. The “Micro-SaaS / Pro Tool”
- Difficulty: Level 3: Advanced
- Knowledge Area: Anomaly Detection
- Software or Tool: Log dataset / time-series analysis
- Main Book: “Applied Network Security Monitoring” by Sanders & Smith
What you’ll build: A baseline model of normal authentication behavior that flags unusual patterns (time, location, volume, or device).
Why it teaches threat detection & logging: Anomaly detection requires understanding baselines and normal variance.
Core challenges you’ll face:
- Choosing baseline windows
- Handling seasonality and drift
- Explaining why an event is anomalous
Key Concepts
- Baselines: Applied Network Security Monitoring — Sanders & Smith
- Behavioral patterns: Practical Security Monitoring — Sanders
- False positive control: Security Operations Center — Muniz
Difficulty: Advanced Time estimate: 1 month+ Prerequisites: Projects 2-3, basic statistics
Real World Outcome
Deliverables:
- Detection rules and alert output
- Triage report for sample events
Validation checklist:
- Sample attacks trigger alerts
- False positives are documented
- Logs include required context
You will have a daily/weekly baseline report showing normal login volumes and a list of anomalies with reason codes.
Example Output:
Authentication Baseline Summary
===============================
Normal login window: 08:00-19:00
Typical daily logins: 320-420
Common login geos: US-CA, US-NY

Anomalies Detected
- 02:37 UTC: 14 logins from new geo (RO)
- 03:10 UTC: 8 failed logins for admin account
- 22:45 UTC: 3 logins outside normal window
The Core Question You’re Answering
“What does normal look like, and how do I detect meaningful deviations?”
Without a baseline, anomalies are just noise.
Concepts You Must Understand First
- Baselining
- What time window defines “normal”?
- How does seasonality affect the baseline?
- Book Reference: “Applied Network Security Monitoring” Ch. 5 — Sanders & Smith
- Drift and adaptation
- How does normal behavior change over time?
- Book Reference: “Security Operations Center” Ch. 7 — Muniz
Questions to Guide Your Design
- Baseline definition
- What metrics matter most (counts, times, geos)?
- What aggregation level reduces noise?
- Anomaly explanation
- How will you explain why an event is anomalous?
Thinking Exercise
Draw the Normal Curve
Sketch a week of login counts. Mark the range you consider normal. Then mark where you would alert.
Questions while sketching:
- What happens on weekends?
- How would you handle a company-wide password reset?
- Which anomalies should be ignored?
The Interview Questions They’ll Ask
- “How do you define a baseline for log data?”
- “What is the difference between anomaly and incident?”
- “How do you reduce false positives in anomaly detection?”
- “What is concept drift, and why does it matter?”
- “How do you explain anomalies to analysts?”
Hints in Layers
Hint 1: Start with simple statistics Use daily counts and a fixed range to define normal.
Hint 2: Add time-of-day patterns Segment by business hours vs off-hours.
Hint 3: Add geo and device context A new geo might be more important than a count spike.
Hint 4: Add change detection Compare this week to last week to detect drift.
Books That Will Help
| Topic | Book | Chapter |
|---|---|---|
| Baselines | “Applied Network Security Monitoring” by Sanders & Smith | Ch. 5 |
| Detection logic | “Practical Security Monitoring” by Chris Sanders | Ch. 4 |
| Alert tuning | “Security Operations Center” by Joseph Muniz | Ch. 7 |
Implementation Hints Start with explainable thresholds. Complex models are useless if analysts cannot justify them.
Learning milestones:
- You can define a baseline and detect deviations
- You can explain why a login is anomalous
- You can tune thresholds to reduce false positives
Common Pitfalls & Debugging
Problem 1: “Baseline keeps flagging weekends as anomalies”
- Why: Seasonality not accounted for in your baseline
- Fix: Segment baselines by day-of-week and hour-of-day; business hours vs off-hours
- Quick test: Weekend login patterns should have separate baselines from weekdays
Problem 2: “Too many false positives from new users”
- Why: New users have no baseline history
- Fix: Require minimum observation period (7-14 days) before anomaly detection activates
- Quick test: New accounts should be marked as “learning” for the first 2 weeks
Problem 3: “Legitimate business changes trigger mass anomalies”
- Why: Baseline hasn’t adapted to new normal (company growth, new office, merger)
- Fix: Implement rolling baselines (last 30 days) instead of fixed historical baselines
- Quick test: When a known change occurs, baseline should adapt within 7 days
Problem 4: “Can’t explain why an event is anomalous”
- Why: Black-box ML model or vague threshold
- Fix: Use explainable features (geo, time, volume, device) and document which feature triggered the anomaly
- Quick test: Every anomaly alert should include: “Anomalous because: [specific reason]”
Problem 5: “Baseline is too noisy with small deviations”
- Why: Threshold set too tight (1 standard deviation)
- Fix: Start with 2-3 standard deviations for alerts; lower for logging only
- Quick test: Should alert on <5% of events, not 20%
Project 5: Correlated Detection Rule Builder (Multi-Event)
- File: THREAT_DETECTION_LOGGING_PROJECTS.md
- Main Programming Language: Python
- Alternative Programming Languages: Go, Java
- Coolness Level: Level 4: Hardcore Tech Flex
- Business Potential: 3. The “Service & Support” Model (B2B Utility)
- Difficulty: Level 3: Advanced
- Knowledge Area: Detection Engineering
- Software or Tool: SIEM-style rule logic
- Main Book: “Practical Security Monitoring” by Chris Sanders
What you’ll build: A correlation engine that flags sequences of events (e.g., failed logins followed by privileged access) within a defined time window.
Why it teaches threat detection & logging: Most real attacks require multiple steps. Correlation is how you detect them.
Core challenges you’ll face:
- Designing event sequences
- Managing time windows
- Avoiding overly broad correlations
Key Concepts
- Correlation logic: Practical Security Monitoring — Sanders
- Event sequencing: Applied Network Security Monitoring — Sanders & Smith
- Alert precision: Security Operations Center — Muniz
Difficulty: Advanced Time estimate: 1 month+ Prerequisites: Projects 2-4, strong understanding of log fields
Real World Outcome
Deliverables:
- Detection rules and alert output
- Triage report for sample events
Validation checklist:
- Sample attacks trigger alerts
- False positives are documented
- Logs include required context
You will generate alert records that show correlated events with a narrative timeline.
Example Output:
Correlation Alert: Potential Account Takeover
============================================
Sequence:
1. 09:02 - 6 failed logins for user: j.smith
2. 09:05 - Successful login from new IP
3. 09:07 - Privileged role granted
4. 09:10 - Sensitive file accessed

Confidence: High
The Core Question You’re Answering
“How can I detect multi-step attacks that look benign in isolation?”
Single events are often noisy; sequences reveal intent.
Concepts You Must Understand First
- Event correlation
- What constitutes a meaningful sequence?
- How do you avoid overfitting?
- Book Reference: “Practical Security Monitoring” Ch. 5 — Sanders
- Temporal windows
- How does window size affect detection?
- Book Reference: “Applied Network Security Monitoring” Ch. 6 — Sanders & Smith
Questions to Guide Your Design
- Sequence design
- Which event chains are most indicative of compromise?
- How do you encode the order and timing?
- False positive control
- Which sequences are common in normal operations?
Thinking Exercise
Build an Attack Chain
List a common attack (password spray, privilege escalation, data exfiltration). Break it into 4-5 event steps and mark which log sources capture each.
Questions while chaining:
- Which step is most reliable to detect?
- Which step could be missing?
- What sequence is strong enough to alert?
The Interview Questions They’ll Ask
- “How do correlation rules differ from single-event rules?”
- “What is an example of a multi-step detection?”
- “How does window size impact false positives?”
- “How do you test correlation rules safely?”
- “What is the biggest risk in correlation engines?”
Hints in Layers
Hint 1: Start with two-step correlations Example: failed logins followed by success.
Hint 2: Add a third step Add a privileged action after the login.
Hint 3: Add context thresholds Require the target asset to be high-value.
Hint 4: Build a timeline output Make alerts readable as a story.
Books That Will Help
| Topic | Book | Chapter |
|---|---|---|
| Correlation | “Practical Security Monitoring” by Chris Sanders | Ch. 5 |
| Sequencing | “Applied Network Security Monitoring” by Sanders & Smith | Ch. 6 |
| Alert design | “Security Operations Center” by Joseph Muniz | Ch. 7 |
Implementation Hints Focus on interpretability. A good correlation alert should read like a timeline, not a black box.
Learning milestones:
- You can encode and detect a simple two-step sequence
- You can add context and timing constraints
- You can justify why a correlation alert is high value
Common Pitfalls & Debugging
Problem 1: “Correlation rules trigger on unrelated events from different users”
- Why: Missing entity grouping (correlating by time only, not by user/asset)
- Fix: Always correlate by entity (user, IP, asset); use session IDs when available
- Quick test: Events in a correlation alert should share a common actor or target
Problem 2: “Time windows are too wide and catch coincidental events”
- Why: Using 24-hour windows when attacks happen in minutes
- Fix: Use attack-specific windows: credential stuffing (5 min), privilege escalation (15 min), exfiltration (1 hour)
- Quick test: Manually verify that correlated events are causally related, not coincidental
Problem 3: “Correlation engine is too slow”
- Why: Brute-force matching every event against every other event
- Fix: Use time-series databases, windowed streams, or in-memory indexes keyed by entity
- Quick test: Should process 10,000 events/sec without lag
Problem 4: “Correlated alerts are too noisy (too many benign sequences)”
- Why: Common workflows match your attack pattern (e.g., normal admin tasks)
- Fix: Add context filters: require asset criticality, unusual geo, off-hours, or anomalous baseline
- Quick test: 90%+ of correlated alerts should be actionable, not benign workflows
Problem 5: “Missing critical events in the middle of a sequence”
- Why: Log sources are incomplete or events are dropped
- Fix: Use “fuzzy correlation” that allows missing steps; mark confidence as “partial match”
- Quick test: Test with intentionally incomplete logs and verify partial detection
Project 6: Alert Tuning Lab (Precision vs Recall Simulator)
- File: THREAT_DETECTION_LOGGING_PROJECTS.md
- Main Programming Language: Python
- Alternative Programming Languages: R, JavaScript
- Coolness Level: Level 3: Genuinely Clever
- Business Potential: 2. The “Micro-SaaS / Pro Tool”
- Difficulty: Level 2: Intermediate
- Knowledge Area: Alert Tuning / Metrics
- Software or Tool: Metrics dashboards
- Main Book: “Security Operations Center” by Joseph Muniz
What you’ll build: A tuning simulator that shows how changing thresholds affects precision, recall, and alert fatigue.
Why it teaches threat detection & logging: Tuning is the difference between actionable alerts and noise.
Core challenges you’ll face:
- Defining detection metrics
- Balancing precision and recall
- Modeling analyst workload
Key Concepts
- Alert fatigue: Security Operations Center — Muniz
- Detection metrics: Practical Security Monitoring — Sanders
- Threshold tuning: Applied Network Security Monitoring — Sanders & Smith
Difficulty: Intermediate Time estimate: 1-2 weeks Prerequisites: Basic statistics, project 3 complete
Real World Outcome
Deliverables:
- Detection rules and alert output
- Triage report for sample events
Validation checklist:
- Sample attacks trigger alerts
- False positives are documented
- Logs include required context
You will see a dashboard-like summary showing how many alerts you generate at different threshold settings and how many true incidents you would catch.
Example Output:
Threshold: 5 failed logins
Precision: 0.42
Recall: 0.88
Alerts/day: 140
Estimated analyst hours: 7

Threshold: 10 failed logins
Precision: 0.71
Recall: 0.62
Alerts/day: 40
Estimated analyst hours: 2
The Core Question You’re Answering
“How do I tune alerts so analysts trust them and real attacks are not missed?”
Concepts You Must Understand First
- Precision and recall
- What do these metrics mean for security alerts?
- Book Reference: “Security Operations Center” Ch. 7 — Muniz
- Alert fatigue
- How does volume affect analyst performance?
- Book Reference: “Practical Security Monitoring” Ch. 6 — Sanders
Questions to Guide Your Design
- Metric definitions
- How will you calculate precision and recall?
- What counts as a true positive?
- Operational impact
- How will you estimate analyst workload?
Thinking Exercise
Tradeoff Table
Create a table with three thresholds and estimate precision/recall for each. Mark which threshold you would choose and why.
The Interview Questions They’ll Ask
- “What is alert fatigue and why does it matter?”
- “How do you balance precision and recall?”
- “How do you measure detection effectiveness?”
- “What is a tuning strategy for a noisy rule?”
- “How do you justify raising a threshold?”
Hints in Layers
Hint 1: Use a labeled dataset Start with events marked as incident vs non-incident.
Hint 2: Define thresholds clearly Make each threshold easy to compare.
Hint 3: Model analyst capacity Estimate time per alert to calculate workload.
Hint 4: Present results visually Graphs make tradeoffs obvious.
Books That Will Help
| Topic | Book | Chapter |
|---|---|---|
| Alert tuning | “Security Operations Center” by Joseph Muniz | Ch. 7 |
| Detection metrics | “Practical Security Monitoring” by Chris Sanders | Ch. 6 |
| Anomaly thresholds | “Applied Network Security Monitoring” by Sanders & Smith | Ch. 5 |
Implementation Hints Treat tuning as an experiment. Adjust one variable at a time so you can explain the result.
Learning milestones:
- You can compute precision/recall for alerts
- You can explain tradeoffs to stakeholders
- You can choose a threshold based on evidence
Common Pitfalls & Debugging
Problem 1: “Don’t have labeled data to measure precision/recall”
- Why: No historical incident data or ground truth
- Fix: Start with analyst feedback on recent alerts; retrospectively label 100-200 alerts
- Quick test: Can you identify 10 confirmed true positives and 10 confirmed false positives?
Problem 2: “Precision and recall both look bad”
- Why: Detection logic is fundamentally flawed, not just threshold issue
- Fix: Review detection logic before tuning thresholds; may need to redesign the rule
- Quick test: If precision <20% at any threshold, the rule needs redesign, not tuning
Problem 3: “Can’t balance precision and recall (increasing one tanks the other)”
- Why: This is normal! It’s a tradeoff
- Fix: Choose based on use case: high-value assets need high recall (catch everything); noisy environments need high precision (reduce fatigue)
- Quick test: Define acceptable minimums: e.g., “min 60% precision AND min 70% recall”
Problem 4: “Analyst workload estimates are unrealistic”
- Why: Not accounting for investigation complexity, only alert count
- Fix: Weight alerts by expected triage time (simple=5min, complex=30min)
- Quick test: Survey analysts on actual time spent per alert type
Problem 5: “Threshold tuning doesn’t stick (keeps getting reverted)”
- Why: No documentation or change control
- Fix: Document every threshold change with rationale and metrics before/after
- Quick test: Can you explain why the current threshold value was chosen?
Project 7: Audit Log Integrity Chain
- File: THREAT_DETECTION_LOGGING_PROJECTS.md
- Main Programming Language: Python
- Alternative Programming Languages: Go, Rust
- Coolness Level: Level 4: Hardcore Tech Flex
- Business Potential: 3. The “Service & Support” Model (B2B Utility)
- Difficulty: Level 3: Advanced
- Knowledge Area: Log Integrity / Forensics
- Software or Tool: Hashing / WORM storage concepts
- Main Book: “Incident Response & Computer Forensics” by Luttgens et al.
What you’ll build: A log integrity chain that hashes each record and detects tampering or deletion.
Why it teaches threat detection & logging: Audit logs are useless if they can be altered. Integrity is foundational.
Core challenges you’ll face:
- Designing a hash chain
- Handling log rotation
- Proving tampering reliably
Key Concepts
- Evidence integrity: Incident Response & Computer Forensics — Luttgens
- Logging trust: Security Engineering — Anderson
- Retention design: The Practice of Network Security Monitoring — Bejtlich
Difficulty: Advanced Time estimate: 1 month+ Prerequisites: Project 1, basic cryptography concepts
Real World Outcome
Deliverables:
- Detection rules and alert output
- Triage report for sample events
Validation checklist:
- Sample attacks trigger alerts
- False positives are documented
- Logs include required context
You will produce an integrity report that shows whether any audit records were altered or removed.
Example Output:
Log Integrity Report
====================
Records checked: 52,134
Chain status: VALID
Missing records: 0
Tampered records: 0

Integrity check: PASSED
The Core Question You’re Answering
“How can I prove that logs are trustworthy and untampered?”
Concepts You Must Understand First
- Hash chains
- How does chaining detect deletion or modification?
- Book Reference: “Incident Response & Computer Forensics” Ch. 4 — Luttgens
- Log retention
- What is the difference between retention and integrity?
- Book Reference: “The Practice of Network Security Monitoring” Ch. 9 — Bejtlich
Questions to Guide Your Design
- Chain structure
- What fields will be part of the hash input?
- How will you handle rotation or rollover?
- Verification
- How will you detect missing vs modified records?
Thinking Exercise
Tamper Scenario
Imagine an attacker deletes one record. Write down how your chain would reveal the exact point of tampering.
The Interview Questions They’ll Ask
- “How do you ensure audit log integrity?”
- “What is a hash chain and why use it?”
- “How do you handle log rotation with integrity?”
- “What is the difference between integrity and confidentiality?”
- “How do you prove logs are admissible evidence?”
Hints in Layers
Hint 1: Chain each record Each log record includes the previous record’s hash.
Hint 2: Add periodic anchors Store checkpoint hashes separately to reduce blast radius.
Hint 3: Handle rotation Store the final hash of each file to link to the next file.
Hint 4: Validate regularly Run integrity checks on a schedule.
Books That Will Help
| Topic | Book | Chapter |
|---|---|---|
| Evidence integrity | “Incident Response & Computer Forensics” by Luttgens et al. | Ch. 4 |
| Logging trust | “Security Engineering” by Ross Anderson | Ch. 10 |
| Log storage | “The Practice of Network Security Monitoring” by Richard Bejtlich | Ch. 9 |
Implementation Hints Keep the chain simple and auditable. The goal is proof, not complexity.
Learning milestones:
- You can detect any deletion or modification in a log file
- You can explain chain design and rotation
- You can defend audit log integrity in an investigation
Common Pitfalls & Debugging
Problem 1: “Hash chain breaks on log rotation”
- Why: New log file doesn’t include previous file’s final hash
- Fix: Store rotation metadata with final hash; link files explicitly in chain manifest
- Quick test: Rotate logs manually and verify chain validation spans rotation boundary
Problem 2: “Can’t detect which specific record was tampered”
- Why: Hashing entire file instead of individual records
- Fix: Hash each record individually and chain them; include record sequence number
- Quick test: Modify one record in the middle of a file and verify you can pinpoint it
Problem 3: “Performance degrades with millions of records”
- Why: Verifying entire chain sequentially is O(n)
- Fix: Add merkle tree or periodic checkpoint hashes for faster validation
- Quick test: Validate a file with 1M records in under 30 seconds
Problem 4: “Attacker could rebuild the chain after tampering”
- Why: Hash chain is stored locally with logs
- Fix: Store checkpoint hashes externally (write-once storage, cloud, blockchain); sign with private key
- Quick test: Even with local access, attacker cannot forge valid checkpoint hashes
Problem 5: “Hash chain adds too much storage overhead”
- Why: Storing full hash per record doubles file size
- Fix: Use compact hashes (SHA-256 truncated to 16 bytes); store chain in separate file
- Quick test: Chain metadata should add <10% storage overhead
Project 8: Alert Validation Playbook Builder
- File: THREAT_DETECTION_LOGGING_PROJECTS.md
- Main Programming Language: Markdown (documentation-first)
- Alternative Programming Languages: Python, Go
- Coolness Level: Level 2: Practical but Forgettable
- Business Potential: 3. The “Service & Support” Model (B2B Utility)
- Difficulty: Level 1: Beginner
- Knowledge Area: Alert Triage / Playbooks
- Software or Tool: SOC runbooks
- Main Book: “Security Operations Center” by Joseph Muniz
What you’ll build: A structured playbook for validating alerts, including evidence sources, expected artifacts, and false-positive indicators.
Why it teaches threat detection & logging: Even strong detections are useless without clear validation steps.
Core challenges you’ll face:
- Defining evidence requirements
- Distinguishing true vs false positives
- Documenting escalation paths
Key Concepts
- Triage workflows: Security Operations Center — Muniz
- Evidence collection: Incident Response & Computer Forensics — Luttgens
- Detection validation: Practical Security Monitoring — Sanders
Difficulty: Beginner Time estimate: Weekend Prerequisites: Project 3, basic security familiarity
Real World Outcome
Deliverables:
- Detection rules and alert output
- Triage report for sample events
Validation checklist:
- Sample attacks trigger alerts
- False positives are documented
- Logs include required context
You will have a ready-to-use playbook with step-by-step validation instructions for at least five alert types.
Example Output:
Playbook: Suspicious Login
==========================
Evidence to collect:
- Authentication logs for user
- Geo-IP reputation for source IP
- Device history for user

False-positive indicators:
- Known VPN IP
- Approved travel window

Escalation:
- If privileged account -> Tier 2
The Core Question You’re Answering
“How do I quickly and consistently validate alerts without guesswork?”
Concepts You Must Understand First
- Triage
- What is the minimum evidence required to validate an alert?
- Book Reference: “Security Operations Center” Ch. 5 — Muniz
- False positives
- What are common benign explanations for suspicious events?
- Book Reference: “Practical Security Monitoring” Ch. 6 — Sanders
Questions to Guide Your Design
- Playbook structure
- How will you document evidence sources?
- What is the escalation path?
- Consistency
- How do you ensure every analyst follows the same steps?
Thinking Exercise
Build a Validation Checklist
Pick one alert type and list the top five pieces of evidence you would check before escalating.
The Interview Questions They’ll Ask
- “What is an alert validation playbook?”
- “How do you reduce inconsistency in SOC triage?”
- “What is the minimum evidence for escalation?”
- “How do you document false positive conditions?”
- “How do you handle incomplete evidence?”
Hints in Layers
Hint 1: Start with one alert type Choose a login anomaly or malware alert.
Hint 2: Add evidence sources List exactly where analysts should look.
Hint 3: Add false-positive criteria List benign reasons an alert might trigger.
Hint 4: Define escalation Make escalation rules unambiguous.
Books That Will Help
| Topic | Book | Chapter |
|---|---|---|
| SOC workflows | “Security Operations Center” by Joseph Muniz | Ch. 5 |
| Evidence handling | “Incident Response & Computer Forensics” by Luttgens et al. | Ch. 4 |
| Validation | “Practical Security Monitoring” by Chris Sanders | Ch. 6 |
Implementation Hints Make every step testable. The playbook is only useful if it produces consistent decisions.
Learning milestones:
- You can define evidence requirements for alerts
- You can document false positive criteria
- You can standardize triage decisions
Common Pitfalls & Debugging
Problem 1: “Playbooks are too generic and don’t help with real alerts”
- Why: Written at too high a level without specific evidence sources
- Fix: Include exact log queries, specific field names, and example values
- Quick test: Hand playbook to new analyst—can they complete validation without asking questions?
Problem 2: “Analysts skip steps to save time”
- Why: Playbook is too long or includes unnecessary steps
- Fix: Optimize for speed: 5-7 critical steps max; mark optional steps clearly
- Quick test: Median triage time should be <10 minutes for routine alerts
Problem 3: “False positive indicators are missing or incomplete”
- Why: Playbook written before understanding benign patterns
- Fix: After first month, review closed alerts and document all false positive patterns observed
- Quick test: 80%+ of false positives should match documented patterns
Problem 4: “Escalation criteria are ambiguous”
- Why: Using subjective terms like “suspicious” without thresholds
- Fix: Make escalation binary: “If X AND Y, escalate. Otherwise, close.”
- Quick test: Two analysts given same evidence should make same escalation decision
Problem 5: “Playbooks become stale and outdated”
- Why: No ownership or review process
- Fix: Assign playbook owner; review quarterly; update after every incident
- Quick test: Can you prove playbooks were updated in last 90 days?
Project 9: Detection Coverage Map (Attack-to-Log)
- File: THREAT_DETECTION_LOGGING_PROJECTS.md
- Main Programming Language: Python
- Alternative Programming Languages: JavaScript, Go
- Coolness Level: Level 3: Genuinely Clever
- Business Potential: 3. The “Service & Support” Model (B2B Utility)
- Difficulty: Level 2: Intermediate
- Knowledge Area: Threat Modeling / Detection Coverage
- Software or Tool: MITRE ATT&CK mapping
- Main Book: “Practical Security Monitoring” by Chris Sanders
What you’ll build: A detection coverage map that links attack techniques to the logs and rules that detect them.
Why it teaches threat detection & logging: Coverage mapping shows where your logging and detection are blind.
Core challenges you’ll face:
- Mapping techniques to log sources
- Identifying coverage gaps
- Prioritizing high-risk blind spots
Key Concepts
- Threat modeling: Practical Security Monitoring — Sanders
- Coverage analysis: Security Operations Center — Muniz
- Logging gaps: The Practice of Network Security Monitoring — Bejtlich
Difficulty: Intermediate Time estimate: 1-2 weeks Prerequisites: Project 1, basic threat model familiarity
Real World Outcome
Deliverables:
- Detection rules and alert output
- Triage report for sample events
Validation checklist:
- Sample attacks trigger alerts
- False positives are documented
- Logs include required context
You will have a visual coverage matrix showing which attack techniques are detected, partially detected, or completely unmonitored.
Example Output:
Coverage Map Summary
====================
Technique: Credential Dumping
  Logs: Endpoint audit logs, process creation
  Coverage: Partial

Technique: Lateral Movement
  Logs: Network flow, authentication logs
  Coverage: Weak

Technique: Persistence (startup scripts)
  Logs: Syslog, file change audit
  Coverage: Strong
The Core Question You’re Answering
“Where are my detection blind spots, and which ones matter most?”
Concepts You Must Understand First
- Attack techniques
- How do attackers progress through stages?
- Book Reference: “Practical Security Monitoring” Ch. 3 — Sanders
- Detection mapping
- How do you prove a technique is detectable?
- Book Reference: “Security Operations Center” Ch. 6 — Muniz
Questions to Guide Your Design
- Mapping criteria
- What counts as “covered” vs “partial”?
- How will you validate coverage?
- Prioritization
- Which gaps represent the highest risk?
Thinking Exercise
Map One Technique
Pick one technique and list all the logs that would show evidence of it. Then mark which ones you already collect.
The Interview Questions They’ll Ask
- “What is a detection coverage map?”
- “How do you identify detection gaps?”
- “How do you validate coverage?”
- “What is the difference between partial and full coverage?”
- “How do you prioritize detection improvements?”
Hints in Layers
Hint 1: Start small Pick five techniques, not fifty.
Hint 2: Use a simple matrix Rows as techniques, columns as log sources.
Hint 3: Tag confidence levels Mark coverage as strong, partial, weak.
Hint 4: Add action items List the logs or rules needed to close gaps.
Books That Will Help
| Topic | Book | Chapter |
|---|---|---|
| Threat modeling | “Practical Security Monitoring” by Chris Sanders | Ch. 3 |
| Detection coverage | “Security Operations Center” by Joseph Muniz | Ch. 6 |
| Logging gaps | “The Practice of Network Security Monitoring” by Richard Bejtlich | Ch. 2 |
Implementation Hints Be brutally honest about coverage. A partial detection is often not enough in real incidents.
Learning milestones:
- You can map techniques to log evidence
- You can identify high-risk blind spots
- You can prioritize logging improvements
Common Pitfalls & Debugging
Problem 1: “Coverage map shows everything as ‘partial’ coverage”
- Why: Being overly conservative or unclear on what “full coverage” means
- Fix: Define full coverage = “can detect AND attribute AND timestamp with <5% false negative rate”
- Quick test: Test each “full coverage” claim with a simulation
Problem 2: “Can’t map techniques to log sources”
- Why: Lack of familiarity with MITRE ATT&CK or attack techniques
- Fix: Start with 10 common techniques (credential dumping, lateral movement, exfiltration); use ATT&CK’s data sources guide
- Quick test: Each technique should map to at least 2 independent log sources
Problem 3: “Coverage map is static and never updated”
- Why: No integration with logging infrastructure changes
- Fix: Re-run coverage assessment quarterly or after major infrastructure changes
- Quick test: Last update should be within 90 days
Problem 4: “Gaps identified but never fixed”
- Why: Coverage map doesn’t drive action
- Fix: Assign ownership to gaps; prioritize by risk; track remediation like vulnerabilities
- Quick test: Every gap should have: owner, priority, and target remediation date
Problem 5: “Coverage validation is theoretical, not tested”
- Why: Assuming logs exist without testing
- Fix: For each “covered” technique, run a purple team exercise or benign simulation
- Quick test: Detection fires correctly in test environment before marking as covered
Project 10: Incident Reconstruction Timeline Builder
- File: THREAT_DETECTION_LOGGING_PROJECTS.md
- Main Programming Language: Python
- Alternative Programming Languages: Go, Java
- Coolness Level: Level 3: Genuinely Clever
- Business Potential: 3. The “Service & Support” Model (B2B Utility)
- Difficulty: Level 3: Advanced
- Knowledge Area: Incident Response / Forensics
- Software or Tool: Timeline visualization
- Main Book: “Incident Response & Computer Forensics” by Luttgens et al.
What you’ll build: A timeline reconstruction tool that merges logs into a single incident narrative with timestamps and actor actions.
Why it teaches threat detection & logging: Detection is not enough; you must reconstruct what happened.
Core challenges you’ll face:
- Normalizing timestamps
- Merging multi-source logs
- Explaining causality vs coincidence
Key Concepts
- Incident timelines: Incident Response & Computer Forensics — Luttgens
- Log correlation: Practical Security Monitoring — Sanders
- Evidence sequencing: The Practice of Network Security Monitoring — Bejtlich
Difficulty: Advanced Time estimate: 1 month+ Prerequisites: Projects 2-5, log normalization and correlation
Real World Outcome
Deliverables:
- Detection rules and alert output
- Triage report for sample events
Validation checklist:
- Sample attacks trigger alerts
- False positives are documented
- Logs include required context
You will produce a clear timeline of an incident, with human-readable narrative labels and key pivots.
Example Output:
Incident Timeline: Suspicious Access
===================================
08:55 - Failed login attempts (user: j.smith, IP: 203.0.113.5)
09:01 - Successful login (new device)
09:04 - Privileged access granted
09:07 - Sensitive database accessed
09:10 - Data export initiated
The Core Question You’re Answering
“How do I reconstruct the full story of an incident from logs?”
Concepts You Must Understand First
- Event sequencing
- How do you order events across systems?
- Book Reference: “Incident Response & Computer Forensics” Ch. 6 — Luttgens
- Correlation vs causation
- How do you avoid false narratives?
- Book Reference: “Practical Security Monitoring” Ch. 5 — Sanders
Questions to Guide Your Design
- Timeline logic
- How will you resolve time zone differences?
- How will you merge overlapping events?
- Narrative clarity
- How will you label key pivots in the timeline?
Thinking Exercise
Build a Narrative
Take five log entries from different sources. Arrange them into a plausible timeline and explain your reasoning.
The Interview Questions They’ll Ask
- “How do you reconstruct incidents from logs?”
- “How do you handle time zone differences in logs?”
- “What is the risk of false narratives in incident response?”
- “How do you merge logs from multiple sources?”
- “What is the value of a timeline in IR?”
Hints in Layers
Hint 1: Normalize timestamps Choose one time standard and convert everything.
Hint 2: Merge by actor Group events by user or host to reduce noise.
Hint 3: Flag pivots Mark events that change the attack stage.
Hint 4: Validate with evidence Ensure every timeline step has a log record.
Books That Will Help
| Topic | Book | Chapter |
|---|---|---|
| Incident timelines | “Incident Response & Computer Forensics” by Luttgens et al. | Ch. 6 |
| Correlation | “Practical Security Monitoring” by Chris Sanders | Ch. 5 |
| Log evidence | “The Practice of Network Security Monitoring” by Richard Bejtlich | Ch. 8 |
Implementation Hints Narrative clarity is the goal. If a non-technical stakeholder cannot understand the timeline, you need to simplify.
Learning milestones:
- You can merge logs into a coherent sequence
- You can explain why each step follows the previous
- You can defend the timeline as evidence
Common Pitfalls & Debugging
Problem 1: “Timestamps don’t align across log sources”
- Why: Different time zones, clock skew, or timestamp formats
- Fix: Normalize all timestamps to UTC; document known clock skew; use NTP logs to correlate
- Quick test: Events from different sources with same wall-clock time should align in timeline
Problem 2: “Timeline shows causally unrelated events mixed together”
- Why: Merging by time only without entity correlation
- Fix: Group by entity (user, asset, session); create separate timeline threads per actor
- Quick test: Each timeline thread should tell one coherent story
Problem 3: “Missing critical events create gaps in the narrative”
- Why: Incomplete logging or log sources not integrated
- Fix: Mark gaps explicitly in timeline; note missing evidence; explain hypothesis for gap
- Quick test: Timeline should acknowledge “unknown: 09:15-09:23” instead of pretending continuity
Problem 4: “Timeline is too detailed and obscures the attack”
- Why: Including every low-value event instead of filtering
- Fix: Create two views: “executive summary” (pivots only) and “full forensic timeline” (everything)
- Quick test: Executive summary should fit on 1 page with 10-20 key events
Problem 5: “Can’t distinguish causation from coincidence”
- Why: Correlating events by time proximity alone
- Fix: Look for evidence of causation: same session ID, process parent-child, network connection reuse
- Quick test: For each “caused” relationship, can you prove the link beyond timing?
Problem 6: “Timeline conflicts with known facts”
- Why: Log tampering, incorrect normalization, or misinterpretation
- Fix: Cross-reference with external sources (network captures, EDR, memory dumps); validate anomalies
- Quick test: Timeline should reconcile with all available evidence sources
Project Comparison Table
| Project | Difficulty | Time | Depth of Understanding | Fun Factor |
|---|---|---|---|---|
| Audit Trail Inventory & Gap Analyzer | Beginner | Weekend | Medium | Medium |
| Log Schema Normalizer & Field Dictionary | Intermediate | 1-2 weeks | High | Medium |
| High-Value Event Classifier | Intermediate | 1-2 weeks | High | High |
| Anomaly Baseline Builder | Advanced | 1 month+ | Very High | High |
| Correlated Detection Rule Builder | Advanced | 1 month+ | Very High | High |
| Alert Tuning Lab | Intermediate | 1-2 weeks | High | High |
| Audit Log Integrity Chain | Advanced | 1 month+ | Very High | Medium |
| Alert Validation Playbook Builder | Beginner | Weekend | Medium | Medium |
| Detection Coverage Map | Intermediate | 1-2 weeks | High | Medium |
| Incident Reconstruction Timeline Builder | Advanced | 1 month+ | Very High | High |
Recommendation
Start with Project 1: Audit Trail Inventory & Gap Analyzer. It forces you to understand what evidence exists before you build detection logic. Then move to Project 2 to normalize data and Project 3 to prioritize high-value events. These three create the foundation for anomaly detection and tuning.
Final Overall Project: Mini-SIEM for High-Value Events
- File: THREAT_DETECTION_LOGGING_PROJECTS.md
- Main Programming Language: Python
- Alternative Programming Languages: Go, Rust
- Coolness Level: Level 4: Hardcore Tech Flex
- Business Potential: 4. The “Open Core” Infrastructure
- Difficulty: Level 4: Expert
- Knowledge Area: End-to-End Detection Engineering
- Software or Tool: Log pipeline + detection dashboard
- Main Book: “The Practice of Network Security Monitoring” by Richard Bejtlich
What you’ll build: A mini-SIEM pipeline that ingests logs, normalizes them, classifies high-value events, runs correlation rules, and outputs tuned alerts with validation playbooks.
Why it teaches threat detection & logging: This integrates audit trails, normalization, anomaly detection, high-value classification, and alert tuning into a single system.
Core challenges you’ll face:
- Building a full pipeline with consistent schemas
- Ensuring alert quality with tuning feedback
- Demonstrating audit integrity end-to-end
Key Concepts
- End-to-end logging architecture: The Practice of Network Security Monitoring — Bejtlich
- Detection lifecycle: Practical Security Monitoring — Sanders
- Alert tuning: Security Operations Center — Muniz
Difficulty: Expert Time estimate: 1 month+ Prerequisites: Projects 1-10 completed
Summary
You now have a complete learning path for threat detection and logging. Here’s the complete project list:
| # | Project Name | Main Language | Difficulty | Time Estimate |
|---|---|---|---|---|
| 1 | Audit Trail Inventory & Gap Analyzer | Python | Beginner | Weekend |
| 2 | Log Schema Normalizer & Field Dictionary | Python | Intermediate | 1-2 weeks |
| 3 | High-Value Event Classifier | Python | Intermediate | 1-2 weeks |
| 4 | Anomaly Baseline Builder for Authentication Events | Python | Advanced | 1 month+ |
| 5 | Correlated Detection Rule Builder (Multi-Event) | Python | Advanced | 1 month+ |
| 6 | Alert Tuning Lab (Precision vs Recall Simulator) | Python | Intermediate | 1-2 weeks |
| 7 | Audit Log Integrity Chain | Python | Advanced | 1 month+ |
| 8 | Alert Validation Playbook Builder | Markdown | Beginner | Weekend |
| 9 | Detection Coverage Map (Attack-to-Log) | Python | Intermediate | 1-2 weeks |
| 10 | Incident Reconstruction Timeline Builder | Python | Advanced | 1 month+ |
| Final | Mini-SIEM for High-Value Events | Python | Expert | 1 month+ |
Recommended Learning Paths
For SOC Analysts: Start with Projects 3, 6, 8 (immediate pain points) For Detection Engineers: Follow sequential order 1→2→3→9→5→4→6→8→7→10 (engineering workflow) For Incident Responders: Start with Projects 10, 7, 1 (forensics-first) For Security Architects: Start with Projects 1, 9, 7 (requirements and design) For Beginners: Follow sequential order 1→10 (gradual complexity) For SIEM Engineers: Start with Projects 2, 1, 5 (platform internals)
Expected Outcomes
After completing these projects, you will:
- Understand logging fundamentals - Know what to log, how to structure it, and how to ensure integrity
- Build detection logic - Create rules, anomaly baselines, and correlation engines from scratch
- Tune alerts effectively - Balance precision/recall while managing analyst workload
- Reconstruct incidents - Merge multi-source logs into forensic timelines
- Map detection coverage - Identify blind spots using threat modeling frameworks
- Reduce alert fatigue - Apply the same tuning techniques used by elite SOC teams
- Defend evidence - Use cryptographic integrity chains to ensure logs are tamper-proof
- Design logging infrastructure - Make architecture decisions based on detection requirements
This progression takes you from raw audit trails to advanced detection engineering, ensuring you understand both how logging works under the hood and how to turn it into high-confidence alerts.