Static Analysis & Code Quality at Scale
Goal: Deeply understand the mechanics of static analysis—how tools “read” and reason about code without executing it. You will master the transformation pipeline from raw text to Abstract Syntax Trees (AST) and Control Flow Graphs (CFG), implement custom analysis engines for security and quality, and architect enterprise-grade systems that scale these processes across millions of lines of code. By the end, you won’t just use linters; you will build the “automated immune system” for modern software engineering.
Why Static Analysis & Code Quality Matters
In the early days of programming, “quality” was often synonymous with “it didn’t crash during the demo.” As systems grew from thousands to millions of lines of code, manual code review became a bottleneck and human error became a catastrophe.
Static analysis is the practice of analyzing software without executing it. It is the automated immune system of a modern codebase.
The Market Reality (2024-2025)
The static analysis market is experiencing explosive growth:
- Market size: Grew from $1,177 million in 2024 to $1,257 million in 2025, projected to reach $1,446 million by 2031 (Global Growth Insights)
- Enterprise adoption: 85% of organizations prioritize integrating static code analysis tools to enhance code quality and security
- Developer integration: 75% of development teams globally have integrated static analysis into their workflows
- DevSecOps penetration: 72% of DevSecOps pipelines integrate static analysis at the CI stage
- AI-powered analysis: 65% of available solutions now leverage AI and ML for advanced code analysis
Why This Matters
- The Linux kernel (30+ million lines) uses
sparseandsmatchto catch bugs that no human could find by reading. - Vulnerabilities like “Heartbleed” (CVE-2014-0160) or the “Apple Goto Fail” bug could have been caught by relatively simple static analysis rules.
- 2024 CVE statistics: Over 22,254 CVEs were disclosed in the first 7.5 months of 2024 (30% increase year-over-year), yet static analysis tools still miss 22% of vulnerability-causing code due to rule limitations.
- Impact reduction: Early-stage vulnerability detection through static analysis reduces post-release security incidents by 49% and lowers remediation effort by approximately 55%.
- The “Force Multiplier”: In large organizations like Google or Meta, custom static analysis tools save thousands of developer hours daily by catching bugs before they even reach a human reviewer.
Leading Tools in 2025
The market is dominated by several key players (comparison data):
- SonarQube: 19.8% market share (down from 26.5%), excels at comprehensive support and historical trend analysis
- Semgrep: 2.9% market share (up from 1.0%), achieving 82% accuracy with 12% false positive rate, excels at custom policy enforcement
- CodeQL: 88% accuracy with 5% false positive rate, best for GitHub-centric workflows
The reality: Over 68% of enterprise development teams use automated code inspection tools, but they still face challenges: false positive rates affect 41% of users and configuration complexity impacts 37% of teams.
Mastering static analysis makes you the developer who builds the tools that make every other developer better—and it’s a skill the market is desperately demanding.
The Transformation Pipeline: From Text to Truth
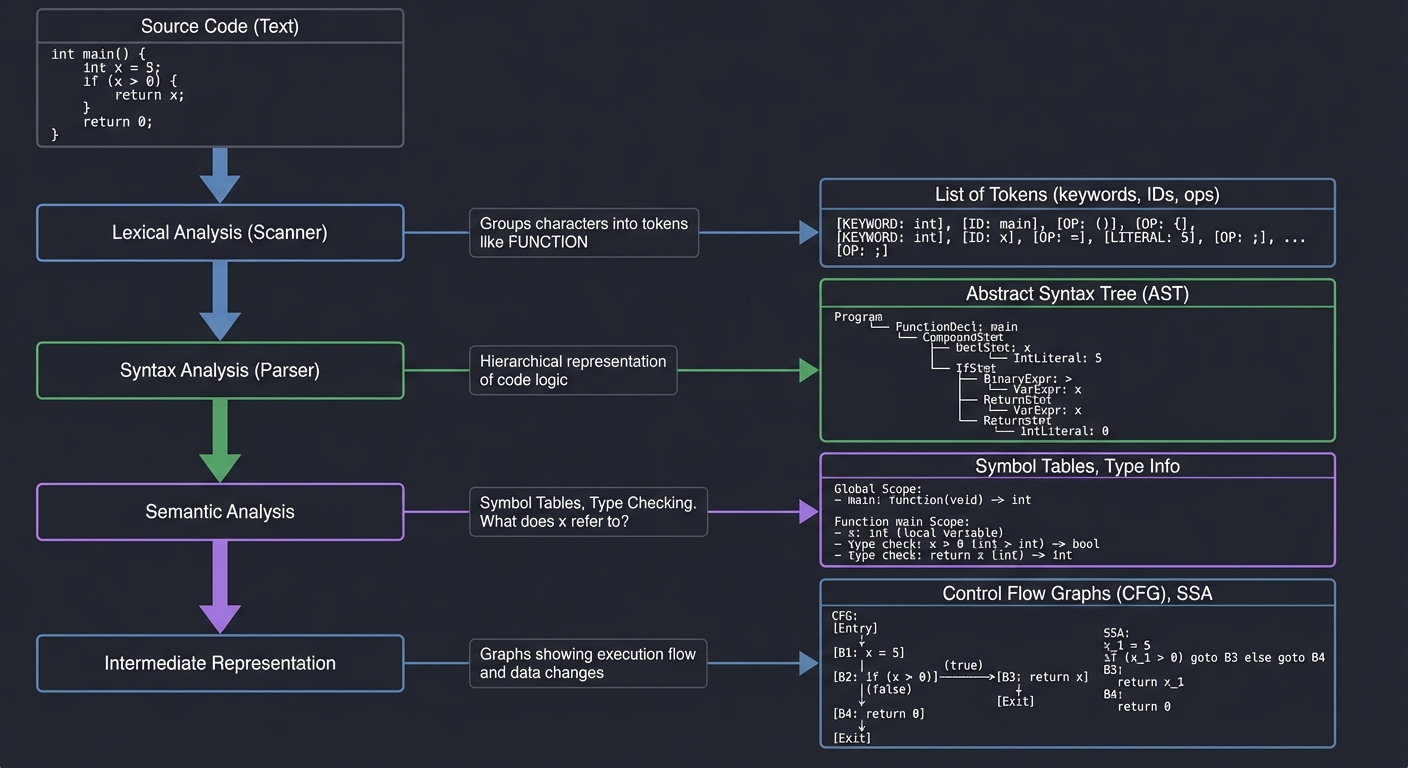
To analyze code, a tool must first understand its structure. This involves several layers of abstraction:
Source Code (Text)
      │
      ▼
[ Lexical Analysis (Scanner) ]  ──▶ List of Tokens (keywords, IDs, ops)
      │  (Groups "f", "u", "n", "c" into a 'FUNCTION' token)
      ▼
[ Syntax Analysis (Parser) ]   ──▶ Abstract Syntax Tree (AST)
      │  (Hierarchical representation of the code logic)
      ▼
[ Semantic Analysis ]          ──▶ Symbol Tables, Type Checking
      │  (What does 'x' refer to? Is it an int or a string?)
      ▼
[ Intermediate Representation ] ──▶ Control Flow Graphs (CFG), SSA
         (Graphs showing how execution moves and how data changes)
1. The Abstract Syntax Tree (AST)
The AST is the most common data structure for static analysis. It represents the hierarchical structure of the source code, stripping away unnecessary details like whitespace and semicolons.
Example: x = 5 + y
      AssignExpr
     /          \
  Var(x)      BinaryExpr(+)
             /             \
          Lit(5)          Var(y)
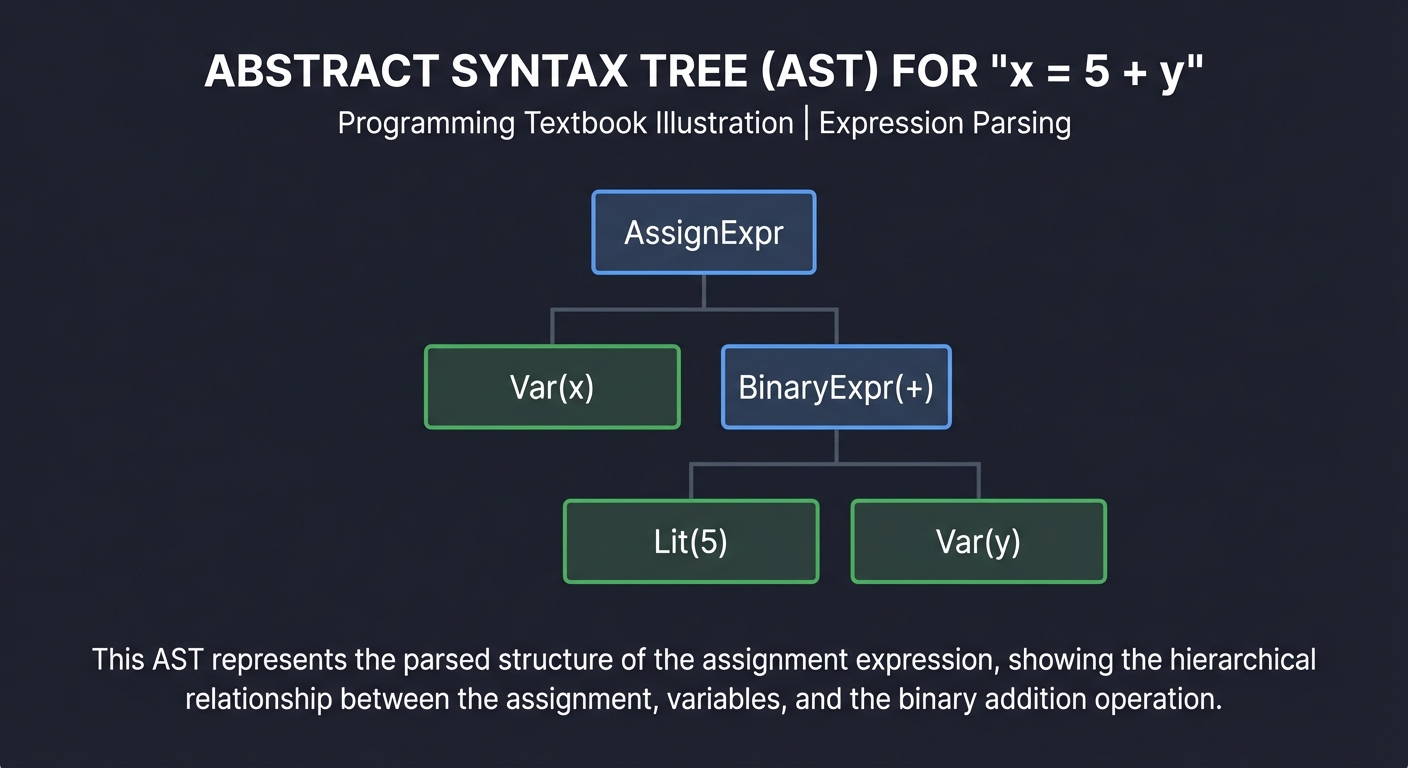
Key Insight: Code is a tree, not a string. When you write a linter rule, you aren’t searching for text; you are searching for specific “Node Patterns” in this tree.
2. Control Flow Graph (CFG)
While an AST shows structure, a CFG shows logic flow. It represents all paths that might be traversed through a program during execution.
       [ Start ]
           │
           ▼
    [ x = get_val() ]
           │
    /──────┴──────\
 [ x > 0 ]      [ x <= 0 ]
    │              │
    ▼              ▼
[ log("pos") ]  [ log("neg") ]
    \──────┬──────/
           ▼
        [ End ]
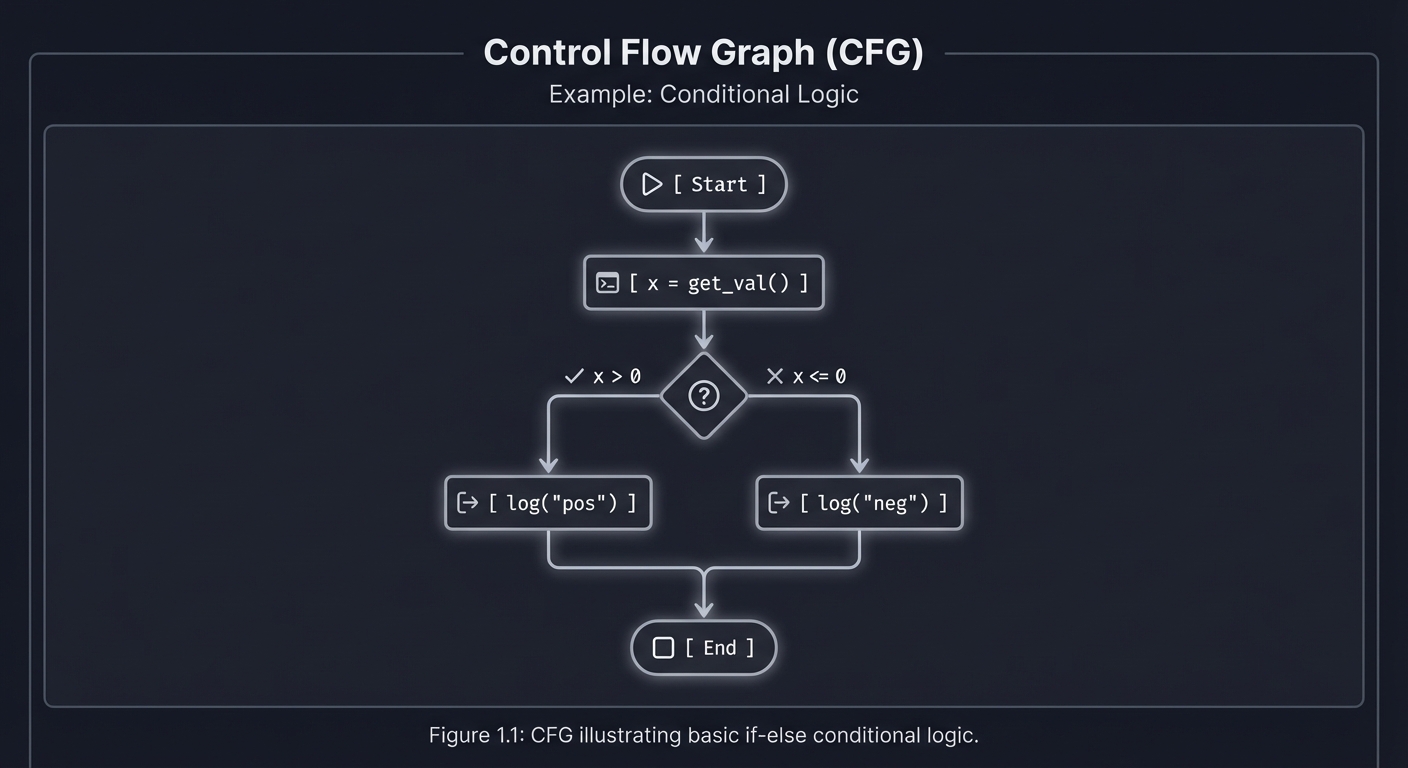
Key Insight: CFGs allow us to answer reachability questions. “Is it possible for execution to reach the ‘Delete Database’ command without passing through the ‘Check Permissions’ check?”
3. Data-Flow Analysis & Taint Tracking
This involves tracking the “state” of data as it moves through the CFG. A classic application is Taint Analysis, used to find security vulnerabilities like SQL Injection.
[ User Input ]  ──▶  [ "Taint" Variable ]  ──▶  [ Transformation ]  ──▶  [ Dangerous Sink ]
(request.param)      (x = input)               (y = x + "...")          (db.execute(y))

        ▲                                                                      ▲
        └───────────────── IF NO SANITIZER FOUND: FLAG AS BUG ─────────────────┘
![]()
Key Insight: Taint tracking proves whether untrusted data from the outside world can ever reach a sensitive part of your system without being cleaned first.
4. Scaling: The Analysis Infrastructure
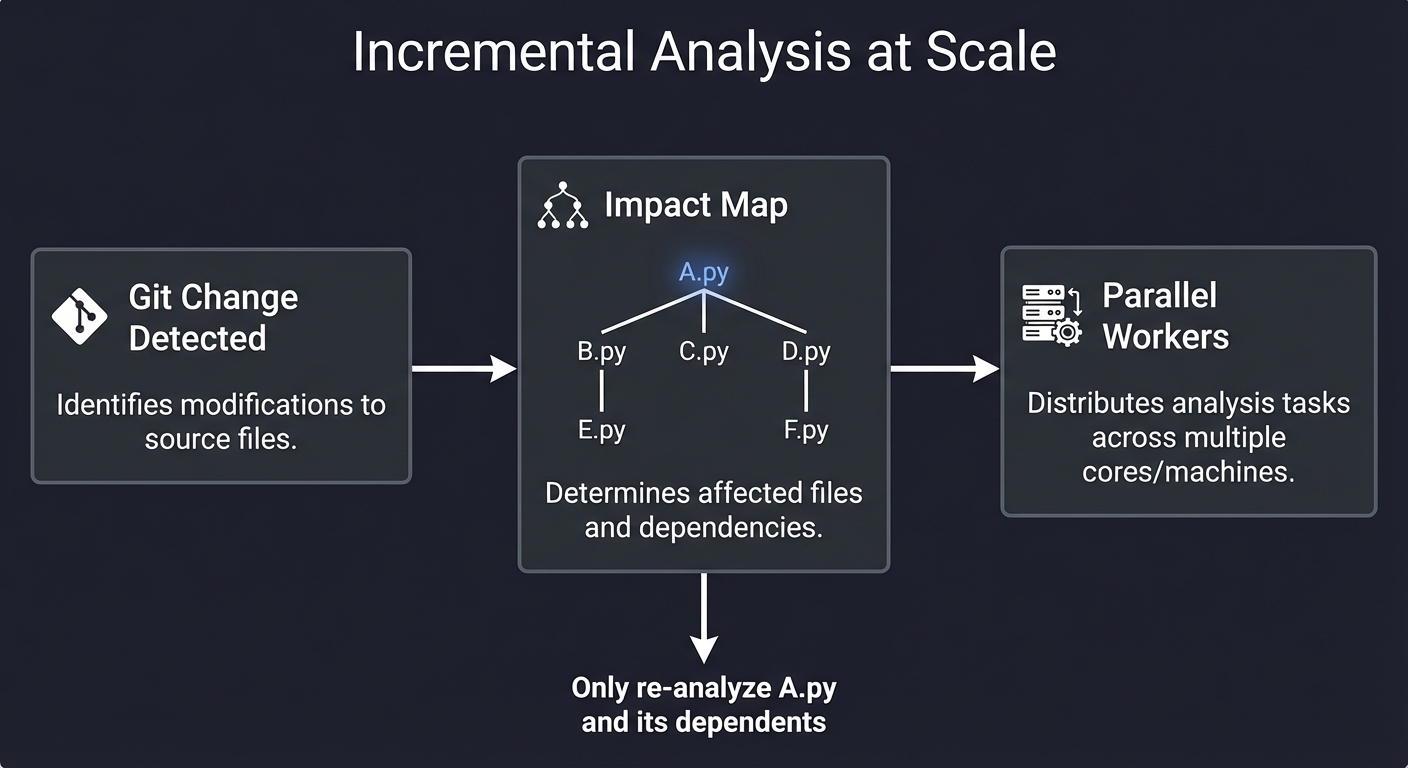
When you have 10,000 repositories, you can’t run a full scan every time. You need Incremental Analysis.
┌─────────────────┐      ┌─────────────┐      ┌──────────────────┐
│ Git Change Detected │ ──▶ │ Impact Map  │ ──▶ │ Parallel Workers │
└─────────────────┘      └──────┬──────┘      └──────────────────┘
                                │
                        "Only re-analyze A.py
                         and its dependents"
Concept Summary Table
| Concept Cluster | What You Need to Internalize |
|---|---|
| Parsing & ASTs | Code is a tree. You must learn to traverse (Visitor Pattern) and query (XPath-like) this tree. |
| Control Flow | Graphs of basic blocks. Essential for understanding “how” a program runs vs “what” it says. |
| Data-Flow Analysis | Tracking the “value” or “state” of variables through the program. Reaching definitions and SSA. |
| Taint & Security | Identifying Sources (untrusted input) and Sinks (dangerous functions) and proving connectivity. |
| Code Transformation | “Codemods.” Not just reading code, but programmatically rewriting it while preserving comments/format. |
| Analysis at Scale | Caching, incremental analysis, and distributed worker pools for enterprise codebases. |
Deep Dive Reading by Concept
Foundational Theory (The Mechanics)
| Concept | Book & Chapter |
|---|---|
| Parsing & AST Construction | “Engineering a Compiler” by Cooper & Torczon — Ch. 3: “Parsers” |
| Lexical Analysis | “Compilers: Principles, Techniques, and Tools” (Dragon Book) — Ch. 3: “Lexical Analysis” |
| Control Flow Analysis | “Compilers: Principles and Practice” by Dave — Ch. 8: “Code Optimization” |
| Data-Flow Frameworks | “Computer Systems: A Programmer’s Perspective” — Ch. 5.7: “Understanding Modern Processors” (Basic logic flow) |
Static Analysis for Quality & Security
| Concept | Book & Chapter |
|---|---|
| Refactoring at Scale | “Refactoring” by Martin Fowler — Ch. 1-4: “The Principles of Refactoring” |
| Bug Finding Patterns | “Code Complete” by Steve McConnell — Ch. 24: “Refactoring” & Ch. 22: “Developer Testing” |
| Taint Analysis | “Secure Coding in C and C++” by Robert Seacord — Ch. 2: “Strings” (Understanding sinks) |
| Binary Analysis | “Practical Binary Analysis” by Dennis Andriesse — Ch. 12: “Control-Flow Analysis” |
Systems & Scaling
| Concept | Book & Chapter |
|---|---|
| Caching & Data Pipelines | “Designing Data-Intensive Applications” by Martin Kleppmann — Ch. 10: “Batch Processing” |
| Concurrency for Analysis | “The Art of Multiprocessor Programming” by Herlihy & Shavit — Ch. 1: “Introduction” |
| Dependency Graphs | “Algorithms, 4th Edition” by Sedgewick & Wayne — Ch. 4: “Graphs” |
Essential Reading Order
- The Basics (Week 1):
- Engineering a Compiler Ch. 3 (Understanding ASTs)
- Code Complete Ch. 19 (Control Flow Complexity)
- The Security Lens (Week 2):
- Dragon Book Ch. 12 (Data-Flow Analysis)
- Read about the “Visitor Pattern” in Design Patterns (Gamma et al.)
- Enterprise Scaling (Week 3):
- Designing Data-Intensive Applications Ch. 10 (Scaling the processing)
Prerequisites & Background Knowledge
Essential Prerequisites (Must Have)
1. Programming Fundamentals
- Proficiency in at least one language (Python, JavaScript, Go, or Java)
- Understanding of basic data structures (trees, graphs, hash tables)
- Comfort reading and understanding code you didn’t write
2. Computer Science Basics
- Basic understanding of how compilers work (lexing, parsing)
- Familiarity with recursion and tree traversal
- Understanding of graphs and graph algorithms (DFS/BFS)
3. Development Tools
- Git and version control basics
- Command-line proficiency
- Text editor/IDE familiarity
Helpful But Not Required
1. Advanced CS Topics (you’ll learn these through the projects)
- Compiler construction and optimization
- Formal language theory
- Type systems and semantics
- Distributed systems design
2. Security Knowledge (you’ll develop this)
- Common vulnerability patterns (SQL injection, XSS)
- Cryptographic concepts
- Security best practices
3. Enterprise Tools (you’ll implement alternatives)
- Experience with SonarQube, ESLint, or similar tools
- CI/CD pipeline configuration
- Docker and containerization
Self-Assessment Questions
Before starting, you should be able to answer “yes” to these questions:
Programming Competency:
- Can you write a recursive function to traverse a directory tree?
- Do you understand the difference between a string and a reference to a string?
- Can you read stack traces and debug runtime errors?
- Do you know what a hash table is and when to use one?
Conceptual Readiness:
- Do you know what an Abstract Syntax Tree (AST) is conceptually?
- Can you explain the difference between compile-time and runtime?
- Do you understand what “parsing” means?
- Can you describe what a graph is and give examples of graph algorithms?
If you answered “no” to any programming questions, spend 1-2 weeks reviewing:
- “Algorithms” by Sedgewick & Wayne (Ch. 1-4)
- “Fluent Python” Ch. 1-7 (if using Python)
If you answered “no” to conceptual questions, that’s okay! The early projects will teach you these concepts. Just expect to spend extra time on research.
Development Environment Setup
Required Tools:
- Python 3.9+ (Primary language for Projects 1-4, 7, 10)
python3 --version # Should be 3.9 or higher pip install ast-explorer networkx graphviz - Node.js 16+ (For Project 6 and 9)
node --version # Should be 16 or higher npm install -g jscodeshift @vscode/language-server-protocol - Go 1.18+ (For Projects 8, 10, 11)
go version # Should be 1.18 or higher - Git (For Projects 4, 10, 11)
git --version
Recommended Tools:
- VS Code with Python, Go, and ESLint extensions
- AST Explorer (online at astexplorer.net for visualizing ASTs)
- Graphviz for dependency graph visualization
- Docker (for Project 11)
- Redis (for Project 11 caching)
Optional but Helpful:
- Jupyter Notebook for experimenting with AST manipulation
treecommand for visualizing directory structuresjqfor working with JSON analysis results
Time Investment
Per-Project Estimates:
- Beginner projects (1-2, 4): 8-16 hours each (1-2 weekends)
- Intermediate projects (3, 5, 6, 8, 10): 20-40 hours each (1-2 weeks part-time)
- Advanced projects (7, 9): 40-80 hours each (2-4 weeks part-time)
- Capstone project (11): 80-160 hours (1-2 months part-time)
Total journey: 4-6 months if working 10 hours/week
Realistic expectations:
- You’ll spend 30% of your time stuck on bugs
- You’ll spend 20% of your time reading documentation
- You’ll spend 50% of your time actually implementing
This is normal and part of the learning process.
Important Reality Check
This learning path is HARD. You will:
❌ Get stuck on concepts that seem simple in theory but are complex in practice ❌ Debug obscure issues with AST node types and graph traversals ❌ Question your understanding of “simple” concepts like variable scope ❌ Rewrite code multiple times before it works correctly
✅ But you will also:
✅ Build tools that professional developers would pay for ✅ Understand codebases at a level most developers never reach ✅ Gain skills that are in extremely high demand (remember: 85% of companies are investing in this) ✅ Join the 1% of developers who can build the infrastructure, not just use it
The payoff: After completing these projects, you’ll be able to:
- Build custom analysis tools for your team’s specific needs
- Contribute to major open-source static analysis projects
- Interview confidently for roles at companies building developer tools
- Command higher salaries due to rare, specialized skills
Quick Start Guide (For Overwhelmed Learners)
Feeling overwhelmed by the scope? Start here.
Your First 48 Hours
Saturday Morning (3 hours): Understanding the Foundation
- Install Python and run this 10-line script to see your first AST:
import ast code = "x = 5 + 3" tree = ast.parse(code) print(ast.dump(tree, indent=2)) - Play with AST Explorer: Go to https://astexplorer.net
- Select “Python” as language
- Type:
def hello(name): return f"Hello {name}" - Explore the tree structure on the right
- Read: “Engineering a Compiler” Ch. 3 (just the introduction, pages 1-10)
Saturday Afternoon (2 hours): Your First Tool
Start Project 1 (Naming Sheriff) but ONLY implement:
- A function that takes a string of code
- Parses it with
ast.parse() - Finds all
ClassDefnodes - Prints their names
That’s it. You’ve built your first static analysis tool.
Sunday (4 hours): Make It Real
Extend your Saturday code to:
- Walk an entire directory of Python files
- Check if class names are PascalCase
- Print violations
You now have a working linter.
Week 1 Goals
By the end of week 1, you should have:
- ✅ Completed Project 1 (Naming Sheriff)
- ✅ Understood what an AST is and how to traverse it
- ✅ Written a tool that runs on real code
Don’t worry about:
- Understanding control flow graphs (that’s week 2-3)
- Building enterprise-scale tools (that’s month 2-3)
- Optimizing performance (premature optimization is the root of all evil)
If You’re Still Stuck After Week 1
Red flags:
- “I don’t understand what a node is” → Go back to astexplorer.net, play more
- “My code doesn’t run” → Share your error in a programming community
- “This seems impossible” → You’re right where you should be. Impossible becomes possible with practice.
Green flags:
- “I got it working but my code is ugly” → Perfect! Ugly working code beats perfect non-existent code.
- “I don’t understand WHY this works” → Great question! That understanding comes from building more.
- “I want to add more features” → Excellent! But finish the project first.
The 80/20 Rule for This Learning Path
20% of the concepts give you 80% of the capability:
- AST traversal (Project 1) → Unlocks all analysis
- Control flow graphs (Project 2) → Unlocks complexity analysis
- Call graphs (Project 3) → Unlocks reachability analysis
- Caching (Project 8) → Unlocks performance at scale
Master these four concepts, and you can build 80% of static analysis tools.
Recommended Learning Paths
Choose your path based on your background and goals.
Path 1: “The Security Engineer” (3-4 months)
Background: You’re a developer who wants to move into security/AppSec Goal: Build tools that find vulnerabilities automatically
Project Sequence:
- Project 1 (Naming Sheriff) - Learn AST basics
- Project 4 (Secret Sentry) - Learn pattern matching and entropy
- Project 7 (Taint Tracker) - Learn data-flow analysis
- Project 10 (PR Analyzer) - Learn to integrate into developer workflows
- Project 11 (Unified Platform) - Build a security scanning platform
Focus Areas:
- OWASP Top 10 vulnerabilities
- Taint analysis and data-flow tracking
- False positive reduction
- Integration with security workflows
Career Outcome: Application Security Engineer, Security Tools Developer
Path 2: “The Infrastructure Builder” (4-5 months)
Background: You’re a backend/DevOps engineer who wants to scale tools Goal: Build high-performance, distributed analysis systems
Project Sequence:
- Project 1 (Naming Sheriff) - Learn basics
- Project 5 (Arch Grapher) - Learn dependency analysis
- Project 8 (Scaling Runner) - Learn orchestration and caching
- Project 9 (Mini-LSP) - Learn real-time analysis
- Project 11 (Unified Platform) - Build enterprise infrastructure
Focus Areas:
- Incremental analysis and caching
- Worker pools and parallelization
- Distributed systems patterns
- Performance optimization
Career Outcome: Developer Tools Engineer, Platform Engineer
Path 3: “The Language Designer” (5-6 months)
Background: You’re fascinated by programming languages and compilers Goal: Build tools that deeply understand code semantics
Project Sequence:
- Project 1 (Naming Sheriff) - Learn AST basics
- Project 2 (Complexity Mapper) - Learn control flow
- Project 3 (Ghost Hunter) - Learn symbol tables and call graphs
- Project 6 (Auto Refactorer) - Learn code transformation
- Project 7 (Taint Tracker) - Learn data-flow analysis
- Project 9 (Mini-LSP) - Build a language server
Focus Areas:
- Compiler theory and optimization
- Semantic analysis
- Type systems
- Language server protocol
Career Outcome: Compiler Engineer, Language Tools Developer, IDE Developer
Path 4: “The Pragmatic Developer” (2-3 months)
Background: You just want practical tools for your team Goal: Build tools that improve your team’s code quality today
Project Sequence:
- Project 1 (Naming Sheriff) - Enforce style
- Project 2 (Complexity Mapper) - Find hard-to-maintain code
- Project 4 (Secret Sentry) - Prevent credential leaks
- Project 10 (PR Analyzer) - Automate code review
- (Optional) Project 5 (Arch Grapher) - Visualize dependencies
Focus Areas:
- Quick wins and visible impact
- Integration with existing workflows
- Team adoption and change management
- Reducing technical debt
Career Outcome: Better code quality in your current role, potential promotion to Tech Lead
Path 5: “The Academic/Researcher” (6+ months)
Background: You’re interested in the theoretical foundations Goal: Publish research or contribute to academic tools
Project Sequence: Do all projects in order, but spend extra time on:
- Project 6 (Auto Refactorer) - Study program transformation theory
- Project 7 (Taint Tracker) - Study formal verification
- Project 9 (Mini-LSP) - Study language semantics
- Add custom extensions exploring novel analysis techniques
Focus Areas:
- Formal methods and verification
- Novel analysis algorithms
- Soundness and completeness
- Research paper implementation
Career Outcome: Research Scientist, PhD preparation, Academic positions
No Matter Your Path, Start Here:
Everyone begins with Project 1. It’s the foundation. You cannot skip it.
After Project 1, choose your path and follow the sequence. Each path is designed to build knowledge incrementally while focusing on your specific goals.
Pro tip: If you’re unsure which path to choose, start with Path 4 (Pragmatic). You’ll build useful tools quickly and can always pivot to a different path later.
Project List
Projects are ordered from fundamental understanding to advanced implementations.
Project 1: Naming Sheriff
- File: STATIC_ANALYSIS_CODE_QUALITY_AT_SCALE.md
- Main Programming Language: Python
- Alternative Programming Languages: JavaScript (using Babel), Go (using
go/ast) - Knowledge Area: AST Traversal / Linting
- Software or Tool: Python
astmodule
What you’ll build: A CLI tool that parses source code and enforces strict naming conventions (e.g., classes must be PascalCase, variables must be snake_case) by traversing the Abstract Syntax Tree.
Real World Outcome
When you run this tool against a directory of code, it will output a detailed report of naming violations. It doesn’t just “grep” for text; it knows exactly what is a variable, what is a class, and what is a function because it’s looking at the tree structure.
$ python naming_sheriff.py ./my_project/

[VIOLATION] src/auth.py:12:4  -> Variable 'UserName' should be snake_case (user_name)
[VIOLATION] src/auth.py:45:0  -> Class 'fetch_user' should be PascalCase (FetchUser)
[VIOLATION] src/utils.py:8:12 -> Function 'ProcessData' should be snake_case (process_data)

[SUMMARY]
Files Scanned: 14
Nodes Inspected: 1,245
Violations Found: 3
You can even integrate this into a pre-commit hook to prevent developers from committing “ugly” code.
The Core Question You’re Answering
“How can I programmatically reason about the structure of code without executing it?”
Before you write code, realize that print("x") and x = 5 look like text to a regex, but they are completely different “Node Types” to an AST. One is a function call; the other is an assignment.
Concepts You Must Understand First
Stop and research these before coding:
- Tokens vs Nodes
- What is the difference between a raw “Token” (lexical level) and an AST “Node” (syntactic level)?
- Book Reference: “Engineering a Compiler” Ch. 2-3
- The Visitor Pattern
- Why do we use a visitor instead of a standard
forloop to walk a tree? - What are the
visit_methods in Python’sast.NodeVisitor? - Book Reference: “Design Patterns” (Gamma et al.) - Behavioral Patterns
- Why do we use a visitor instead of a standard
- Node Context (
node.ctx)- Why does a variable name look the same in
x = 1andy = xbut have different “Contexts”? - What is
ast.Storevsast.Load?
- Why does a variable name look the same in
- Lexical Scoping
- How does the AST tell you if a variable is global or local to a function?
Questions to Guide Your Design
Before implementing, think through these:
- Rule Definition
- How will you define what “PascalCase” means? (Regex? String methods?)
- Will you allow exceptions (e.g.,
CAPITAL_SNAKE_CASEfor constants)?
- Reporting
- How do you get the line number and column offset from an AST node? (Hint:
node.lineno) - How do you handle multi-line assignments?
- How do you get the line number and column offset from an AST node? (Hint:
- Recursive Traversal
- What happens when a class contains a function, which contains a variable? Does your visitor handle the nesting automatically?
Thinking Exercise
Trace the Tree By Hand
Look at this snippet:
class user_data:
    def GetName(self):
        User_ID = 1
        return User_ID
Questions while tracing:
- List every node that
Naming Sheriffshould flag. - What is the “Type” of the node for
user_data? (ClassDef) - Is
User_IDat line 4 aNameor aAttribute?
The Interview Questions They’ll Ask
- “Explain the difference between a Concrete Syntax Tree (CST) and an Abstract Syntax Tree (AST).”
- “How does a linter differ from a formatter like Black or Prettier?”
- “Why is
ast.NodeVisitormore efficient than a manual recursive search?” - “What are the performance implications of parsing 10,000 files into ASTs?”
Hints in Layers
Hint 1: Start with ast.dump
Parse a small string and print the dump: print(ast.dump(ast.parse("x = 1"))). This reveals the structure of the Assign and Name nodes.
Hint 2: Subclass the Visitor
class Sheriff(ast.NodeVisitor):
    def visit_ClassDef(self, node):
        # Check node.name here
        self.generic_visit(node) # Don't forget to keep traversing!
Hint 3: Handling Variables
Variable names are usually in ast.Name nodes. But be careful: you only want to check ast.Name nodes where isinstance(node.ctx, ast.Store).
Books That Will Help
| Topic | Book | Chapter |
|---|---|---|
| Parsing Theory | “Engineering a Compiler” | Ch. 3 |
| AST Traversal | “Crafting Interpreters” | Ch. 5 |
| Python AST internals | “Expert Python Programming” | Ch. 14 |
Common Pitfalls & Debugging
Problem 1: “AttributeError: ‘Name’ object has no attribute ‘id’“
- Why: In Python 3.9+, the AST structure changed.
node.idbecamenode.namefor some node types. - Fix: Check your Python version and consult the official
astmodule documentation for your version. - Quick test:
python3 --versionthen search “Python 3.X ast changes”
Problem 2: “My visitor isn’t visiting nested classes”
- Why: You forgot to call
self.generic_visit(node)at the end of yourvisit_ClassDefmethod. - Fix: Always call
generic_visit()to continue traversing child nodes:def visit_ClassDef(self, node): # Your logic here self.generic_visit(node) # Don't forget this! - Quick test: Add a class inside a class and verify both are checked.
Problem 3: “It flags variables even when they’re correctly named”
- Why: You’re checking all
ast.Namenodes, including those inLoadcontext (reading a variable). You should only checkStorecontext (assignment). - Fix: Add a context check:
if isinstance(node.ctx, ast.Store): # Only check variable names on assignment - Quick test:
x = good_nameshould NOT flagxon the right side elsewhere.
Problem 4: “UnicodeDecodeError when reading files”
- Why: Some files in your codebase might not be UTF-8 encoded.
- Fix: Open files with error handling:
with open(filepath, 'r', encoding='utf-8', errors='ignore') as f: content = f.read() - Quick test: Try running on a file with non-ASCII characters.
Problem 5: “SyntaxError: invalid syntax” when parsing valid Python”
- Why: Your Python version doesn’t support newer syntax (like
:=walrus operator ormatch/case). - Fix: Either upgrade Python or skip files with syntax errors using try/except:
try: tree = ast.parse(content) except SyntaxError: print(f"Skipping {filepath} - syntax not supported") - Quick test: Parse a file with
if (x := 5):syntax.
Project 2: Complexity Mapper
- File: STATIC_ANALYSIS_CODE_QUALITY_AT_SCALE.md
- Main Programming Language: Python
- Knowledge Area: Graph Theory / Code Metrics
- Software or Tool: Python
ast
What you’ll build: A tool that calculates the Cyclomatic Complexity of every function in a project and generates a “Heatmap” report of the hardest-to-maintain files.
Real World Outcome
A risk report that ranks every function by its “Brain Load.” This is a tool you can use to tell a manager: “We shouldn’t add more features to process_payment.py until we refactor it; it has a complexity score of 42.”
$ python complexity_mapper.py ./src/

FILE: src/logic.py
  [CRITICAL] calculate_tax() -> Complexity: 24 (Too many nested branches)
  [OK]       get_total()     -> Complexity: 3

FILE: src/db.py
  [MODERATE] connect()       -> Complexity: 12 (Try/Except heavy)

[PROJECT SUMMARY]
High Risk Functions: 4
Average Complexity: 6.2
The Core Question You’re Answering
“How do we measure ‘brain load’? Is there a mathematical way to say this code is hard to read?”
Cyclomatic complexity isn’t about length; it’s about the number of paths through the code. A 100-line function with no branches is simpler than a 10-line function with 5 nested if statements.
Concepts You Must Understand First
Stop and research these before coding:
- The McCabe Metric
- What is the formula $M = E - N + 2P$?
- How does this simplify to “Number of decision points + 1”?
- Book Reference: “Code Complete” Ch. 19
- Decision Nodes
- Which AST nodes represent a branch in execution? (Hint:
If,While,For,Try,BoolOp). - Does an
elifcount as a separate branch? (Yes, it’s a nestedIf).
- Which AST nodes represent a branch in execution? (Hint:
- Control Flow Graphs (CFG)
- How can you visualize a function as a directed graph?
Questions to Guide Your Design
Before implementing, think through these:
- Short-Circuiting Logic
- If a line says
if a and b:, is that 1 path or 2? (Hint:andis a branch). - How will you handle
Match/Casestatements?
- If a line says
- Aggregation
- How do you calculate the complexity of a whole file? (Sum of functions? Average?)
- Thresholds
- At what number should your tool start shouting “CRITICAL”? (Industry standard is often 10 or 15).
Thinking Exercise
Manual Complexity Count
Calculate the complexity of this function:
def check(val):
    if val > 10:
        if val < 20 or val == 25:
            return "mid"
        else:
            return "high"
    return "low"
Questions:
- How many
Ifnodes? - How many
BoolOp(or/and) nodes? - Total Complexity Score? (Nodes + 1).
The Interview Questions They’ll Ask
- “What are the limitations of Cyclomatic Complexity? Does it account for ‘Cognitive Complexity’ (nesting depth)?”
- “How would you use complexity metrics to prioritize unit testing?”
- “If a function has high complexity, does it always mean it’s bad code?”
- “Explain how you would handle ‘Async/Await’ in your complexity calculation.”
Hints in Layers
Hint 1: The Decision List
Maintain a list of “Branching Node Types”: ast.If, ast.While, ast.For, ast.AsyncFor, ast.Try, ast.ExceptHandler, ast.With.
Hint 2: Deep Dive into BoolOp
The ast.BoolOp node (like a and b) contains multiple values. Each value beyond the first represents a decision point.
Hint 3: Resetting State
In your visitor, you need a way to track which function you are currently in. Use visit_FunctionDef to increment a “current function complexity” counter.
Books That Will Help
| Topic | Book | Chapter |
|---|---|---|
| Software Metrics | “Code Complete” | Ch. 19 |
| Control Flow | “Engineering a Compiler” | Ch. 5 |
| Code Quality | “Clean Code” | Ch. 3 (Functions) |
Common Pitfalls & Debugging
Problem 1: “Boolean operators (and, or) aren’t being counted”
- Why:
BoolOpnodes contain a list of values. You need to count each additional value beyond the first. - Fix: For
ast.BoolOp, addlen(node.values) - 1to complexity:def visit_BoolOp(self, node): self.complexity += len(node.values) - 1 - Quick test:
if a and b and c:should add 2 to complexity.
Problem 2: “List comprehensions show zero complexity”
- Why: Comprehensions are separate scopes. You need to visit them explicitly.
- Fix: Add visitors for
ListComp,DictComp,SetComp,GeneratorExp. - Quick test:
[x for x in range(10) if x > 5]should count theifas +1.
Problem 3: “Complexity resets between functions in a file”
- Why: You’re not tracking which function you’re in. You need function-level state.
- Fix: Use a dictionary to map function names to complexity:
self.function_complexity = {} self.current_function = None def visit_FunctionDef(self, node): self.current_function = node.name self.function_complexity[node.name] = 1 # Start at 1 - Quick test: Multiple functions should each have their own complexity score.
Problem 4: “Try/Except blocks not counted correctly”
- Why: Each exception handler is a separate branch. You need to count
ExceptHandlernodes. - Fix: Add
visit_ExceptHandlerthat increments complexity. - Quick test:
try...except A...except B:should add 2 to complexity.
Problem 5: “Match/Case statements crash the analyzer”
- Why: Python 3.10+
matchstatements useMatchandmatch_casenodes. - Fix: Add support for
Matchnodes or catch the exception:def visit_Match(self, node): self.complexity += len(node.cases) - Quick test: Use Python 3.10+ and parse a match statement.
Project 3: The Ghost Hunter (Dead Code)
- File: STATIC_ANALYSIS_CODE_QUALITY_AT_SCALE.md
- Main Programming Language: Python
- Knowledge Area: Reachability Analysis / Call Graphs
- Software or Tool: Python
ast, Symbol Tables
What you’ll build: A tool that identifies unused imports, unused local variables, and “dead” functions that are never called from the entry point of the program.
Real World Outcome
You will generate a “Clean Up List” for your codebase. This isn’t just about single files; it’s about finding functions that might have been useful 2 years ago but are now just “ghosts” taking up space and confusing new developers.
$ python ghost_hunter.py ./src/

[UNUSED IMPORT]   utils.py: 'os' imported but never used.
[UNUSED VARIABLE] logic.py:88 -> 'temp_id' is assigned but never read.
[DEAD FUNCTION]   api.py:   'get_legacy_token()' is never called from any entry point.

[SAVINGS REPORT]
Files Cleaned: 8
Potential Lines Deleted: 450
Technical Debt Reduced: High
The Core Question You’re Answering
“How do we prove that a piece of code is unreachable?”
In a small script, it’s easy. In a 100-file project, finding a function that is never called (even indirectly) requires building a Call Graph. You are answering: “If I start at main(), which nodes in my project are never visited?”
Concepts You Must Understand First
Stop and research these before coding:
- The Call Graph
- What is a Call Graph? How is it different from an AST?
- What are nodes and edges in a Call Graph?
- Book Reference: “Compilers: Principles and Practice” Ch. 8
- Symbol Tables
- How do you keep track of where a variable is defined vs where it is used?
- Book Reference: “Engineering a Compiler” Ch. 4
- Entry Points
- What are the “Roots” of your program? (e.g.,
if __name__ == "__main__":blocks, API controllers, etc.)
- What are the “Roots” of your program? (e.g.,
- Reachability (DFS/BFS)
- Once you have a graph, how do you find the “Islands” (nodes with no path from the root)?
Questions to Guide Your Design
Before implementing, think through these:
- Global vs Local
- How will you distinguish between a variable used inside a function and a global variable used across files?
- Dynamic Calling
- What happens if your code uses
getattr(obj, "func_name")()? How can static analysis find that? (Hint: It often can’t—this is a “False Positive” risk).
- What happens if your code uses
- External Exports
- If you are building a library, some functions are meant to be called by others. How do you mark these as “Alive” even if they aren’t called inside your own code?
Thinking Exercise
Map the Island
Draw a graph for these 3 files:
main.py: callsutils.calculate()utils.py: definescalculate()andformat_date().calculate()callsmath.sqrt().legacy.py: definesold_logic().
Questions:
- Which function is a “Ghost”?
- What is the root of your graph?
- If
format_date()is used in a test file, is it still a ghost?
The Interview Questions They’ll Ask
- “What is the difference between ‘Dead Code’ and ‘Unreachable Code’?”
- “How does a compiler perform ‘Dead Code Elimination’ (DCE)?”
- “Explain the ‘Halting Problem’ and why static analysis can never be 100% perfect at finding dead code.”
- “How do you handle ‘Reflection’ or ‘Dynamic Dispatch’ in a call graph?”
Hints in Layers
Hint 1: Local Variables First
Start by finding unused local variables. For every ast.Name where ctx is Store, add it to a “Defined” set. For every ast.Name where ctx is Load, add it to a “Used” set. The difference is your unused list.
Hint 2: Building the Call Graph
Use ast.Call nodes to find edges. If FunctionDef A contains an ast.Call to B, add an edge A -> B.
Hint 3: The Root Set
Define your “Roots” (e.g., all functions in main.py). Use a simple Graph Traversal (DFS) to mark every function reachable from the roots.
Books That Will Help
| Topic | Book | Chapter |
|---|---|---|
| Call Graphs | “Compilers: Principles and Practice” | Ch. 8 |
| Symbol Tables | “Engineering a Compiler” | Ch. 4 |
| Graph Algorithms | “Grokking Algorithms” | Ch. 6-7 |
Project 4: Secret Sentry
- File: STATIC_ANALYSIS_CODE_QUALITY_AT_SCALE.md
- Main Programming Language: Go or Python
- Knowledge Area: Security / Regex / Shannon Entropy
- Software or Tool:
gitintegration, Regex engines
What you’ll build: A high-performance scanner that prevents AWS keys, database passwords, and private tokens from being committed to Git. It uses both high-fidelity regex and entropy calculation (to find random-looking strings).
Real World Outcome
A Git hook that stops a commit in its tracks if it detects a secret. This is a critical security tool that protects your company from “The Credential Leak” that leads to data breaches.
$ git commit -m "add database config"

[SECRET SENTRY] Scanning commit...
[BLOCK] Found high-entropy string in config.py: "AKIAJ2E..." (Looks like AWS Key)
[BLOCK] Found match in .env: "DB_PASSWORD=secret123"

[ERROR] Commit aborted. Please remove secrets or add to .sentryignore
The Core Question You’re Answering
“How can we mathematically distinguish between a normal string and a cryptographic key?”
Passwords and keys don’t look like English. They are high-entropy (random). You are answering: “Does this string look too ‘random’ to be a variable name?”
Concepts You Must Understand First
Stop and research these before coding:
- Shannon Entropy
- What is the mathematical definition of entropy in information theory?
- Why do passwords have higher entropy than the word “password”?
- Book Reference: “Math for Security” Ch. 3
- Regex Precision
- How do you write a regex that matches an AWS Key but not a random GUID?
- What are “Negative Lookaheads”?
- Git Hooks
- How does the
.git/hooks/pre-commitscript work?
- How does the
- False Positives vs False Negatives
- Why is it better to block a safe string than to let a real key leak? (Recall vs Precision).
Questions to Guide Your Design
Before implementing, think through these:
- Performance
- If a commit has 1,000 files, how do you scan it in under 500ms? (Hint: Only scan the
git diff).
- If a commit has 1,000 files, how do you scan it in under 500ms? (Hint: Only scan the
- Validation
- Should you try to “verify” the key by calling the AWS API? (Pros/Cons: Privacy vs Accuracy).
- Exclusion
- How will developers tell the tool “Yes, this looks like a key, but it’s just a test string”?
Thinking Exercise
Calculate Entropy
Compare these three strings:
password123AKIAJ2E3D4F5G6H7I8J9correct_horse_battery_staple
Questions:
- Which has the most unique characters?
- Which would your tool flag?
- If you see
database_url = "...", should you check the variable name or the string content?
The Interview Questions They’ll Ask
- “Explain the concept of Shannon Entropy in the context of security scanning.”
- “How do you minimize false positives when scanning for secrets?”
- “Why use entropy instead of just a list of keywords like ‘API_KEY’?”
- “How would you handle large binary files in a git-based scanner?”
Hints in Layers
Hint 1: The Entropy Formula
import math
def entropy(string):
    prob = [float(string.count(c)) / len(string) for c in dict.fromkeys(list(string))]
    return - sum([p * math.log(p) / math.log(2.0) for p in prob])
(A typical AWS key has an entropy > 4.5).
Hint 2: Git Diff Scanning
Use git diff --cached to get the content of the files about to be committed. Don’t scan the whole repository every time.
Hint 3: High-Fidelity Regex
Use a library of existing regex patterns (like gitleaks configurations) to catch known formats (Stripe, GitHub, Slack tokens).
Books That Will Help
| Topic | Book | Chapter |
|---|---|---|
| Security Patterns | “Foundations of Information Security” | Ch. 4 |
| Git Internals | “Pro Git” | Ch. 7 (Git Hooks) |
| Info Theory | “The Secret Life of Programs” | Ch. 2 (Data Representation) |
Common Pitfalls & Debugging
Problem 1: “Too many false positives - flagging test data as secrets”
- Why: Test strings like
"AKIA_EXAMPLE_KEY_123"have high entropy but aren’t real secrets. - Fix: Add a whitelist/allowlist pattern or check if the file is in a
test/directory:if 'test' in filepath.lower() or 'example' in string.lower(): return False # Skip test files - Quick test: Create a test file with fake keys and verify they’re skipped.
Problem 2: “Git hook runs too slowly - developers are frustrated”
- Why: You’re scanning all files in the repo instead of just the staged changes.
- Fix: Only scan
git diff --cached --name-only:files=$(git diff --cached --name-only) for file in $files; do python secret_sentry.py "$file" done - Quick test: Stage 1 file and measure execution time (should be < 200ms).
Problem 3: “High entropy strings like UUIDs are flagged”
- Why: UUIDs have high entropy but aren’t secrets. You need to pattern-match before entropy checking.
- Fix: Add UUID regex and skip known patterns:
uuid_pattern = r'[0-9a-f]{8}-[0-9a-f]{4}-[0-9a-f]{4}-[0-9a-f]{4}-[0-9a-f]{12}' if re.match(uuid_pattern, string): return False - Quick test:
550e8400-e29b-41d4-a716-446655440000should not be flagged.
Problem 4: “Can’t differentiate between real keys and encrypted/hashed values”
- Why: Both have high entropy. This is a fundamental limitation of entropy-based detection.
- Fix: Use format-specific regex (AWS keys start with
AKIA, GitHub tokens withghp_):patterns = { 'aws': r'AKIA[0-9A-Z]{16}', 'github': r'ghp_[0-9a-zA-Z]{36}' } - Quick test: Real patterns should match; hashes shouldn’t.
Problem 5: “Binary files cause UnicodeDecodeError”
- Why: You’re trying to scan
.jpg,.pdf, or compiled binaries as text. - Fix: Skip binary files by checking extension or attempting decode:
binary_exts = {'.jpg', '.png', '.pdf', '.exe', '.so'} if any(filepath.endswith(ext) for ext in binary_exts): return # Skip - Quick test: Run on a directory with images and verify they’re skipped.
Project 5: Architectural Grapher (Dependencies)
- File: STATIC_ANALYSIS_CODE_QUALITY_AT_SCALE.md
- Main Programming Language: Python
- Knowledge Area: Dependency Analysis / Graph Visualization
- Software or Tool:
Graphviz,dotlanguage
What you’ll build: A tool that analyzes import or include statements across a large project and generates a visual graph showing how modules depend on each other. It will also detect “Circular Dependencies” which are architectural red flags.
Real World Outcome
You’ll generate a visual “Skeleton” of your codebase. This helps you identify “The Big Ball of Mud” where everything depends on everything else. You’ll be able to see “Circular Dependencies” (A -> B -> C -> A) that cause weird bugs and slow build times.
$ python arch_grapher.py ./my_app/ --output graph.dot
$ dot -Tpng graph.dot -o graph.png

[ANALYSIS COMPLETE]
Modules Scanned: 156
Edges Found: 412
[ALERT] Circular Dependency Detected:
        auth.py -> users.py -> permissions.py -> auth.py
[RESULT] Architecture graph saved to graph.png
Viewing the generated PNG will show clusters of modules and isolated islands, revealing the true architecture vs the documented one.
The Core Question You’re Answering
“Is our architecture a clean hierarchy or a tangled mess?”
Architecture isn’t what’s in the README; it’s what’s in the import statements. You are answering: “Can I extract the auth module without dragging the entire database and frontend with it?”
Concepts You Must Understand First
Stop and research these before coding:
- Directed Acyclic Graphs (DAG)
- What makes a graph “Acyclic”?
- Why are cycles the enemy of clean architecture?
- Book Reference: “Algorithms” Ch. 4 - Sedgewick
- Module Resolution
- How does
import utilsfindutils.py? - What is the difference between relative (
from . import x) and absolute imports?
- How does
- Graph Traversal (Tarjan’s Algorithm)
- How do you find “Strongly Connected Components” (cycles) in a graph?
- DOT Language
- How do you describe a graph in text for Graphviz? (e.g.,
A -> B;)
- How do you describe a graph in text for Graphviz? (e.g.,
Questions to Guide Your Design
Before implementing, think through these:
- Granularity
- Do you want to graph file-to-file dependencies, or folder-to-folder?
- Should you include third-party libraries (pip packages) in the graph?
- Filtering
- How will you filter out standard library imports (like
os,sys) to reduce noise?
- How will you filter out standard library imports (like
- Cycles
- If a cycle is detected, how will you display it to the user so they can fix it?
Thinking Exercise
Trace the Dependency
Imagine three files:
app.py:import apiapi.py:import dbdb.py:from app import config
Questions:
- Draw the graph. Is there a cycle?
- If
db.pyonly needsconfig, how would you break the cycle using a separateconfig.py?
The Interview Questions They’ll Ask
- “How do circular dependencies affect the compilation and startup time of a program?”
- “What are the trade-offs between a flat module structure and a deeply nested one?”
- “Explain Tarjan’s or Kosaraju’s algorithm for finding cycles.”
- “How does your tool handle dynamic imports?”
Hints in Layers
Hint 1: Extracting Imports
Use ast.Import and ast.ImportFrom nodes. For ImportFrom, the module attribute tells you which file is being targeted.
Hint 2: Path Normalization
Always convert paths to absolute paths (os.path.abspath) before adding them to your graph dictionary. Otherwise, ./utils.py and utils.py might look like different nodes.
Hint 3: Visualizing with DOT Your tool should output a string like:
digraph G {
  "main.py" -> "auth.py";
  "auth.py" -> "db.py";
}
Then use the dot command line tool to turn it into a PNG.
Books That Will Help
| Topic | Book | Chapter |
|---|---|---|
| Graph Algorithms | “Algorithms” by Sedgewick | Ch. 4 |
| Architecture | “Software Architecture in Practice” | Ch. 3 |
| System Mapping | “The Pragmatic Programmer” | Ch. 2 (Orthogonality) |
Project 6: The Automated Refactorer (Codemods)
- File: STATIC_ANALYSIS_CODE_QUALITY_AT_SCALE.md
- Main Programming Language: JavaScript/TypeScript (using
jscodeshift) or Python (usinglibcst) - Knowledge Area: Source-to-Source Transformation / CST
- Software or Tool:
jscodeshift(JS) orLibCST(Python)
What you’ll build: A tool that automatically migrates code from an old API to a new one (e.g., changing all calls of old_log(msg) to new_logger.info(msg, level='DEBUG')).
Real World Outcome
A tool that updates thousands of files in seconds with 100% precision. This is how large companies like Facebook and Google manage breaking changes in their internal libraries without breaking their developers’ workflows.
$ codemod ./src --rule rename-logger

[PROCESSING] 1,402 files...
[UPDATED] src/auth.py (12 replacements)
[UPDATED] src/db/connection.py (2 replacements)
[DONE] 45 files modified, 892 lines changed.

# Run 'git diff' to see the magic:
- old_log("User logged in")
+ logger.info("User logged in", level="DEBUG")
The Core Question You’re Answering
“How can I rewrite code programmatically while preserving its human readability?”
An AST throws away comments and whitespace. To rewrite code, you need a Concrete Syntax Tree (CST) or a Lossless AST. You are answering: “How do I change a function call without deleting the developer’s carefully placed comments?”
Concepts You Must Understand First
Stop and research these before coding:
- CST vs AST
- Why does a CST keep whitespace, comments, and semicolons while an AST does not?
- Book Reference: “Compilers: Principles and Practice” Ch. 3
- Pattern Matching
- How do you describe a “Call to function X with 2 arguments”?
- Transformation Cycles
- Match -> Transform -> Print.
- Idempotency
- Why should running a codemod twice produce the same result as running it once?
Questions to Guide Your Design
Before implementing, think through these:
- Scope Safety
- If you rename a function
log, how do you ensure you don’t rename a local variable also namedlog? (Hint: Scope analysis).
- If you rename a function
- Comment Preservation
- Where do comments “live” in a syntax tree? (Hint: They are often ‘trivia’ attached to the nearest node).
- Dry Runs
- How will you show the user what would change before actually writing to disk?
Thinking Exercise
Transform the Node
Original: print "Hello" (Old Python 2)
Goal: print("Hello") (Python 3)
Questions:
- In a CST, what nodes need to be added? (Parentheses).
- Where should a comment like
print "Hello" # simplebe attached after the transformation?
The Interview Questions They’ll Ask
- “What are the risks of automated refactoring?”
- “Explain why an AST is insufficient for source-to-source translation.”
- “How would you write a codemod to migrate from Promises to Async/Await?”
- “How do you handle ‘Grit’ (formatting styles) during transformation?”
Hints in Layers
Hint 1: Use jscodeshift / ast-explorer
Use ASTExplorer.net. Set the transform to jscodeshift. This is the fastest way to see how transformations work in real-time.
Hint 2: Target the Call Site
Focus on CallExpression nodes. Check node.callee.name to see if it’s the function you want to change.
Hint 3: Argument Manipulation
To add a default argument, you’ll need to push a new Literal or Identifier node into the arguments array of the CallExpression.
Books That Will Help
| Topic | Book | Chapter |
|---|---|---|
| Refactoring Theory | “Refactoring” by Martin Fowler | Ch. 1-4 |
| Program Transformation | “Generative Programming” | Ch. 9 |
| Advanced JS ASTs | “You Don’t Know JS” | Scope & Closures |
Project 7: Taint Tracker (Data Flow Analysis)
- File: STATIC_ANALYSIS_CODE_QUALITY_AT_SCALE.md
- Main Programming Language: Java or Python
- Knowledge Area: Data Flow Analysis / Security
- Software or Tool: SSA (Static Single Assignment) form
What you’ll build: A security tool that tracks “Tainted” (untrusted) user input from an HTTP request through the program’s logic to a “Sink” (like database.execute()). If the input is not passed through a “Sanitizer” function, it flags a potential SQL Injection.
Real World Outcome
You’ll build a security scanner that finds vulnerabilities deep in the logic of a program—vulnerabilities that simple regex-based scanners would miss. You will be able to prove that a piece of data from the internet cannot reach your database without being escaped.
$ python taint_tracker.py ./src/

[VULNERABILITY FOUND] SQL Injection in controllers/user.py
  1. SOURCE: request.form['user_id'] (line 12)
  2. FLOW:   user_id -> query_string (line 22)
  3. FLOW:   query_string -> db.execute() (line 45)
  4. STATUS: UNTREATED (No sanitizer found in path)

[SAFE] Search flow in controllers/blog.py
  1. SOURCE: request.args['q'] (line 5)
  2. FLOW:   q -> sanitized_q via escape_html() (line 10)
  3. STATUS: CLEAN (Sanitizer found)
The Core Question You’re Answering
“Can we prove that untrusted data NEVER reaches a dangerous function without being cleaned?”
Taint analysis is about tracking the ‘infection’ of data. It’s the difference between seeing a string and knowing where that string came from. You are answering: “Does any path in the CFG connect a Source to a Sink without passing through a Sanitizer?”
Concepts You Must Understand First
Stop and research these before coding:
- Sources, Sinks, and Sanitizers
- What is a Source (User input)?
- What is a Sink (Database, shell command)?
- What is a Sanitizer (HTML Escaping, SQL Parameters)?
- Control Flow Graphs (CFG)
- How to turn code into a graph of basic blocks.
- Book Reference: “Engineering a Compiler” Ch. 5
- Reaching Definitions
- Which assignments to a variable reach a certain use of that variable?
- SSA (Static Single Assignment)
- Why is it easier to track data flow if every variable is assigned exactly once?
- Book Reference: “Compilers” Ch. 12 (Dragon Book)
Questions to Guide Your Design
Before implementing, think through these:
- Inter-procedural Analysis
- What happens if the tainted variable is passed as an argument to another function? (Hint: This is where it gets hard).
- Alias Analysis
- If
x = taintedandy = x, thenyis also tainted. How do you track this “aliasing”?
- If
- Field Sensitivity
- If
obj.nameis tainted butobj.idis not, does your tool treat the wholeobjas tainted?
- If
Thinking Exercise
Trace the Taint
def process(data):
    clean = escape(data)
    return clean

input_val = request.get("val")
x = input_val
y = process(x)
db.execute(y)
Questions while tracing:
- Where is the Source?
- Where is the Sink?
- At which line is the taint removed?
- If
processwas called afterdb.execute, would it still be a vulnerability?
The Interview Questions They’ll Ask
- “Explain the difference between Static and Dynamic Taint Analysis.”
- “How do you handle ‘Control-Flow Taint’ (e.g., branching based on a tainted value)?”
- “What are the performance bottlenecks of inter-procedural data-flow analysis?”
- “Why is SSA form preferred for modern static analysis?”
Hints in Layers
Hint 1: Build the CFG
Before tracking taint, you need a graph of the code. Use a library like networkx to represent the blocks and edges.
Hint 2: Simple Intra-procedural tracking
Start with a single function. Keep a set of tainted_variables. When you see x = source(), add x to the set. When you see y = x, if x is tainted, add y.
Hint 3: Propagating Through Blocks Use a “Worklist Algorithm”. Keep processing blocks in your CFG until the set of tainted variables at each point stops changing (convergence).
Books That Will Help
| Topic | Book | Chapter |
|---|---|---|
| Data-Flow Analysis | “Compilers” (Dragon Book) | Ch. 12 |
| SSA Form | “Engineering a Compiler” | Ch. 9 |
| Program Analysis | “Principles of Program Analysis” | Ch. 2 |
Common Pitfalls & Debugging
Problem 1: “Taint tracking stops at function boundaries”
- Why: You’re only doing intra-procedural analysis (within one function). Taint needs to flow through function calls.
- Fix: Build a call graph first, then propagate taint through arguments:
# When you see: result = untrusted_func(tainted_var) # Mark both the function's parameter AND its return value as tainted - Quick test:
def process(x): return xthenclean = process(tainted)-cleanshould be tainted.
Problem 2: “Everything becomes tainted (too many false positives)”
- Why: You’re propagating taint too aggressively. Not every operation on tainted data taints the result.
- Fix: Define “taint transformations” - some operations (like
len(tainted)) produce clean integers:safe_operations = {'len', 'type', 'isinstance', 'bool'} if operation in safe_operations: result_is_clean = True - Quick test:
length = len(user_input)-lengthshould be clean (it’s just a number).
Problem 3: “Can’t detect sanitizers properly”
- Why: You need to explicitly define what counts as “sanitization” for each sink type.
- Fix: Create a mapping of sinks to their sanitizers:
sanitizers = { 'sql_execute': {'escape_sql', 'parameterize'}, 'eval': {'ast.literal_eval'}, # Only safe eval 'shell': {'shlex.quote'} } - Quick test:
safe = escape_sql(user_input); db.execute(safe)should NOT flag.
Problem 4: “Missing indirect taint flow through object attributes”
- Why:
obj.field = taintedthen laterx = obj.field- you’re not tracking taint through object state. - Fix: This requires field-sensitive analysis. Start simple: taint the whole object when any field is tainted:
if node.attr and base_is_tainted: mark_tainted(entire_object) - Quick test:
user.name = request.get('name'); log(user.name)- should track through object.
Problem 5: “Control-flow based taint not detected”
- Why:
if user_role == admin: delete_database()- the branch is controlled by tainted data. - Fix: This is “implicit taint flow” and is HARD. Start by flagging any
ifcondition with tainted variables:def visit_If(self, node): if self.is_tainted(node.test): self.warn("Branch controlled by tainted data") - Quick test:
if user_input == "admin": dangerous_action()should warn.
Problem 6: “Path explosion - analysis never finishes”
- Why: Your CFG has too many paths. You need to bound the analysis depth or use abstractions.
- Fix: Implement a “widening” strategy - limit loop iterations:
max_iterations = 3 if loop_count > max_iterations: merge_all_paths() # Abstract away details - Quick test: Analyze a function with nested loops and verify it completes.
Problem 7: “Aliasing breaks tracking: x = y; x is clean but y is tainted”
- Why: You’re not tracking that
xandypoint to the same data. - Fix: Maintain an alias set - when you see
x = y, add them to the same equivalence class:aliases = UnionFind() # Disjoint set data structure aliases.union(x, y) # Now x and y are aliases - Quick test:
a = tainted; b = a; sink(b)should flagbas tainted.
Project 8: The Scaling Runner (Orchestrator)
- File: STATIC_ANALYSIS_CODE_QUALITY_AT_SCALE.md
- Main Programming Language: Go or Rust
- Knowledge Area: Concurrency / Systems Design / Caching
- Software or Tool: Worker Pools, Shared Caches
What you’ll build: A high-performance orchestrator that runs multiple static analysis tools in parallel. It features a global “Analysis Cache” so that if a file (or its dependencies) hasn’t changed, the analysis results are pulled from the cache instead of being recomputed.
Real World Outcome
You’ll build an engine that can scan a million-line codebase in seconds rather than hours. This is the difference between a tool that developers love (instant feedback) and a tool they hate (breaks their flow).
$ analysis-runner ./enterprise-monorepo/

[JOB] Running 4 analyzers across 1,200 files...
[CACHE] 1,145 files skipped (Hit)
[RUNNING] NamingSheriff on 55 changed files...
[RUNNING] ComplexityMapper on 55 changed files...
[DONE] Analysis finished in 1.4s (Saved 18 minutes via caching).
The Core Question You’re Answering
“How do we make analysis fast enough to run on every keystroke?”
At scale, raw analysis speed is not enough; you need smart orchestration. You are answering: “How do I identify the minimum set of work required to verify this change?”
Concepts You Must Understand First
Stop and research these before coding:
- Incremental Analysis
- How do you detect which files are “Impacted” by a change in a different file?
- Worker Pools
- How do you manage 100 parallel tasks without crashing the CPU?
- Content-Addressable Caching
- Why should you cache results based on a file’s hash (MD5/SHA) rather than its name?
- Directed Acyclic Graphs (Task DAGs)
- How to model tools that depend on other tools (e.g., “Run the Parser before the Taint Tracker”).
Questions to Guide Your Design
Before implementing, think through these:
- Cache Invalidation
- If
A.pyimportsB.py, andB.pychanges, do you need to re-run the analyzer onA.py?
- If
- Deduplication
- If two different tools report the same bug on the same line, how do you merge their results into one report?
- I/O vs CPU
- Analysis is often CPU-heavy (parsing) but also I/O-heavy (reading thousands of files). How do you balance this?
Thinking Exercise
Map the Cache
Suppose you have 3 files:
A.py(v1) ->B.py(v1)C.py(v1)
Scenario:
- You run the analysis. Everything is cached.
- You modify
B.pyto v2.
Questions:
- Which files’ analysis results are still valid?
- Which files must be re-analyzed?
- How would your runner know
A.pydepends onB.py?
The Interview Questions They’ll Ask
- “Explain the ‘Thundering Herd’ problem in a distributed analysis system.”
- “How would you implement a distributed cache for analysis results?”
- “What are the pros and cons of running analyzers in separate processes vs separate threads?”
- “How do you handle ‘Flaky’ analysis results (results that change without the code changing)?”
Hints in Layers
Hint 1: Use File Hashes
Use hashlib (Python) or crypto/sha256 (Go) to create a key for your cache: cache_key = hash(file_content + analyzer_version + config_hash).
Hint 2: Dependency Mapping Integrate with Project 5 (Architectural Grapher). Use the dependency graph to propagate invalidations.
Hint 3: The Result JSON Standardize your analyzers to output JSON. This makes it trivial for your runner to store and merge results in a database or Redis.
Books That Will Help
| Topic | Book | Chapter |
|---|---|---|
| Caching | “Designing Data-Intensive Applications” | Ch. 3 |
| Concurrency | “Go Programming Blueprints” | Ch. 2 |
| Build Systems | “The GNU Make Book” | Ch. 1 (Dependency tracking) |
Project 9: Mini-LSP (Language Server)
- File: STATIC_ANALYSIS_CODE_QUALITY_AT_SCALE.md
- Main Programming Language: TypeScript or Go
- Knowledge Area: Editor Integration / LSP Protocol / In-memory Indexing
- Software or Tool: JSON-RPC, VS Code Extension API
What you’ll build: A backend server that implements a subset of the Language Server Protocol. Specifically, it will provide “Go to Definition” and “Hover information” for a custom toy language (or a subset of Python).
Real World Outcome
You will be able to open VS Code, type in your custom language, and see the same features you’re used to in “real” languages: command-clicking a function to jump to its source, and seeing documentation pop up when you hover over a variable.
# In the IDE (Visual Representation):
# User hovers over 'calculate_tax()'
# Server sends JSON-RPC response:
{
  "contents": {
    "kind": "markdown",
    "value": "**calculate_tax(amount: float)**\n\nReturns the tax for a given amount."
  }
}
# Result: User sees a beautiful documentation tooltip in the editor.
The Core Question You’re Answering
“How do editors provide instant feedback while I’m typing broken code?”
Standard static analysis tools run on “Complete” code. An LSP must run on “Partial” and “Broken” code. You are answering: “How do I build an index of all symbols in a project that updates in milliseconds as the user types?”
Concepts You Must Understand First
Stop and research these before coding:
- Language Server Protocol (LSP)
- What is the relationship between the “Client” (Editor) and the “Server”?
- Why is LSP a game-changer for tool developers?
- JSON-RPC
- How does asynchronous communication work between the editor and the server?
- In-memory Indexing
- How do you store thousands of symbols so that “Go to Definition” takes < 10ms?
- Error Tolerance
- How do you parse code that has a missing closing parenthesis without crashing your analyzer?
Questions to Guide Your Design
Before implementing, think through these:
- Position Mapping
- The editor sends coordinates like
line: 10, character: 5. How do you map that back to a specific node in your AST?
- The editor sends coordinates like
- Incremental Updates
- When the user types a single character, should you re-parse the whole file? (Hint: The protocol allows “Incremental Sync”).
- Concurrency
- What happens if a new request comes in while the server is still processing the previous one?
Thinking Exercise
Map the Symbol
Suppose your code is:
def foo():
    pass

x = foo()
Questions:
- If the user’s cursor is on the word
fooin the last line, what information does the server need to find the definition? - What are the line/character coordinates for the definition of
foo?
The Interview Questions They’ll Ask
- “Why was the LSP created? What problem does it solve for the ecosystem?”
- “How do you handle ‘Stale’ data in a language server?”
- “Explain how you would implement ‘Auto-complete’ for a dynamic language.”
- “What are the trade-offs of running the language server in the same process as the editor vs a separate one?”
Hints in Layers
Hint 1: Use a Library
Don’t write the JSON-RPC handling from scratch. Use vscode-languageserver (Node) or go-lsp (Go).
Hint 2: The Symbol Table
Build a dictionary where the key is the symbol name and the value is a Location object (URI + Range). This makes “Go to Definition” a simple O(1) lookup.
Hint 3: Navigating the AST by Position
Write a helper function find_node_at_position(ast, line, col). It should recursively walk the tree and return the “tightest” node that contains that coordinate.
Books That Will Help
| Topic | Book | Chapter |
|---|---|---|
| LSP Protocol | “The Secret Life of Programs” | Ch. 9 (Operating Systems) |
| Modern IDEs | “Code Complete” | Ch. 30 (Programming Tools) |
| Async Patterns | “Learning JavaScript Design Patterns” | Ch. 12 |
Project 10: Change-Aware PR Analyzer
- File: STATIC_ANALYSIS_CODE_QUALITY_AT_SCALE.md
- Main Programming Language: Python or Go
- Knowledge Area: Git / CI Integration / Impact Analysis
- Software or Tool: GitHub API,
git diff
What you’ll build: A tool that integrates with a GitHub Pull Request. It determines exactly which files were changed and, crucially, which other files might be affected by those changes. It then runs analysis only on that “Impact Set” and posts results as comments on the PR.
Real World Outcome
You’ll have a “Bot” that acts as a 24/7 automated code reviewer. It doesn’t just run tests; it tells developers why their change is dangerous before they merge it.
# On a GitHub Pull Request:
[PR-BOT] Analyzing PR #451 (Modified: auth.py)
[IMPACT] Found 3 files that depend on the modified functions.

[ISSUE] auth.py:102 -> You renamed 'get_token' to 'fetch_token'.
[ISSUE] tests/test_login.py:12 -> This file still calls 'get_token' and will fail.

[DONE] 2 issues found. Please fix before merging.
The Core Question You’re Answering
“How do we make static analysis relevant to the current developer task?”
Developers hate tools that report 1,000 legacy bugs they didn’t create. You are answering: “How do I filter analysis results to show ONLY what changed or was broken by this specific commit?”
Concepts You Must Understand First
Stop and research these before coding:
- Git Diffs & Hunks
- How to read a diff to find which lines were added/removed.
- Book Reference: “Pro Git” Ch. 2
- Impact Analysis
- If I change function
A, andBcallsA, thenBis “Impacted.” How do we findBautomatically? (Hint: Project 5’s Dependency Graph).
- If I change function
- Webhooks & APIs
- How does GitHub tell your tool that a new PR has been opened?
- Baselines
- How to store the “Current state of the world” so you only report delta changes.
Questions to Guide Your Design
Before implementing, think through these:
- Precision
- If a file has 100 existing lint errors, and the PR changes 2 lines, how do you ensure the bot only comments on those 2 lines?
- Failure Policy
- Should a single “Complexity” warning block a merge, or should it just be an “FYI”?
- Performance
- If the monorepo has 50,000 files, how do you find the impact set in under 5 seconds?
Thinking Exercise
Trace the Impact
Files:
user.py: containsget_email(id)profile.py: callsuser.get_email(current_id)settings.py: callsuser.get_email(user_id)
Scenario: A developer changes get_email(id) to get_email(id, include_private=False).
Questions:
- Which files are in the “Impact Set”?
- If the developer only updated
profile.pyto match the new signature, what should the Bot say aboutsettings.py?
The Interview Questions They’ll Ask
- “How do you distinguish between a ‘New Error’ and an ‘Existing Error’ in a PR?”
- “What are the advantages of ‘Checkstyle’ comments vs a summary report?”
- “How would you handle merge conflicts in an automated analysis bot?”
- “Explain ‘False Positive Fatigue’ and how you would combat it in a PR workflow.”
Hints in Layers
Hint 1: Use git diff --unified=0
This gives you the raw changes without extra context lines, making it easier to parse the “hunks” and map them to line numbers.
Hint 2: The Dependency Link Combine Project 5 (Grapher) and Project 10. When a file is changed, look up its “In-Degree” in the graph to find every file that imports it. These are your targets for re-analysis.
Hint 3: PR Decoration
Use the PyGithub (Python) or google/go-github (Go) library. Look specifically for the “Review Comments” API, which allows you to attach a message to a specific line of a specific file in a PR.
Books That Will Help
| Topic | Book | Chapter |
|---|---|---|
| Git Mastery | “Pro Git” | Ch. 7 |
| API Design | “Design and Build Great Web APIs” | Ch. 4 |
| Feedback Loops | “The Phoenix Project” | Ch. 22 (The Second Way) |
Project 11: The Unified Quality Platform (Final Project)
- File: STATIC_ANALYSIS_CODE_QUALITY_AT_SCALE.md
- Main Programming Language: Go (Orchestrator) + Python (Analyzers)
- Knowledge Area: Distributed Systems / Data Pipelines / Static Analysis
- Software or Tool: Docker, Redis (Caching), Postgres (Results storage)
What you’ll build: A full-stack platform that manages the quality of an entire organization’s codebases. It automatically discovers repositories, runs a suite of analyzers (naming, complexity, secrets, dependencies, taint), stores historical trends, and provides a dashboard for engineering leadership to see “Quality Debt” across teams.
Real World Outcome
You’ve built an enterprise-grade SaaS product. This isn’t just a CLI tool; it’s a platform that provides “Quality Intelligence.” An Engineering VP can log in and see: “Our security vulnerability count decreased by 20% this quarter,” or “The Billing Team has the highest technical debt; let’s give them a refactoring week.”
# Dashboard (Web View):
[OVERVIEW]
- Repositories Managed: 450
- Total Lines Analyzed: 12,000,000
- Open Vulnerabilities: 12 (Critical)

[TRENDS]
- Average Cyclomatic Complexity: 5.4 (Down from 6.1)
- Security Sentry Blocks: 45 (Saved 45 potential leaks)

[TEAM RANKING]
1. Checkout Team (A+)
2. Inventory Team (B)
3. Legacy-API Team (D) -> Action Required
The Core Question You’re Answering
“How do we move from ‘Finding Bugs’ to ‘Managing Quality’ across a whole company?”
At the scale of a company, the problem isn’t “Is this file good?” but “Is our overall quality improving or declining?” You are answering: “How do I build a system that aggregates millions of analysis results into actionable insights for decision-makers?”
Concepts You Must Understand First
Stop and research these before coding:
- Multi-tenancy & Isolation
- How to run untrusted analyzer code safely (Hint: Docker Containers).
- Time-Series Data
- How to store metrics so you can draw “Quality over Time” graphs.
- Data Aggregation
- How to “Roll up” results from individual lines -> files -> modules -> repos -> teams.
- Distributed Task Queues
- How to use Redis/Celery or RabbitMQ to distribute the analysis load across multiple servers.
Questions to Guide Your Design
Before implementing, think through these:
- Standardization
- How will you force 10 different analyzer tools to output a “Unified Format” that your dashboard can read?
- Historical Baselines
- How do you handle the “Day 1 Problem” (where a tool finds 50,000 legacy issues and everyone ignores it)?
- Custom Rule Engine
- Can teams write their own “Company Rules” (e.g., “Always use our custom logging library”) without redeploying the whole platform?
Thinking Exercise
Design the Pipeline
Scenario: A developer pushes to repo-X.
Questions:
- How does your platform know about the push?
- Which Docker container gets started first?
- Where does the analysis JSON get stored?
- How do you notify the developer if a new critical bug is found?
The Interview Questions They’ll Ask
- “How do you scale a static analysis platform to handle 1,000 repos?”
- “What are the security risks of running user-provided linter rules on your server?”
- “How do you define ‘Technical Debt’ in mathematical terms using your tool’s metrics?”
- “Explain the ‘Data Pipeline’ pattern and why it fits this project.”
Hints in Layers
Hint 1: Standardize the Schema Create a JSON schema for “Analysis Result”. Every tool you build (Project 1, 2, 4, 7) must output this exact format.
{
  "tool": "naming_sheriff",
  "issue_type": "naming_violation",
  "location": {"file": "...", "line": 10},
  "severity": "low"
}
Hint 2: The Orchestrator
Use Go to build a simple API that accepts a Git URL, clones it, and spawns a Docker container for each analyzer. Use a library like testcontainers-go to manage the lifecycle.
Hint 3: Visualizing Trends
Use a tool like Chart.js or Grafana to visualize the results from your Postgres database. Focus on “Slope” (is it getting better or worse?) rather than raw counts.
Books That Will Help
| Topic | Book | Chapter |
|---|---|---|
| Systems Design | “Designing Data-Intensive Applications” | Ch. 1, 10-12 |
| Distributed Tasks | “The Art of Multiprocessor Programming” | Ch. 1 |
| Engineering Management | “The Software Architect Elevator” | Ch. 4 (The Engine Room) |
Project Comparison Table
| Project | Difficulty | Time | Focus Area | Impact |
|---|---|---|---|---|
| 1. Naming Sheriff | Level 1 | Weekend | AST Basics | Personal Habits |
| 2. Complexity Mapper | Level 2 | 1 Week | Graph Metrics | Team Quality |
| 3. Ghost Hunter | Level 3 | 2 Weeks | Reachability | Technical Debt |
| 4. Secret Sentry | Level 2 | Weekend | Security Patterns | Risk Prevention |
| 5. Arch Grapher | Level 2 | 1 Week | System Design | Architecture |
| 6. Auto Refactorer | Level 4 | 2 Weeks | Transformations | Legacy Migration |
| 7. Taint Tracker | Level 5 | 1 Month | Advanced Security | Zero-Day Finding |
| 8. Scaling Runner | Level 3 | 1-2 Weeks | Performance | Dev Velocity |
| 9. Mini-LSP | Level 4 | 2 Weeks | Developer Experience | IDE Integration |
| 10. Change-Aware Bot | Level 2 | 1 Week | Workflow | CI/CD Integration |
| 11. Unified Platform | Level 5 | 1 Month+ | Distributed Systems | Enterprise Scale |
Summary
This learning journey moves you from writing a simple script to architecting a global quality infrastructure. By completing these 11 projects, you will have mastered the art of seeing code not as text, but as a structured, measurable, and transformable system.
Recommended Path
- The Foundations: Projects 1, 2, 4
- The Architect’s Lens: Projects 3, 5, 6
- The Systems Expert: Projects 8, 9, 10
- The Masterclass: Projects 7, 11
Expected Outcomes
After completing these projects, you will:
- Master Abstract Syntax Trees (ASTs) for code reasoning.
- Implement advanced data-flow analysis for security.
- Build automated refactoring tools for safe migration.
- Architect high-performance analysis pipelines.
- Manage quality at the organizational scale.
You’ll have built a portfolio of 11 working tools that demonstrate absolute mastery of Static Analysis from first principles.
Sources & Further Reading
Market Research & Industry Statistics
The market data and statistics referenced throughout this guide come from comprehensive industry research:
- Global Growth Insights - Static Code Analysis Tools Market Report
- Market Growth Reports - Static Analysis Software Market Size & Share
- The Business Research Company - Static Analysis Global Market Report
- GM Insights - Static Analysis Market Size & Share Analysis
- Intel Market Research - Static Code Detection Tool Market Outlook 2025-2032
- Cognitive Market Research - Static Code Analysis Software Market Growth
Tool Comparisons & Performance Studies
- 2025 AI Code Security Benchmark: Snyk vs Semgrep vs CodeQL
- Semgrep vs SonarQube Comparison (PeerSpot)
- SourceForge Tool Comparison: CodeQL vs Semgrep vs SonarQube
Vulnerability & Security Research
- Computer Weekly - 2024 CVE Statistics
- Securelist - Analyzing the Vulnerability Landscape in Q1 2024
- Securelist - Exploits and Vulnerabilities in Q3 2024
- arXiv - An Empirical Study of Static Analysis Tools for Secure Code Review
- OpenSSF CVE Benchmark - Testing SAST Tools on Real Vulnerabilities
Official Tool Documentation
When building these projects, consult the official documentation:
- Python AST module: https://docs.python.org/3/library/ast.html
- jscodeshift (JavaScript): https://github.com/facebook/jscodeshift
- Language Server Protocol: https://microsoft.github.io/language-server-protocol/
- Graphviz: https://graphviz.org/documentation/
- Go AST package: https://pkg.go.dev/go/ast
Academic Papers (Optional Deep Dives)
For those interested in the theoretical foundations:
- NIST SATE V Report: Ten Years of Static Analysis Tool Expositions
- NSF Report: Investigating Cybersecurity Static-Analysis Tool Findings