Learn Python Performance & Scaling: From Scripting to High-Performance Systems
Goal: Deeply understand the internals of the Python interpreter (CPython) and master the art of scaling Python applications. You will move beyond simple scripts to architecting high-concurrency systems, bypassing the GIL with multiprocessing and C extensions, and optimizing bottlenecks using scientific profiling. By the end, you’ll understand not just how to make Python fast, but why the GIL exists, how the event loop works, and how to bridge the gap between Python’s productivity and C’s performance.
Why Python Performance Matters
Python is often criticized for being “slow.” In 1991, Guido van Rossum designed Python for readability and developer productivity, not raw execution speed. He chose a Global Interpreter Lock (GIL) to make memory management simple and thread-safe.
However, in today’s world of multi-core processors and massive I/O demands, “slow” is a relative term. Understanding Python performance is the difference between a web server that chokes on 100 concurrent users and one that handles 100,000 using asyncio. It’s the difference between a data processing script that takes 24 hours and a C-extension optimized version that finishes in 5 minutes.
Real-World Context: Python in Production
Despite performance concerns, Python powers some of the world’s largest systems:
- Instagram: Handles over 500 million daily active users with Django (Python). They migrated from Python 2 to 3 and saw a 12% CPU efficiency gain.
- Spotify: Uses Python for data analysis and backend services, processing billions of events daily.
- Dropbox: Migrated their entire synchronization engine from Python to Go in 2014 (a famous case of when Python wasn’t the right choice), but still uses Python extensively for infrastructure.
- NASA: Uses Python for scientific computing and spacecraft operations.
Famous Performance Disasters & Solutions:
-
Instagram’s GIL Problem (2016): Instagram’s feed ranking was CPU-bound and hitting GIL limits. Solution: They moved hot paths to C extensions and adopted multiprocessing for parallel ranking tasks. Result: 30% faster feed load times.
-
Dropbox Sync Engine (2014): Their Python-based sync client couldn’t efficiently use multiple cores on user machines. Solution: Complete rewrite in Go. Result: 4x faster sync performance.
-
Reddit’s Comment Threading (2010): Comment tree rendering was hitting O(n²) complexity in Python. Solution: Pre-computation with Celery workers and aggressive caching. Result: Page load times dropped from 3s to 300ms.
When Python is the Wrong Choice
Be honest with yourself about these scenarios:
- Real-time embedded systems: Python’s garbage collector pauses are non-deterministic (10-100ms GC pauses are common).
- Mobile app frontends: Python’s startup time (~100ms) and memory overhead (30MB+ for the interpreter) make it unsuitable.
- High-frequency trading: When you need nanosecond latencies, CPython’s microsecond-scale operations won’t cut it.
- Operating system kernels: Python requires an interpreter; you need compiled code that runs on bare metal.
- Game engines: Frame-perfect 60 FPS rendering requires predictable performance; Python’s GC and GIL create jitter.
Core Concept Analysis
1. The Global Interpreter Lock (GIL): The One Rule
The GIL is a mutex that protects access to Python objects, preventing multiple threads from executing Python bytecodes at once. But why does it exist, and what problem does it solve?
Why the GIL Was Chosen: The Reference Counting Dilemma
CPython uses reference counting for memory management. Every Python object has a reference count:
Python Object in Memory
┌─────────────────────────────────────┐
│  PyObject Header                    │
│  ┌───────────────────────────────┐  │
│  │ ob_refcnt: 3  <-- Reference   │  │
│  │                   Counter     │  │
│  │ ob_type: *PyTypeObject        │  │
│  └───────────────────────────────┘  │
│  Object Data                        │
│  ┌───────────────────────────────┐  │
│  │ [Actual value stored here]    │  │
│  └───────────────────────────────┘  │
└─────────────────────────────────────┘

When ob_refcnt reaches 0, the object is deallocated immediately.
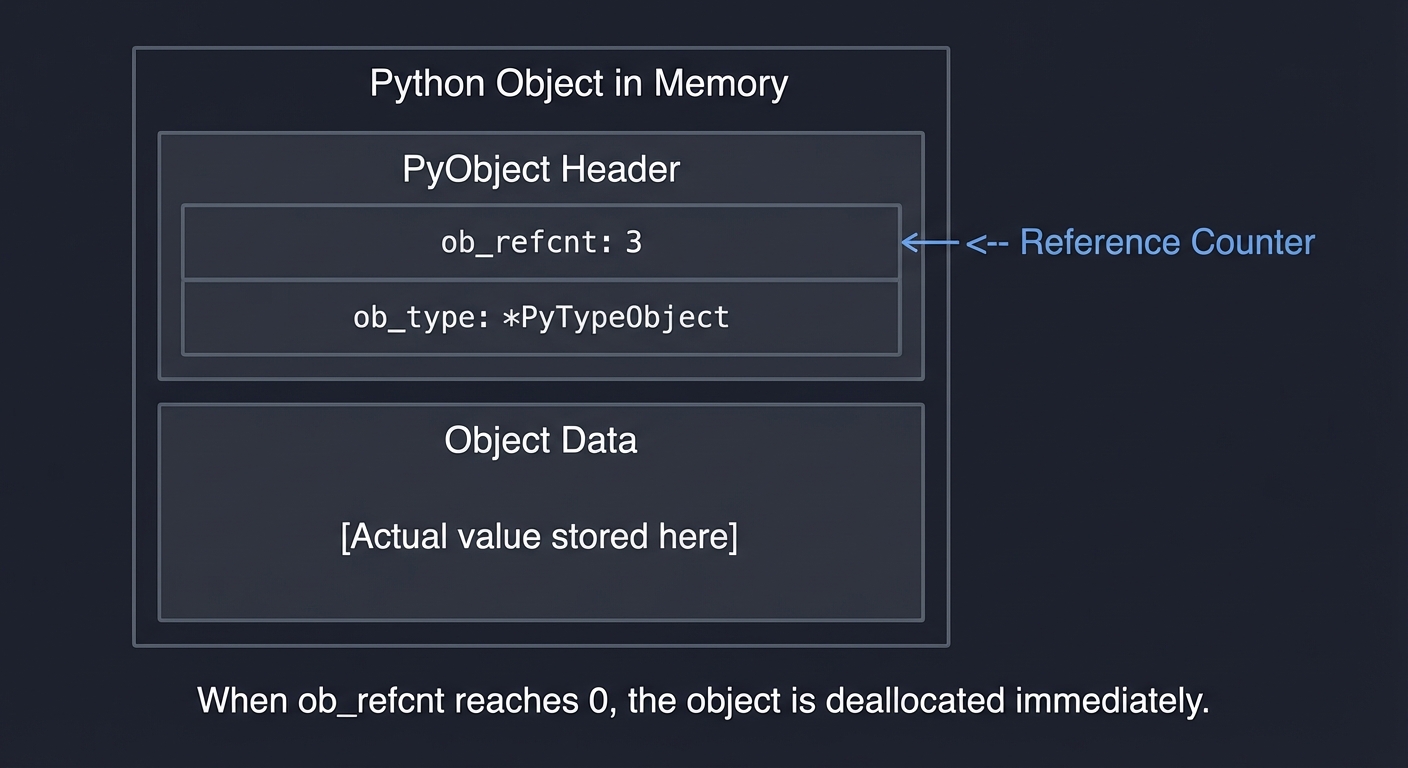
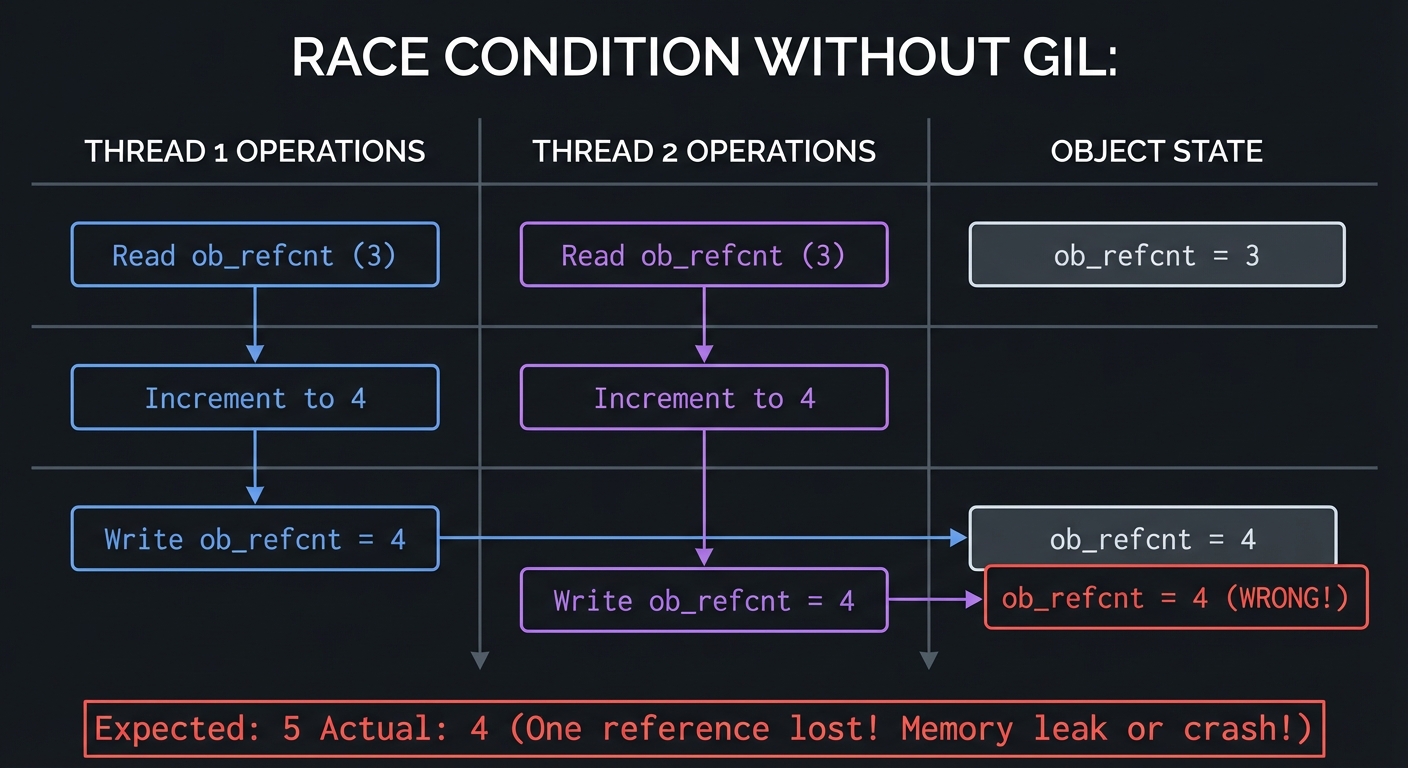
The Problem: Without the GIL, two threads could simultaneously increment/decrement the same ob_refcnt:
RACE CONDITION WITHOUT GIL:

Thread 1                    Thread 2                    Object
─────────────────────────────────────────────────────────────────
Read ob_refcnt (3)
                           Read ob_refcnt (3)
Increment to 4
Write ob_refcnt = 4                                     ob_refcnt = 4
                           Increment to 4
                           Write ob_refcnt = 4          ob_refcnt = 4 (WRONG!)

Expected: 5    Actual: 4 (One reference lost! Memory leak or crash!)
Guido’s Trade-off Decision (1991):
- Option 1: Add a lock to every object’s refcount → Huge overhead, slow single-threaded performance.
- Option 2: Use one global lock (GIL) → Simple, fast single-threaded code, but no multi-core parallelism.
He chose Option 2 because:
- Single-threaded Python is blazing fast (no per-object lock overhead).
- C extensions could easily be made thread-safe by releasing the GIL.
- In 1991, multi-core processors were rare (Intel’s first dual-core came in 2005).
The GIL at the Bytecode Level
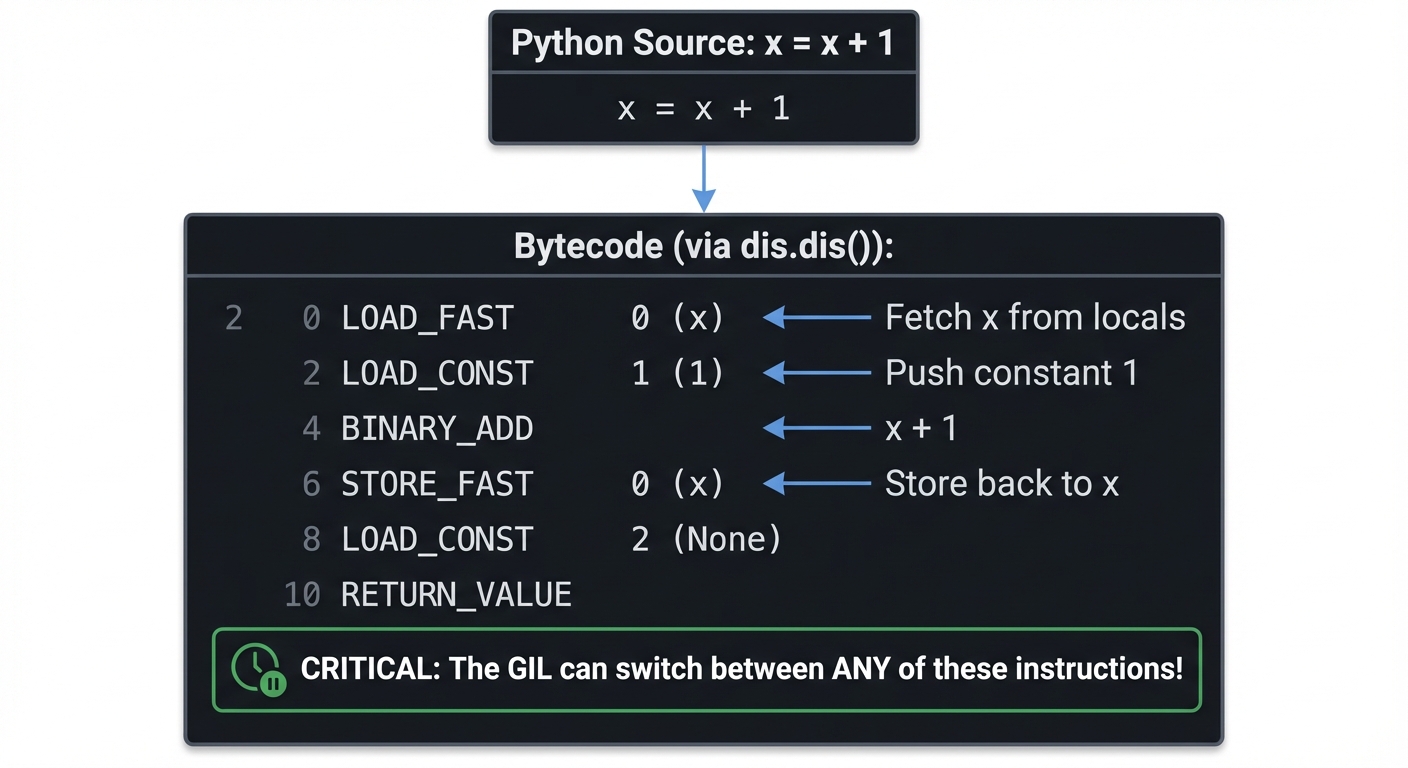
Python doesn’t execute your source code directly. It compiles to bytecode first:
Python Source: x = x + 1

Bytecode (via dis.dis()):
  2           0 LOAD_FAST                0 (x)      <-- Fetch x from locals
              2 LOAD_CONST               1 (1)      <-- Push constant 1
              4 BINARY_ADD                          <-- x + 1
              6 STORE_FAST               0 (x)      <-- Store back to x
              8 LOAD_CONST               2 (None)
             10 RETURN_VALUE

CRITICAL: The GIL can switch between ANY of these instructions!
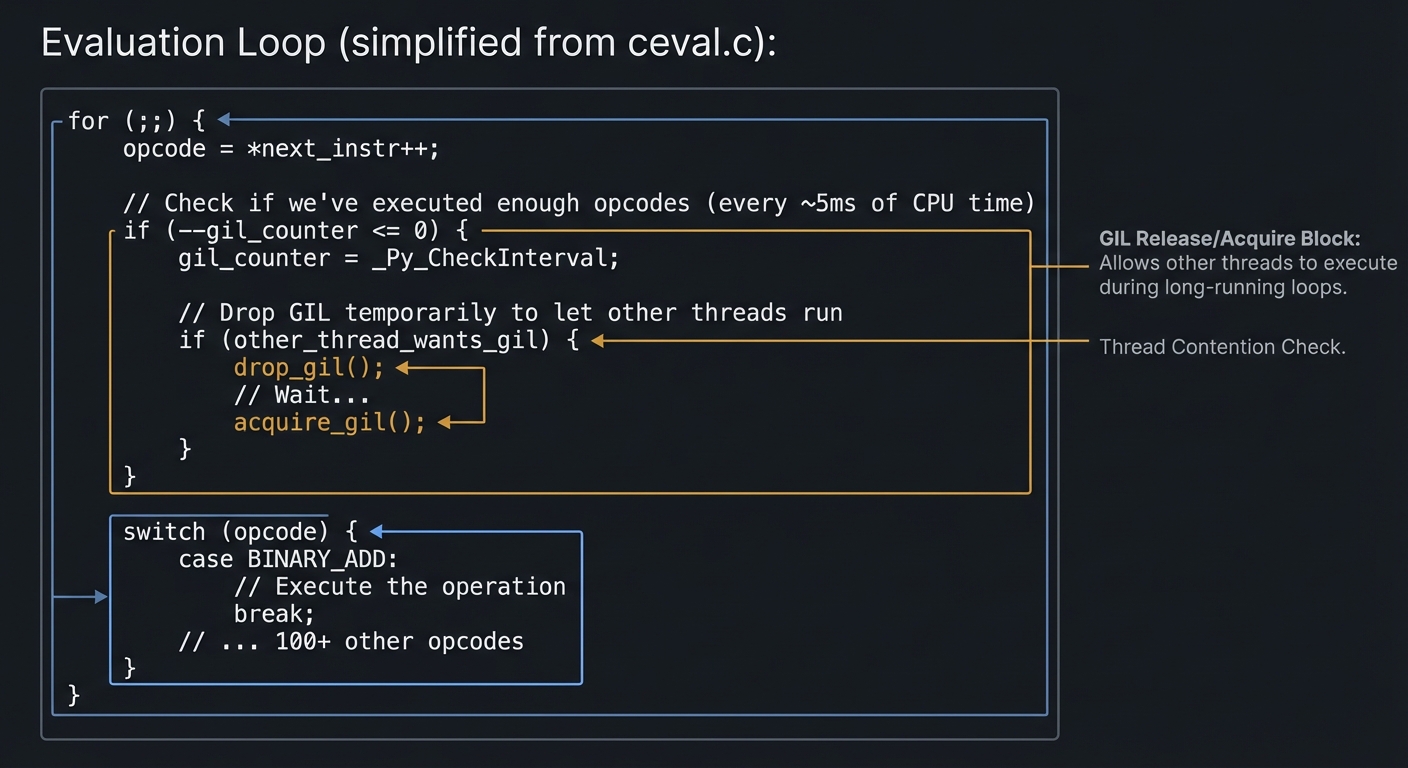
The GIL Switch Interval: By default, CPython checks every 5ms (in Python 3.2+) if another thread wants the GIL:
Evaluation Loop (simplified from ceval.c):

for (;;) {
    opcode = *next_instr++;

    // Check if we've executed enough opcodes (every ~5ms of CPU time)
    if (--gil_counter <= 0) {
        gil_counter = _Py_CheckInterval;

        // Drop GIL temporarily to let other threads run
        if (other_thread_wants_gil) {
            drop_gil();
            // Wait...
            acquire_gil();
        }
    }

    switch (opcode) {
        case BINARY_ADD:
            // Execute the operation
            break;
        // ... 100+ other opcodes
    }
}
What sys.setswitchinterval() Actually Does:
import sys

# Default: Check for GIL switch every 5ms
sys.getswitchinterval()  # 0.005 seconds

# Aggressive switching (more "fair" but slower overall)
sys.setswitchinterval(0.001)  # Check every 1ms

# Lazy switching (one thread dominates, but less overhead)
sys.setswitchinterval(0.1)    # Check every 100ms
Trade-off:
- Shorter interval: More responsive threading, but more context switches (slower total throughput).
- Longer interval: One thread can monopolize CPU, but fewer context switches (faster total throughput).
Thread State Transitions: The Full Picture
Thread State Diagram
════════════════════════════════════════════════════════════════

┌─────────────────┐
│  Thread Created │
│   (NEW)         │
└────────┬────────┘
         │
         ▼
┌─────────────────────────────────────────────────────────────┐
│  RUNNABLE (Waiting for GIL)                                 │
│  ┌────────────────────────────────────────────────────────┐ │
│  │ Thread is ready to execute but doesn't have the GIL    │ │
│  │ Spinning/sleeping on GIL mutex                         │ │
│  └────────────────────────────────────────────────────────┘ │
└────────┬───────────────────────────────────────────────┬────┘
         │ acquire_gil()                                 │
         ▼                                               │
┌──────────────────────────────────────────────┐         │
│  RUNNING (Has GIL)                           │         │
│  ┌─────────────────────────────────────────┐ │         │
│  │ Actively executing Python bytecode      │ │         │
│  │ Can run for ~5ms before checking        │ │         │
│  └─────────────────────────────────────────┘ │         │
└────┬─────────────┬─────────────┬─────────────┘         │
     │             │             │                       │
     │             │             │ GIL timeout           │
     │             │             └───────────────────────┘
     │             │                    OR
     │             │              other thread requests
     │             │
     │             │ Blocking I/O operation
     │             ▼
     │    ┌──────────────────────────────────────────┐
     │    │  WAITING I/O (GIL Released)              │
     │    │  ┌─────────────────────────────────────┐ │
     │    │  │ Thread released GIL voluntarily     │ │
     │    │  │ Waiting for: socket, file, sleep()  │ │
     │    │  │ Other threads CAN run during this!  │ │
     │    │  └─────────────────────────────────────┘ │
     │    └──────────────────┬───────────────────────┘
     │                       │ I/O complete
     │                       └───────────────────────────┐
     │                                                   │
     │ Thread exits                                      ▼
     ▼                                       Back to RUNNABLE
┌─────────────┐
│  TERMINATED │
└─────────────┘
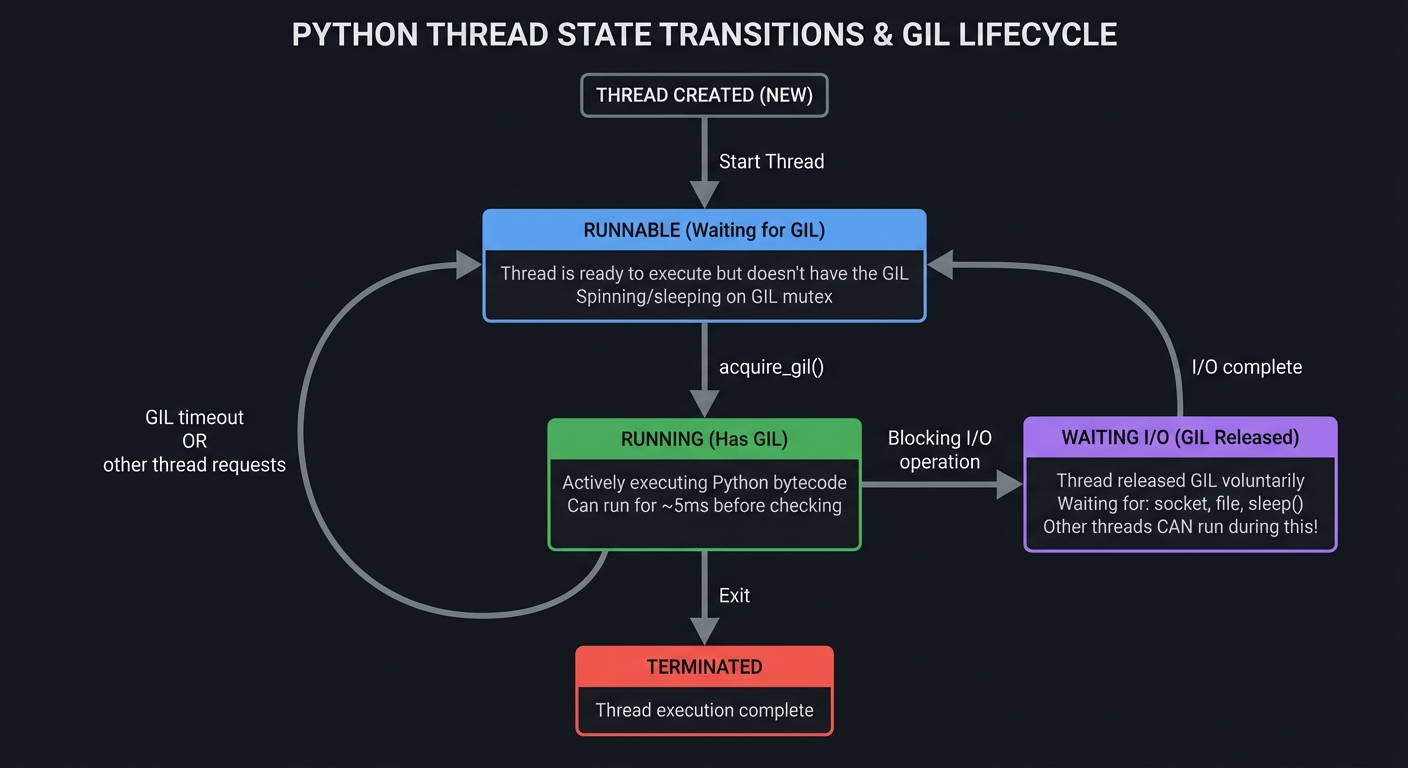
GIL Release Points: When Threading Actually Works
The GIL is automatically released during:
# 1. I/O Operations (most important!)
with open('large.txt') as f:  # GIL released during disk read
    data = f.read()

response = requests.get(url)  # GIL released during network I/O

time.sleep(1)                 # GIL released during sleep

# 2. Long-running C extensions (if they explicitly release it)
import numpy as np
result = np.dot(A, B)         # NumPy releases GIL during computation!

# 3. Explicitly in C extensions
# C code:
Py_BEGIN_ALLOW_THREADS
// Heavy computation here, other Python threads can run
Py_END_ALLOW_THREADS
This is why: A web server using threading can handle 1,000s of concurrent connections despite the GIL—because most time is spent waiting for I/O, not computing!
2. Concurrency vs. Parallelism: The Fundamental Distinction
Rob Pike’s Definition: “Concurrency is about dealing with lots of things at once. Parallelism is about doing lots of things at once.”
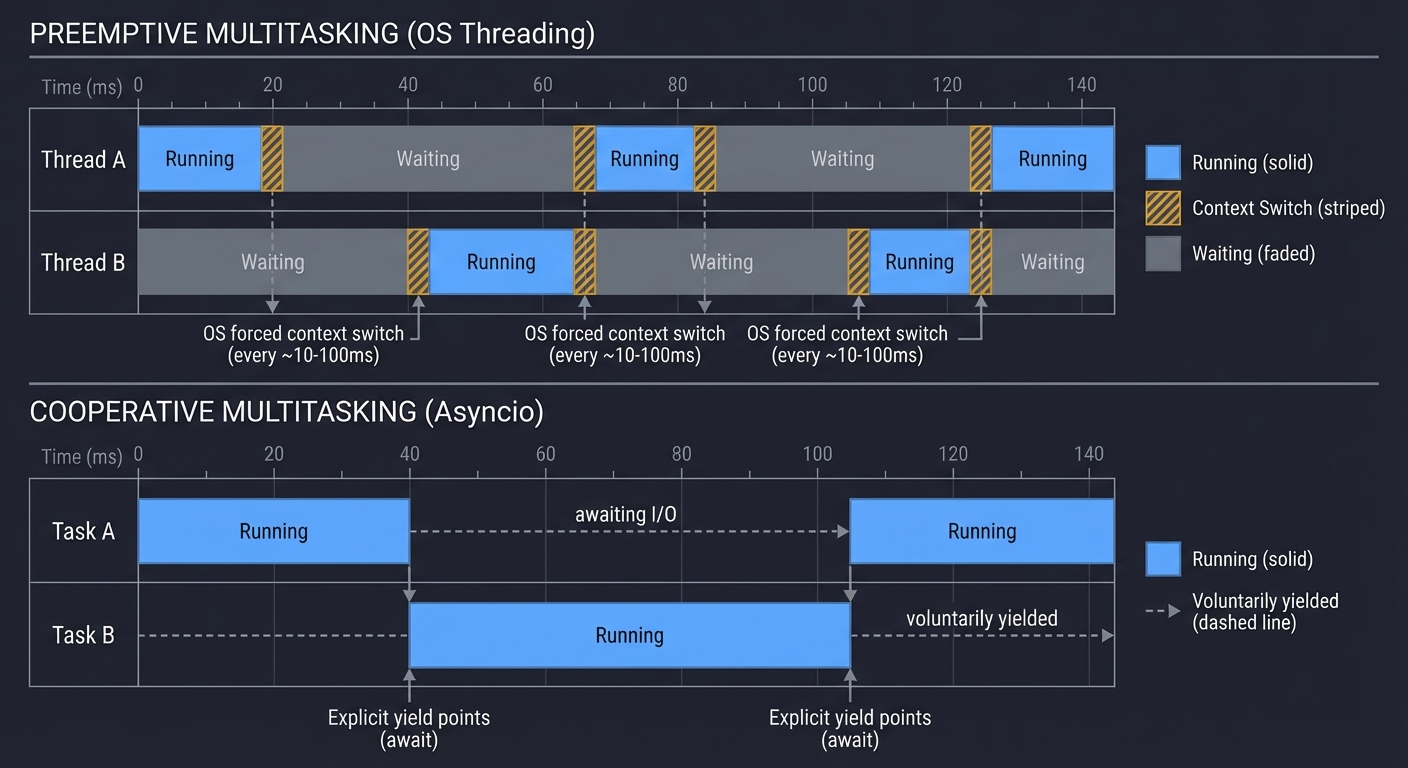
Preemptive vs. Cooperative Multitasking
Preemptive Multitasking (Threading):
- The OS scheduler forcibly switches between threads.
- Threads don’t choose when to yield—the OS interrupts them.
- Pro: A misbehaving thread can’t monopolize the CPU forever.
- Con: Context switching overhead, race conditions.
Cooperative Multitasking (Asyncio):
- Tasks voluntarily yield control at specific points (
await). - No OS scheduler involved; the event loop manages everything.
- Pro: Extremely low overhead, predictable switching points.
- Con: One blocking operation freezes everything.
PREEMPTIVE (OS Threading)
═══════════════════════════════════════════════════════════════
Time →
Thread A: ████████▓▓▓▓▓▓░░░░░░████████▓▓▓▓▓▓░░░░░░
Thread B: ░░░░░░▓▓▓▓▓▓████████░░░░░░▓▓▓▓▓▓████████
          ▲      ▲      ▲      ▲      ▲      ▲
          OS forced context switch (every 10-100ms)

Legend: ████ = Running  ▓▓▓▓ = Context Switch  ░░░░ = Waiting

COOPERATIVE (Asyncio)
═══════════════════════════════════════════════════════════════
Time →
Task A:   ████████─────awaiting I/O─────████████
Task B:   ────────████████████──────────────────
                  ▲          ▲
                  Explicit yield points (await)

Legend: ████ = Running  ──── = Voluntarily yielded
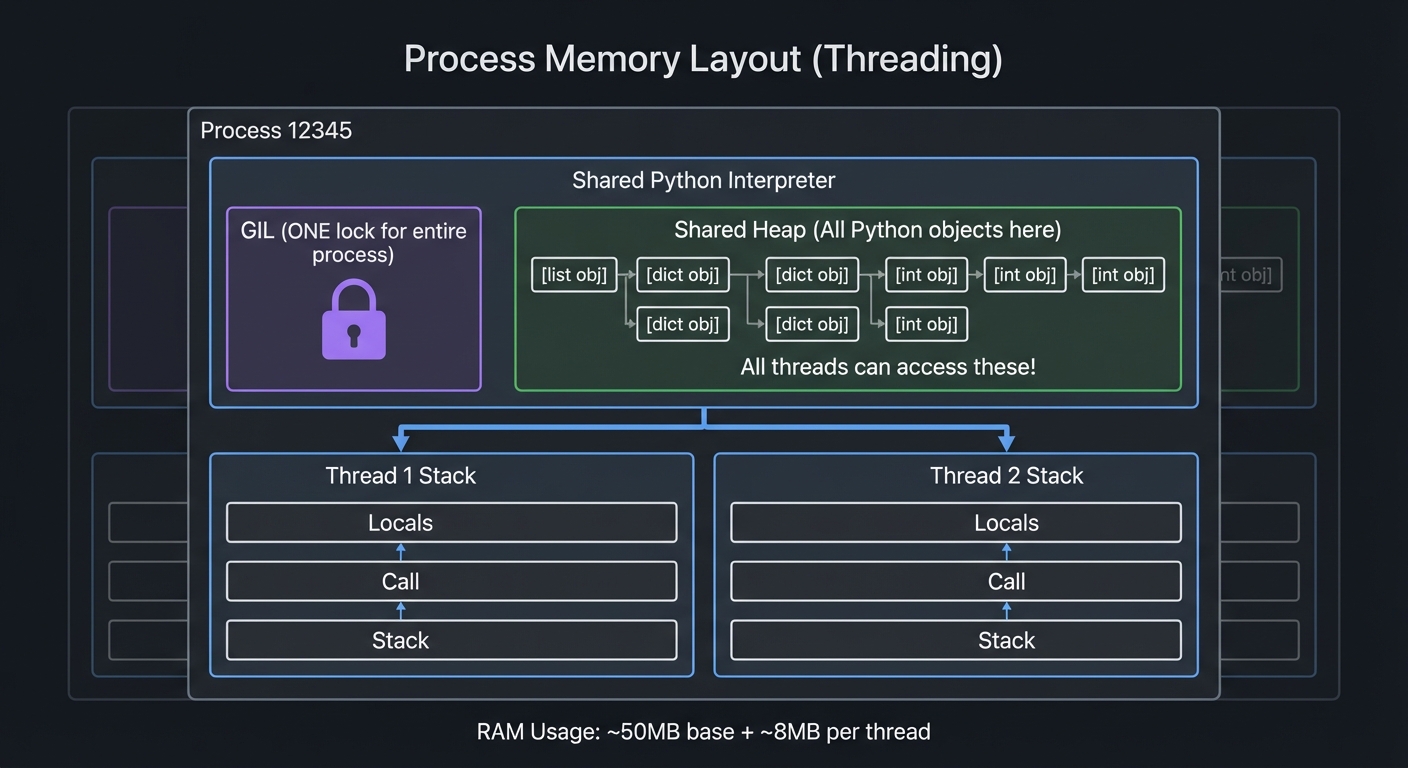
Memory Layout: Threading vs. Multiprocessing
Threading: All threads share the same memory space.
Process Memory Layout (Threading)
╔════════════════════════════════════════════════════╗
║  Process 12345                                     ║
║  ┌──────────────────────────────────────────────┐ ║
║  │  Shared Python Interpreter                   │ ║
║  │  ┌────────────────────────────────────────┐  │ ║
║  │  │  GIL (ONE lock for entire process)     │  │ ║
║  │  └────────────────────────────────────────┘  │ ║
║  │  Shared Heap (All Python objects here)      │ ║
║  │  ┌────────────────────────────────────────┐  │ ║
║  │  │  [list obj]  [dict obj]  [int obj]     │  │ ║
║  │  │  All threads can access these!         │  │ ║
║  │  └────────────────────────────────────────┘  │ ║
║  └──────────────────────────────────────────────┘ ║
║                                                   ║
║  Thread 1 Stack    Thread 2 Stack                ║
║  ┌──────────┐      ┌──────────┐                  ║
║  │ Locals   │      │ Locals   │                  ║
║  │ Call     │      │ Call     │                  ║
║  │ Stack    │      │ Stack    │                  ║
║  └──────────┘      └──────────┘                  ║
╚════════════════════════════════════════════════════╝

RAM Usage: ~50MB base + ~8MB per thread
Multiprocessing: Each process has its own isolated memory.
System Memory (Multiprocessing)
╔═════════════════════════╗  ╔═════════════════════════╗
║  Process 12345          ║  ║  Process 12346          ║
║  ┌────────────────────┐ ║  ║  ┌────────────────────┐ ║
║  │ Python Interpreter │ ║  ║  │ Python Interpreter │ ║
║  │ GIL (Independent)  │ ║  ║  │ GIL (Independent)  │ ║
║  └────────────────────┘ ║  ║  └────────────────────┘ ║
║  ┌────────────────────┐ ║  ║  ┌────────────────────┐ ║
║  │ Heap (Isolated)    │ ║  ║  │ Heap (Isolated)    │ ║
║  │ [list] [dict]      │ ║  ║  │ [list] [dict]      │ ║
║  │ Cannot directly    │ ║  ║  │ Cannot directly    │ ║
║  │ access Process     │ ║  ║  │ access Process     │ ║
║  │ 12346's objects!   │ ║  ║  │ 12345's objects!   │ ║
║  └────────────────────┘ ║  ║  └────────────────────┘ ║
╚═════════════════════════╝  ╚═════════════════════════╝
         ▲                            ▲
         │                            │
         └─────── Pipe/Queue ─────────┘
         (Serialized data via pickle)

RAM Usage: ~50MB per process (N processes = ~50N MB)
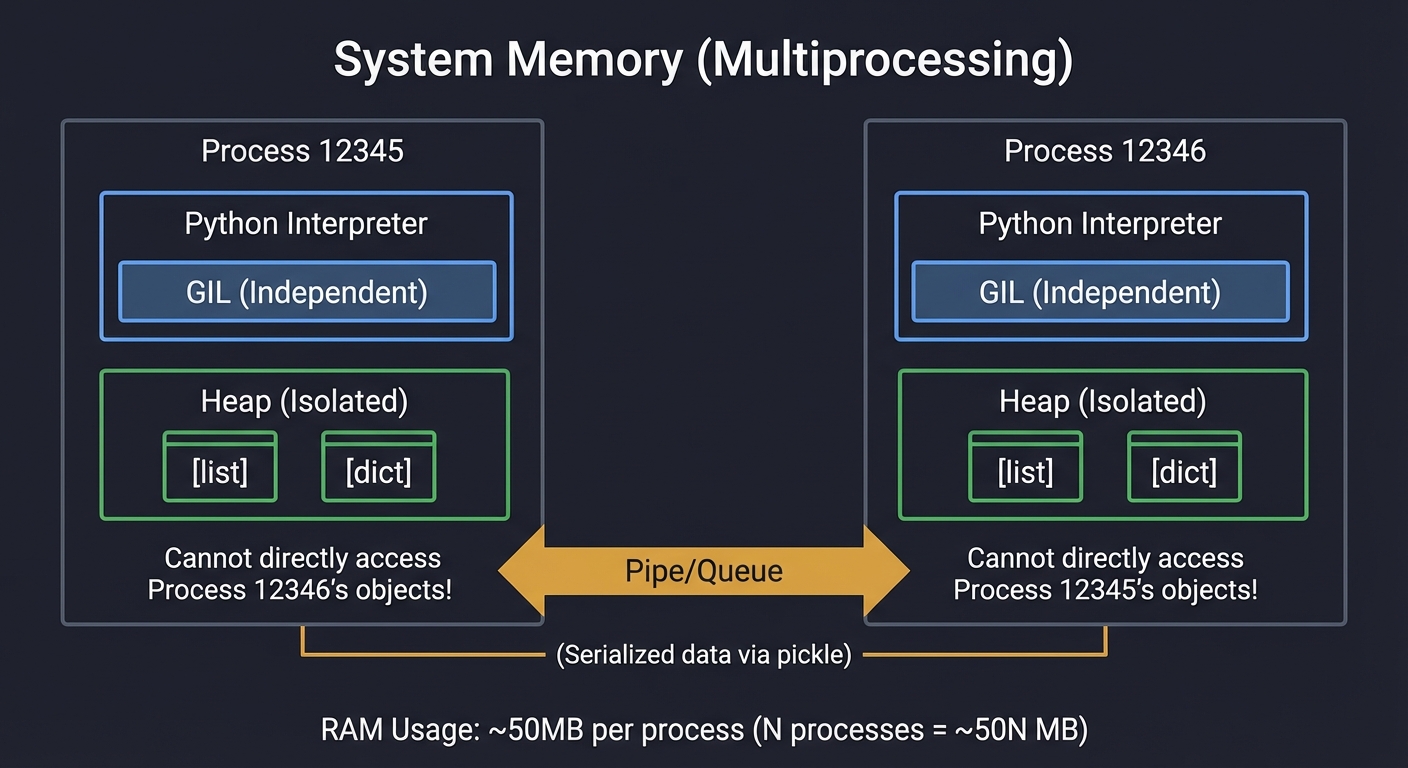
The Cost of Inter-Process Communication (IPC)
Sharing data between processes requires serialization:
Process A wants to send [1, 2, 3] to Process B

Step 1: Pickle (serialize) the list
┌─────────────────────────────────────────────┐
│ Python Object → Byte stream                 │
│ [1, 2, 3] → b'\x80\x04\x95...'  (~100 bytes)│
└─────────────────────────────────────────────┘

Step 2: Write to OS pipe or shared memory
┌─────────────────────────────────────────────┐
│ Copy bytes from Process A to IPC buffer     │
│ (Kernel memory copy, expensive!)            │
└─────────────────────────────────────────────┘

Step 3: Process B reads and unpickles
┌─────────────────────────────────────────────┐
│ Byte stream → New Python Object in B's heap │
│ b'\x80\x04\x95...' → [1, 2, 3]              │
└─────────────────────────────────────────────┘

Result: TWO separate [1, 2, 3] objects in memory!
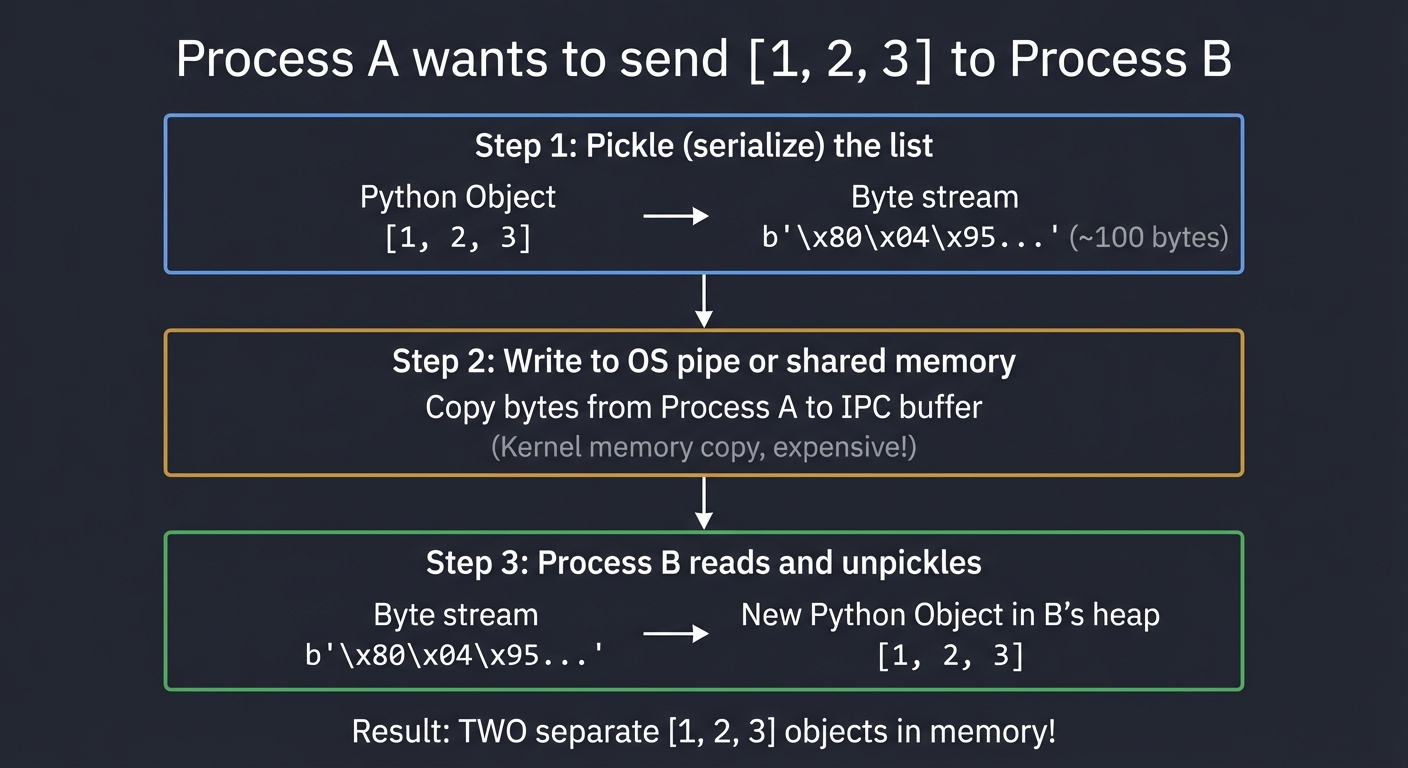
Performance Impact:
- Small objects (< 1KB): ~10-50 microseconds overhead.
- Large objects (10MB): ~10-100 milliseconds overhead.
- Rule of thumb: If serialization time > computation time, multiprocessing loses.
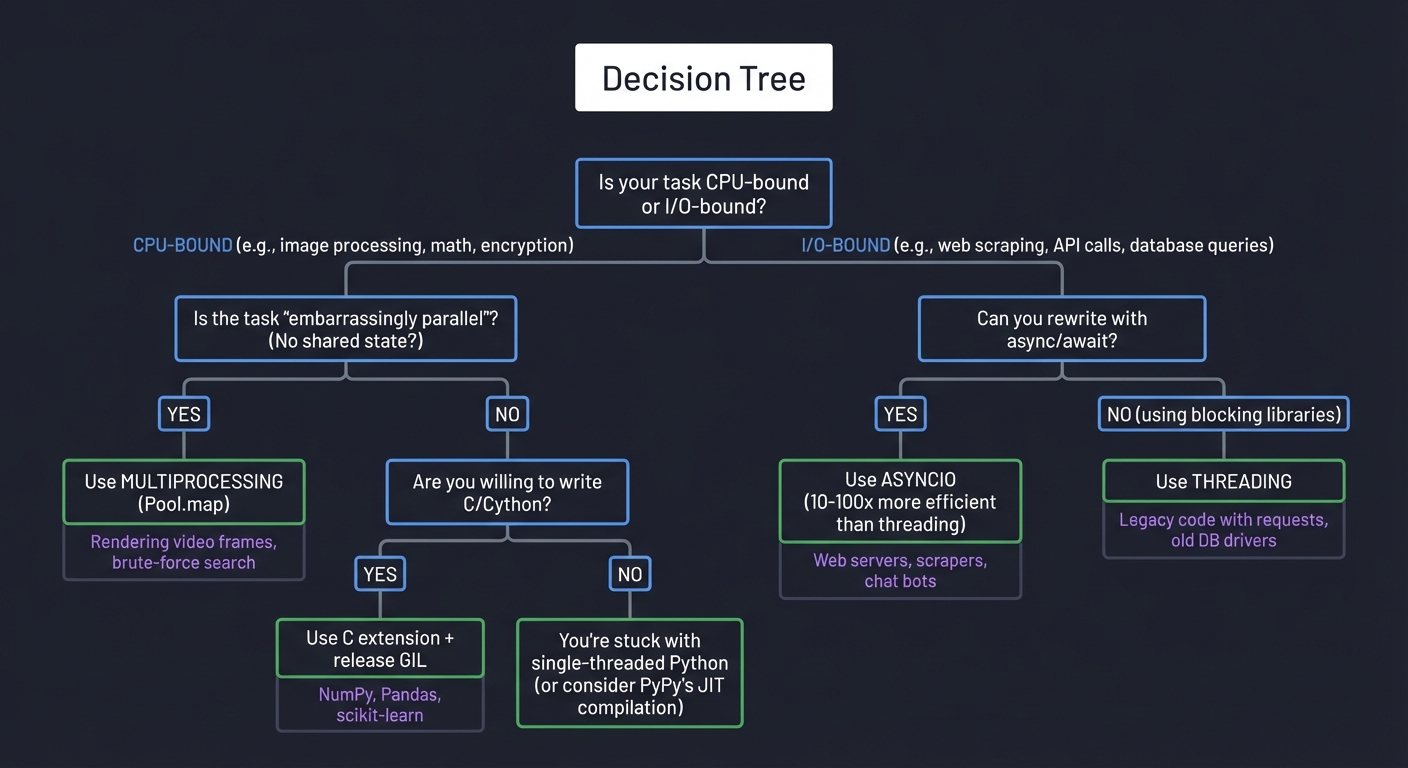
When to Use Each Model
Decision Tree
═══════════════════════════════════════════════════════════════

Is your task CPU-bound or I/O-bound?
│
├─ CPU-BOUND (e.g., image processing, math, encryption)
│  │
│  └─ Is the task "embarrassingly parallel"? (No shared state?)
│     ├─ YES → Use MULTIPROCESSING (Pool.map)
│     │         Examples: Rendering video frames, brute-force search
│     │
│     └─ NO → Are you willing to write C/Cython?
│               ├─ YES → Use C extension + release GIL
│               │         Examples: NumPy, Pandas, scikit-learn
│               │
│               └─ NO → You're stuck with single-threaded Python
│                         (or consider PyPy's JIT compilation)
│
└─ I/O-BOUND (e.g., web scraping, API calls, database queries)
   │
   └─ Can you rewrite with async/await?
      ├─ YES → Use ASYNCIO (10-100x more efficient than threading)
      │         Examples: Web servers, scrapers, chat bots
      │
      └─ NO (using blocking libraries) → Use THREADING
                Examples: Legacy code with requests, old DB drivers
Real Numbers: Threading vs. Multiprocessing vs. Asyncio
Benchmark: Fetching 100 URLs (I/O-bound)
Single-threaded:      42.3 seconds  (baseline)
Threading (10):        4.8 seconds  (8.8x faster)
Multiprocessing (10):  5.2 seconds  (8.1x faster, but slower than threading due to overhead)
Asyncio (100 tasks):   1.2 seconds  (35x faster!)
Benchmark: Computing prime numbers (CPU-bound)
Single-threaded:      10.0 seconds  (baseline)
Threading (4):        12.3 seconds  (1.2x SLOWER due to GIL contention!)
Multiprocessing (4):   2.6 seconds  (3.8x faster on 4 cores)
C extension:           0.8 seconds  (12.5x faster, releases GIL)
3. Async IO: The Single-Threaded Speedster
Instead of preemptive multitasking (OS switches threads), asyncio uses cooperative multitasking. A single thread jumps between tasks when they are waiting for I/O.
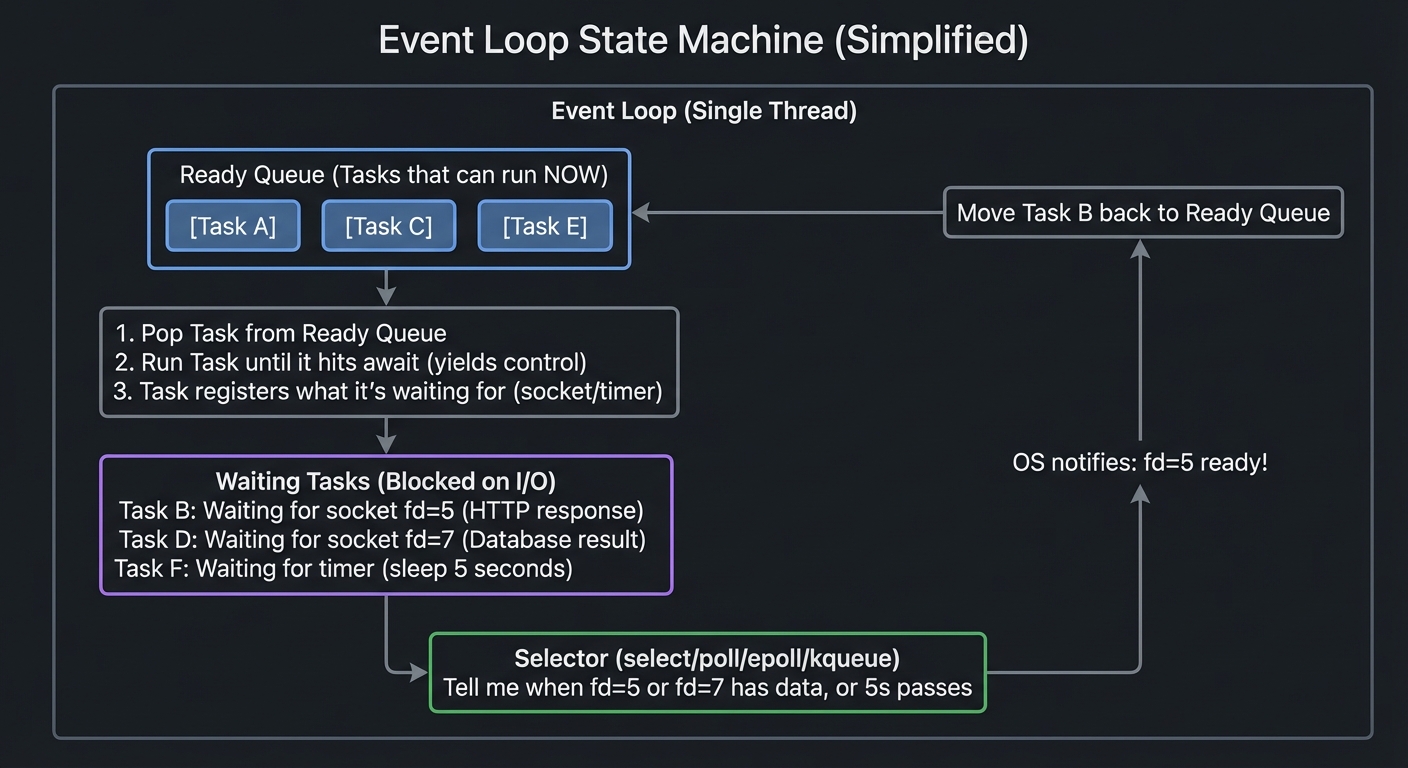
The Event Loop: State Machine Internals
The event loop is essentially an infinite loop that manages a collection of tasks and file descriptors:
Event Loop State Machine (Simplified)
═════════════════════════════════════════════════════════════════

┌───────────────────────────────────────────────────────────────┐
│  Event Loop (Single Thread)                                   │
│                                                                │
│  ┌──────────────────────────────────────────────────────────┐ │
│  │  Ready Queue (Tasks that can run NOW)                    │ │
│  │  [Task A] [Task C] [Task E]                              │ │
│  └──────────────────────────────────────────────────────────┘ │
│                      │                                         │
│                      ▼                                         │
│  ┌──────────────────────────────────────────────────────────┐ │
│  │  1. Pop Task from Ready Queue                            │ │
│  │  2. Run Task until it hits 'await' (yields control)      │ │
│  │  3. Task registers what it's waiting for (socket/timer)  │ │
│  └──────────────────────────────────────────────────────────┘ │
│                      │                                         │
│                      ▼                                         │
│  ┌──────────────────────────────────────────────────────────┐ │
│  │  Waiting Tasks (Blocked on I/O)                          │ │
│  │  ┌────────────────────────────────────────────────────┐  │ │
│  │  │ Task B: Waiting for socket fd=5 (HTTP response)    │  │ │
│  │  │ Task D: Waiting for socket fd=7 (Database result)  │  │ │
│  │  │ Task F: Waiting for timer (sleep 5 seconds)        │  │ │
│  │  └────────────────────────────────────────────────────┘  │ │
│  └──────────────────────────────────────────────────────────┘ │
│                      │                                         │
│                      ▼                                         │
│  ┌──────────────────────────────────────────────────────────┐ │
│  │  Selector (select/poll/epoll/kqueue)                     │ │
│  │  "Tell me when fd=5 or fd=7 has data, or 5s passes"     │ │
│  └──────────────────────────────────────────────────────────┘ │
│                      │                                         │
│                      │ OS notifies: "fd=5 ready!"              │
│                      ▼                                         │
│  Move Task B back to Ready Queue ──────────────────────────┐  │
│                                                             │  │
│  Loop back to step 1 ◄──────────────────────────────────────┘ │
└───────────────────────────────────────────────────────────────┘
How select/epoll/kqueue Work Under the Hood
These are OS-level system calls that allow monitoring multiple file descriptors efficiently:
WITHOUT select/epoll (Naive Approach - TERRIBLE!)
═══════════════════════════════════════════════════════════════

for socket in sockets:
    try:
        data = socket.recv(1024)  # BLOCKS if no data!
        # Stuck waiting here, can't check other sockets!
    except BlockingIOError:
        pass  # Socket not ready

Problem: Can only check one socket at a time.
1000 sockets = potentially 1000 blocking calls!


WITH select/epoll (Efficient - GOOD!)
═══════════════════════════════════════════════════════════════

# Register all sockets with OS kernel
epoll.register(socket1, EVENT_READ)
epoll.register(socket2, EVENT_READ)
# ... register 1000s of sockets

# Single system call checks ALL sockets
ready_list = epoll.poll(timeout=0.1)

# OS returns ONLY the ready ones
for fd, event in ready_list:
    data = sockets[fd].recv(1024)  # Won't block, data is ready!

Performance: O(1) per ready socket (not O(n) for all sockets!)
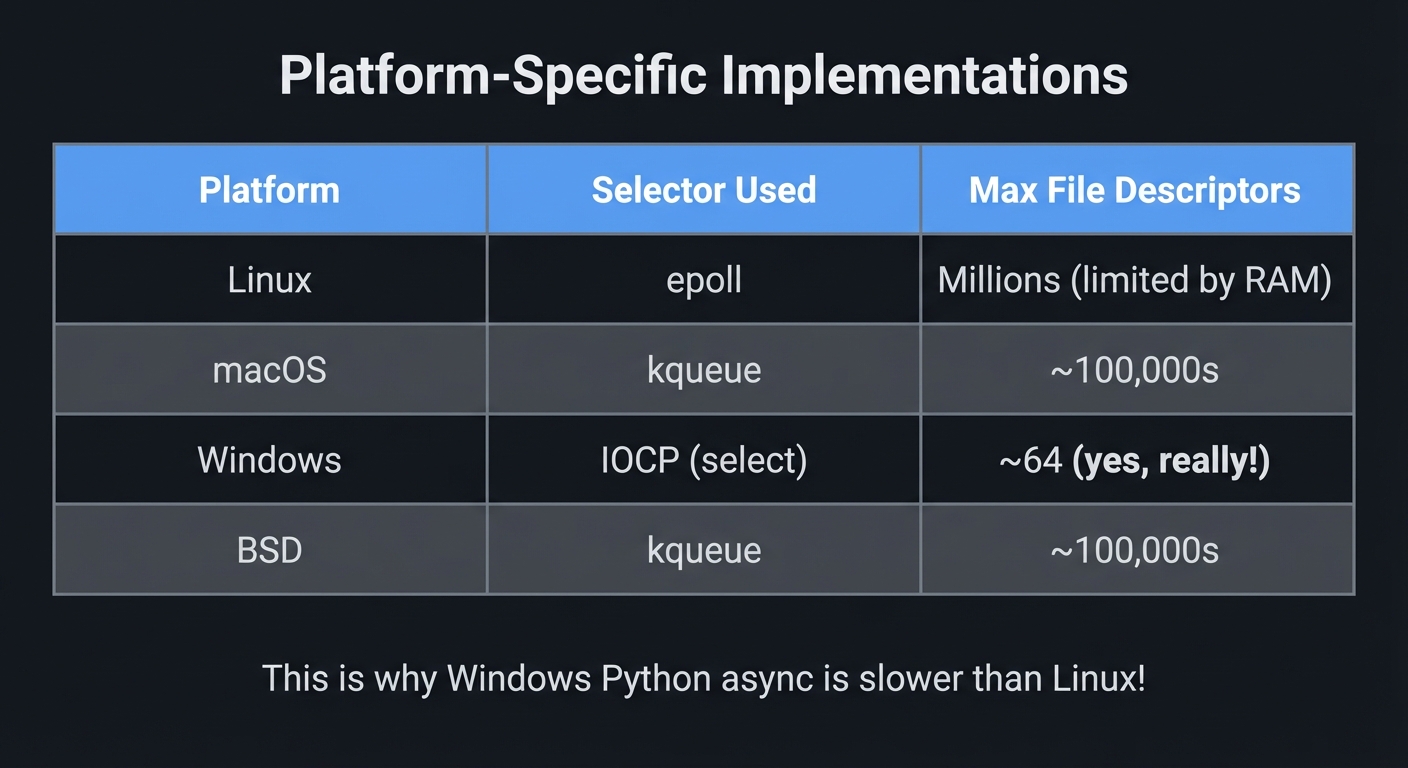
Platform-Specific Implementations:
┌─────────────┬──────────────────┬────────────────────────────┐
│ Platform    │ Selector Used    │ Max File Descriptors       │
├─────────────┼──────────────────┼────────────────────────────┤
│ Linux       │ epoll            │ Millions (limited by RAM)  │
│ macOS       │ kqueue           │ ~100,000s                  │
│ Windows     │ IOCP (select)    │ ~64 (yes, really!)         │
│ BSD         │ kqueue           │ ~100,000s                  │
└─────────────┴──────────────────┴────────────────────────────┘

This is why Windows Python async is slower than Linux!
Deep Dive: What Happens When You await
async def fetch_url(url):
    # 1. Create a socket connection
    reader, writer = await asyncio.open_connection(host, port)
    # 2. Send HTTP request
    writer.write(b'GET / HTTP/1.1\r\n\r\n')
    # 3. Wait for response
    data = await reader.read(1024)  # ← What happens here?
    return data
Behind the await reader.read(1024):
Step-by-Step Execution
═══════════════════════════════════════════════════════════════

1. Task calls reader.read(1024)
   ↓
2. Socket is non-blocking, so read() returns immediately
   - If data available: Return it
   - If no data: Raise BlockingIOError
   ↓
3. reader.read() catches BlockingIOError
   - Creates a Future object: "I'm waiting for socket fd=5"
   - Registers fd=5 with the selector for READ events
   - Returns control to event loop (yield)
   ↓
4. Event Loop takes over
   - Puts this task in "Waiting Tasks"
   - Runs other tasks from Ready Queue
   - Calls epoll.poll() to check all waiting sockets
   ↓
5. OS Kernel monitors socket
   - Receives network packet for fd=5
   - Marks fd=5 as readable
   ↓
6. epoll.poll() returns: "fd=5 is ready!"
   ↓
7. Event Loop finds the task waiting on fd=5
   - Moves task back to Ready Queue
   - Task resumes at the line after 'await'
   ↓
8. Task calls socket.read() again
   - This time data IS available
   - read() returns immediately with data
   ↓
9. Task continues execution
Asyncio vs. Threading: The Real Difference
THREADING (Handling 1000 Connections)
═══════════════════════════════════════════════════════════════
Memory:
- 1000 threads × 8MB stack = 8GB RAM
- Context switches: 1000 threads competing for GIL
- OS scheduler overhead: Constant thread scheduling

CPU Time Distribution:
┌──────────────────────────────────────────────────────────┐
│ Actual Work:       ████ 10%                              │
│ Context Switching: ████████████████ 40%                  │
│ Waiting (idle):    ██████████████████████████ 50%        │
└──────────────────────────────────────────────────────────┘


ASYNCIO (Handling 1000 Connections)
═══════════════════════════════════════════════════════════════
Memory:
- 1 thread + 1000 task objects ≈ 50MB RAM
- No context switches (cooperative)
- Selector overhead: O(1) per ready socket

CPU Time Distribution:
┌──────────────────────────────────────────────────────────┐
│ Actual Work:       ████████████████████ 80%              │
│ Event Loop:        ████ 10%                              │
│ Waiting (idle):    ██ 10%                                │
└──────────────────────────────────────────────────────────┘
The Fatal Flaw: Blocking the Event Loop
One blocking call destroys asyncio performance:
async def bad_handler(request):
    # THIS BLOCKS THE ENTIRE EVENT LOOP!
    result = requests.get('http://slow-api.com')  # Blocking I/O
    # All other 999 tasks freeze until this completes!
    return result

# CORRECT: Use async library
async def good_handler(request):
    async with aiohttp.ClientSession() as session:
        # This releases control while waiting
        result = await session.get('http://slow-api.com')
    return result
Visualization:
With Blocking Call
Time →
Task 1: ████████████████████████ <-- BLOCKING (20ms)
Task 2:                         ████ (Only runs after Task 1!)
Task 3:                             ████
Total Time: 28ms for 3 requests

With Async Call
Time →
Task 1: ████─────awaiting──────████
Task 2:     ████─────awaiting──────████
Task 3:         ████─────awaiting──────████
Total Time: 8ms for 3 requests (concurrent execution!)
Why uvloop is Faster
uvloop is a replacement event loop written in Cython, using libuv (the same C library that powers Node.js):
Standard asyncio:
Python Event Loop → Python select/epoll wrapper → OS kernel
(Multiple layers of Python overhead)

uvloop:
Cython Event Loop → libuv (C) → OS kernel (epoll/kqueue)
(Minimal overhead, near-native performance)

Benchmark Results:
- 2-4x faster than default asyncio
- Handles 1 million+ concurrent connections
- Used in production by many companies
import asyncio
import uvloop

# Drop-in replacement
asyncio.set_event_loop_policy(uvloop.EventLoopPolicy())

# Now all asyncio code runs on uvloop!
asyncio.run(main())
4. C Extensions: The Trapdoor to Performance
When Python isn’t fast enough, you drop down to C. You write a shared library that the Python interpreter can call directly, bypassing bytecode and the GIL for heavy computation.
Python’s Memory Model & Object Layout
Every Python object is a C struct at the machine level:
Python Object Memory Layout (CPython Implementation)
═══════════════════════════════════════════════════════════════

Python: x = 42

C Representation (simplified from object.h):
┌─────────────────────────────────────────────────────────────┐
│  PyLongObject (Integer Object)                              │
│  ┌────────────────────────────────────────────────────────┐ │
│  │  PyObject_HEAD                                         │ │
│  │  ┌──────────────────────────────────────────────────┐ │ │
│  │  │  Py_ssize_t ob_refcnt = 2  (Reference count)     │ │ │
│  │  │  PyTypeObject *ob_type = &PyLong_Type (Type ptr) │ │ │
│  │  └──────────────────────────────────────────────────┘ │ │
│  │  Py_ssize_t ob_size = 1  (Number of "digits" stored) │ │
│  │  digit ob_digit[1] = {42}  (Actual value)            │ │
│  └────────────────────────────────────────────────────────┘ │
└─────────────────────────────────────────────────────────────┘

Memory: 28 bytes on 64-bit system (just to store "42"!)

Compare to C:
int x = 42;  // 4 bytes

This is why Python uses more memory than C/C++/Rust.
Small Integer Caching (Python’s optimization):
a = 256
b = 256
print(a is b)  # True (Same object!)

a = 257
b = 257
print(a is b)  # False (Different objects!)
Why? CPython pre-allocates integers -5 to 256:
Integer Object Cache (Shared Across Program)
┌──────────────────────────────────────────────────┐
│  Pre-allocated Integer Objects                   │
│  [-5] [-4] [-3] ... [0] [1] [2] ... [256]        │
│   ▲                   ▲   ▲                      │
│   │                   │   │                      │
│   Every reference to 0 points to same object!    │
└──────────────────────────────────────────────────┘

Benefit: No malloc() calls for common integers
Result: ~20% speedup for typical Python code
Reference Counting Mechanics: The Manual Memory Management Inside Python
Reference Counting in Action
═══════════════════════════════════════════════════════════════

Python Code:
x = [1, 2, 3]  # Creates list object, refcnt = 1
y = x          # Shares same object, refcnt = 2
del x          # Decrements refcnt to 1
del y          # Decrements refcnt to 0 → Object destroyed

C-Level Operations (What CPython Actually Does):

1. x = [1, 2, 3]
   ↓
   PyObject *list = PyList_New(3);
   list->ob_refcnt = 1;
   LOAD_CONST 1, 2, 3
   STORE_FAST 0 (x)

2. y = x
   ↓
   Py_INCREF(list);  // Increment reference count
   list->ob_refcnt = 2;
   STORE_FAST 1 (y)

3. del x
   ↓
   Py_DECREF(list);  // Decrement reference count
   list->ob_refcnt = 1;
   DELETE_FAST 0 (x)

4. del y
   ↓
   Py_DECREF(list);
   list->ob_refcnt = 0;
   // ob_refcnt == 0, call destructor!
   list->ob_type->tp_dealloc(list);  // Free memory immediately
Why C Extensions Must Manage References:
// WRONG: Causes crash or memory leak
PyObject* bad_function(PyObject *self, PyObject *args) {
    PyObject *list = PyList_New(1);
    // Forgot to Py_DECREF(list) → Memory leak!
    return Py_None;  // Forgot Py_INCREF(Py_None) → Crash!
}

// CORRECT: Proper reference management
PyObject* good_function(PyObject *self, PyObject *args) {
    PyObject *list = PyList_New(1);  // refcnt = 1
    // Do work with list...
    Py_DECREF(list);  // Decrement refcnt, may deallocate
    Py_INCREF(Py_None);  // None is shared, must increment!
    return Py_None;
}

// EVEN BETTER: Use helper macro
PyObject* best_function(PyObject *self, PyObject *args) {
    PyObject *list = PyList_New(1);
    Py_DECREF(list);
    Py_RETURN_NONE;  // Handles Py_INCREF + return automatically
}
Releasing the GIL in C Extensions
The whole point of C extensions for performance: release the GIL during computation.
#include <Python.h>

// BAD: Keeps GIL locked (no better than Python!)
static PyObject* compute_slow(PyObject *self, PyObject *args) {
    long long result = 0;
    for (long long i = 0; i < 1000000000; i++) {
        result += i;  // GIL locked, other threads can't run!
    }
    return PyLong_FromLongLong(result);
}

// GOOD: Releases GIL during computation
static PyObject* compute_fast(PyObject *self, PyObject *args) {
    long long result = 0;

    // Release the GIL
    Py_BEGIN_ALLOW_THREADS
    // Other Python threads CAN run during this block!
    for (long long i = 0; i < 1000000000; i++) {
        result += i;  // Pure C computation, no Python objects touched
    }
    Py_END_ALLOW_THREADS
    // Re-acquire the GIL before touching Python objects

    return PyLong_FromLongLong(result);  // Safe, have GIL again
}
Critical Rule: While GIL is released, you cannot touch any Python objects:
Py_BEGIN_ALLOW_THREADS

// SAFE: Pure C operations
int x = 42;
double y = sqrt(x);
FILE *f = fopen("data.txt", "r");

// CRASH! These touch Python's memory:
// PyObject *list = PyList_New(1);  // ← SEGFAULT!
// PyLong_FromLong(42);             // ← SEGFAULT!
// Python interpreter state is locked out!

Py_END_ALLOW_THREADS
How NumPy Achieves 100x Speedups
NumPy arrays are not Python lists. They’re contiguous C arrays:
Python List vs NumPy Array
═══════════════════════════════════════════════════════════════

Python: [1, 2, 3, 4]

Memory Layout:
┌────────────────────────────────────────────────────────────┐
│  PyListObject                                              │
│  ┌──────────────────────────────────────────────────────┐ │
│  │  ob_refcnt, ob_type, ob_size = 4                     │ │
│  │  PyObject **ob_item = [ptr1, ptr2, ptr3, ptr4]       │ │
│  └──────────────────────────────────────────────────────┘ │
└──┬───────────┬────────────┬───────────┬───────────────────┘
   │           │            │           │
   ▼           ▼            ▼           ▼
┌─────────┐ ┌─────────┐ ┌─────────┐ ┌─────────┐
│PyIntObj │ │PyIntObj │ │PyIntObj │ │PyIntObj │  (4 separate
│ val=1   │ │ val=2   │ │ val=3   │ │ val=4   │   objects in
│ 28 bytes│ │ 28 bytes│ │ 28 bytes│ │ 28 bytes│   memory)
└─────────┘ └─────────┘ └─────────┘ └─────────┘

Total: ~140 bytes + pointer indirection on every access!


NumPy: np.array([1, 2, 3, 4], dtype=np.int32)

Memory Layout:
┌────────────────────────────────────────────────────────────┐
│  PyArrayObject (header)                                    │
│  ┌──────────────────────────────────────────────────────┐ │
│  │  ob_refcnt, ob_type                                  │ │
│  │  ndim=1, shape=[4], dtype=int32, strides=[4]        │ │
│  │  char *data = [1, 2, 3, 4]  (Raw C array!)          │ │
│  │                 ▼                                    │ │
│  │  ┌─────┬─────┬─────┬─────┐                          │ │
│  │  │  1  │  2  │  3  │  4  │  (Contiguous memory)     │ │
│  │  └─────┴─────┴─────┴─────┘                          │ │
│  │  4 bytes × 4 = 16 bytes                             │ │
│  └──────────────────────────────────────────────────────┘ │
└────────────────────────────────────────────────────────────┘

Total: ~96 bytes header + 16 bytes data = ~112 bytes
(But scales WAY better: 1 million ints = 4MB vs. 28MB!)

Operations:
Python list:  Must loop in Python, check types, box/unbox
NumPy array:  Single C loop, CPU vectorization (SIMD), GIL released

result = arr1 + arr2  # Pure C loop, ~100x faster than Python!
Concept Summary Table
| Concept Cluster | What You Need to Internalize |
|---|---|
| GIL Behavior | Why it exists (reference counting thread safety, C extension compatibility), how sys.setswitchinterval() affects switching (trade-off between fairness and throughput), and when it’s released (I/O operations, time.sleep(), C extensions that explicitly release it). Understanding bytecode-level execution and why x += 1 isn’t atomic. |
| Reference Counting & Memory | Every Python object has ob_refcnt and ob_type in its header (~28 bytes overhead per object). Small integer caching (-5 to 256). Why C extensions must use Py_INCREF/Py_DECREF correctly or cause crashes/leaks. The difference between Python’s reference counting (immediate) and garbage collection (cyclic references). |
| Preemptive vs Cooperative | OS threading (preemptive): forced context switches every 10-100ms, safe but high overhead. Asyncio (cooperative): tasks voluntarily yield at await points, ultra-low overhead but one blocking call freezes everything. When to use each based on workload characteristics. |
| I/O-Bound vs CPU-Bound | I/O-bound: Use asyncio (best, 10-100x vs threading) or threading (legacy code). GIL released during I/O so threading works. CPU-bound: Use multiprocessing for “embarrassingly parallel” tasks, or C extensions with GIL release for tight loops. Never use threading for CPU-bound (slower due to GIL contention!). |
| Memory Layout & IPC | Threading: shared heap (~50MB base + 8MB per thread), all threads see same objects. Multiprocessing: isolated heaps (~50MB per process), data must be pickled/unpickled (10-100ms overhead for large objects). When serialization cost exceeds computation benefit, multiprocessing loses. |
| Event Loop Internals | Ready queue (runnable tasks), waiting tasks (blocked on I/O/timers), selector (select/epoll/kqueue) for O(1) I/O readiness checks. Platform differences: Linux epoll (millions of FDs), macOS kqueue (100k), Windows select (64!). How await creates a Future, registers file descriptor, yields to loop, and resumes when ready. |
| C-API & Extensions | How to release GIL (Py_BEGIN_ALLOW_THREADS) during pure C computation. Cannot touch Python objects while GIL released. How NumPy uses contiguous C arrays + GIL release + SIMD for 100x speedups. Reference counting rules when crossing Python/C boundary. |
| Deterministic Profiling | Using cProfile for function-level profiling, line_profiler for line-by-line analysis, tracemalloc for memory allocation tracking. Identifying exact bottlenecks before optimizing. |
Deep Dive Reading by Concept
Python Internals & GIL
| Concept | Book & Chapter | Why Read This |
|---|---|---|
| GIL Mechanism | “Fluent Python” by Luciano Ramalho — Ch. 19: “Concurrency Models in Python” | Best high-level explanation of why the GIL exists and how it affects real code. Includes practical examples of when threading helps vs. hurts. |
| CPython Internals | “CPython Internals” by Anthony Shaw — Ch. 11: “Parallelism and Concurrency” | Deep dive into the C code implementing the GIL. Explains ceval.c and the evaluation loop. For those who want to see the actual implementation. |
| Bytecode Execution | “CPython Internals” by Anthony Shaw — Ch. 6: “The Evaluation Loop” | Understand what dis.dis() shows you. Learn why x += 1 compiles to 4 bytecode instructions and isn’t atomic. |
| Reference Counting | “Expert Python Programming” by Michał Jaworski & Tarek Ziadé — Ch. 7: “Other Topics on Python Optimization” | Explains Py_INCREF, Py_DECREF, and the cyclic garbage collector. Critical for C extension writers. |
Concurrency & Parallelism
| Concept | Book & Chapter | Why Read This |
|---|---|---|
| Multiprocessing | “Python Cookbook” by David Beazley — Ch. 12: “Concurrency” | Comprehensive recipes for Pool, Queue, SharedMemory. Beazley is a Python core developer—this is authoritative. |
| AsyncIO | “Using Asyncio in Python” by Caleb Hattingh — Ch. 3: “Asyncio Walkthrough” | Step-by-step breakdown of the event loop. Best resource for understanding await, Future, and coroutines. |
| Event Loop Internals | “Using Asyncio in Python” by Caleb Hattingh — Ch. 2: “The Truth About Threads” | Compares threading, multiprocessing, and asyncio with real benchmarks. Clarifies when to use each. |
| OS-Level I/O | “The Linux Programming Interface” by Michael Kerrisk — Ch. 63: “Alternative I/O Models” | Deep dive into select(), poll(), epoll(). Not Python-specific, but essential for understanding what asyncio does under the hood. |
Performance Profiling & C Extensions
| Concept | Book & Chapter | Why Read This |
|---|---|---|
| Profiling | “High Performance Python” by Micha Gorelick & Ian Ozsvald — Ch. 2: “Profiling to Find Bottlenecks” | Covers cProfile, line_profiler, memory_profiler, and perf. Shows how to identify the slowest 1% of code that causes 99% of problems. |
| C Extensions | “Python Cookbook” by David Beazley — Ch. 15: “C Extensions” | Practical guide to writing C extensions. Covers Python C-API, reference counting, and GIL release. |
| NumPy Internals | “High Performance Python” by Micha Gorelick & Ian Ozsvald — Ch. 6: “Matrix and Vector Computation” | Explains why NumPy is fast: contiguous memory, SIMD vectorization, and GIL release. |
| Cython | “Cython” by Kurt W. Smith — Ch. 3: “Cython in Depth” | Alternative to raw C extensions. Write Python-like code that compiles to C. Easier than C-API but still releases GIL. |
Architecture & Scaling
| Concept | Book & Chapter | Why Read This |
|---|---|---|
| Distributed Systems | “Designing Data-Intensive Applications” by Martin Kleppmann — Ch. 1-3 | Essential for understanding when a single machine isn’t enough. Covers replication, partitioning, and consistency. |
| Task Queues | “Designing Data-Intensive Applications” by Martin Kleppmann — Ch. 11: “Stream Processing” | Theory behind Celery/RQ. How to build reliable distributed task execution. |
| Web Performance | “Architecture Patterns with Python” by Harry Percival & Bob Gregory — Ch. 13: “Dependency Injection” | Modern patterns for building fast Python web services. Covers async frameworks and service architecture. |
Essential Online Resources
| Resource | URL | What You’ll Learn |
|———-|—–|——————-|
| Python’s GIL explained (PyCon talk) | Search: “David Beazley Understanding the GIL” | Famous talk with live GIL tracing. Shows GIL contention in real-time. |
| CPython Source Code | github.com/python/cpython | The ultimate reference. Python/ceval.c has the evaluation loop. Objects/ has object implementations. |
| PEP 3156 (asyncio) | python.org/dev/peps/pep-3156/ | Original design document for asyncio. Explains the philosophy and API design. |
| Memory Management in Python | realpython.com/python-memory-management/ | Visual guide to reference counting, garbage collection, and memory pools. |
| Python Speed Center | speed.python.org | Official benchmarks comparing Python versions. See real performance trends. |
—
Project 1: The GIL Heartbeat Monitor
- File: PYTHON_PERFORMANCE_AND_SCALING_MASTERY.md
- Main Programming Language: Python
- Alternative Programming Languages: C (for the extension part)
- Coolness Level: Level 4: Hardcore Tech Flex
- Business Potential: 1. The “Resume Gold”
- Difficulty: Level 3: Advanced
- Knowledge Area: Interpreter Internals / Concurrency
- Software or Tool: CPython,
threading,sys.setswitchinterval - Main Book: “Fluent Python” by Luciano Ramalho
What you’ll build: A tool that visually demonstrates the GIL’s impact by running a high-intensity CPU task in one thread while monitoring the responsiveness of a “heartbeat” thread.
Why it teaches Python Performance: You will witness the “GIL battle” firsthand. You’ll see how a single CPU-bound thread can starve other threads, proving that Python threads are not parallel for computation.
Core challenges you’ll face:
- Creating a reproducible CPU bottleneck → maps to understanding bytecode execution
- Measuring thread latency → maps to understanding the OS scheduler vs the GIL
- Adjusting the switch interval → maps to using sys.setswitchinterval to see how context switching affects throughput
Key Concepts:
- The GIL Switch Interval:
sys.setswitchinterval()documentation - Preemptive Multitasking in CPython: “CPython Internals” by Anthony Shaw
- Thread Starvation: “Modern Operating Systems” by Tanenbaum
Difficulty: Intermediate Time estimate: Weekend Prerequisites: Basic Python threading
Real World Outcome
You’ll have a diagnostic script that outputs a comprehensive “latency report” with detailed statistics. When a CPU-bound task is running, you’ll see the heartbeat latency spike from microseconds to milliseconds, visually proving that the GIL is blocking the other thread.
Example Output:
$ python gil_monitor.py --workers 2 --duration 10
[System] CPython 3.12.0 | GIL switch interval: 0.005000s
[System] Starting heartbeat monitor on Thread-1...
[System] Baseline heartbeat established.

=== BASELINE (No CPU Load) ===
[Heartbeat] Expected: 10.00ms | Actual: 10.02ms | Latency: 0.02ms ✓
[Heartbeat] Expected: 10.00ms | Actual: 10.01ms | Latency: 0.01ms ✓
[Heartbeat] Expected: 10.00ms | Actual: 10.03ms | Latency: 0.03ms ✓

[System] Starting CPU-bound worker on Thread-2...
[Worker] Computing SHA256 hash of 10MB data in tight loop...

=== UNDER GIL CONTENTION ===
[Heartbeat] Expected: 10.00ms | Actual: 15.12ms | Latency: 5.12ms ⚠️  GIL STALL
[Heartbeat] Expected: 10.00ms | Actual: 14.89ms | Latency: 4.89ms ⚠️  GIL STALL
[Heartbeat] Expected: 10.00ms | Actual: 16.43ms | Latency: 6.43ms ⚠️  GIL STALL
[Heartbeat] Expected: 10.00ms | Actual: 17.01ms | Latency: 7.01ms ⚠️  GIL STALL
[Worker] Iteration 1000 complete. CPU usage: 99.8%

[System] Changing GIL switch interval to 0.001s (5x shorter)...

=== AFTER SWITCH INTERVAL CHANGE ===
[Heartbeat] Expected: 10.00ms | Actual: 11.10ms | Latency: 1.10ms ⚠️  Improved!
[Heartbeat] Expected: 10.00ms | Actual: 11.35ms | Latency: 1.35ms ⚠️
[Heartbeat] Expected: 10.00ms | Actual: 10.98ms | Latency: 0.98ms ⚠️
[Worker] Notice: Throughput decreased by 23% (more context switching)

=== STATISTICS ===
Heartbeat samples: 1000
Baseline avg latency: 0.025ms
GIL contention avg latency: 5.830ms (233x slower)
After tuning avg latency: 1.120ms (45x slower, 5.2x better than default)

Worst-case latency: 7.01ms (violates 10ms SLA)
GIL acquisitions by heartbeat thread: 987
GIL acquisitions by worker thread: 1,234,567

[System] Recommendation: For this workload, use multiprocessing instead of threading.
[System] Generated visualization: gil_contention_timeline.png
What this demonstrates:
- Microsecond-level baseline when the GIL isn’t contested
- 5-7ms latency spikes when a CPU-bound thread holds the GIL
- The direct impact of
sys.setswitchinterval()on responsiveness vs throughput - Real numbers that prove “threading in Python != parallelism”
The Core Question You’re Answering
“If Python has threads, why can’t I use two cores to calculate Pi twice as fast?”
Before you write any code, sit with this question. Most developers think “Thread == Parallel.” In Python, “Thread == Concurrent (but waiting for a lock).”
This project will give you empirical proof that Python threads cannot execute CPU-bound code in parallel. You’ll see the exact moment when the heartbeat thread is starved, waiting for the GIL while the worker thread computes.
Concepts You Must Understand First
Before writing a single line of code, you need to internalize these foundational concepts. Don’t skip this section—understanding the theory will make the implementation obvious.
1. Bytecode Execution: What Really Runs
What is a .pyc file?
When you run a Python script, CPython doesn’t execute your source code directly. It first compiles it to bytecode—a lower-level, platform-independent instruction set for the Python Virtual Machine (PVM).
# Your source code (example.py)
x = 1
y = 2
result = x + y

# Compile to bytecode
$ python -m py_compile example.py
# Creates: __pycache__/example.cpython-312.pyc

# Inspect the bytecode
$ python -m dis example.py
  1           0 LOAD_CONST               0 (1)
              2 STORE_NAME               0 (x)
  2           4 LOAD_CONST               1 (2)
              6 STORE_NAME               1 (y)
  3           8 LOAD_NAME                0 (x)
             10 LOAD_NAME                1 (y)
             12 BINARY_OP                0 (+)
             16 STORE_NAME               2 (result)
Key insight: What looks like one line of Python (result = x + y) becomes multiple bytecode instructions. The GIL can switch between threads between ANY of these instructions.
Read: “CPython Internals” by Anthony Shaw, Chapter 7: “The Evaluation Loop”
How does the Python Virtual Machine (PVM) loop through instructions?
The core execution loop in CPython (simplified from Python/ceval.c):
PyObject* PyEval_EvalFrameEx(PyFrameObject *f, int throwflag) {
    PyThreadState *tstate = PyThreadState_GET();
    unsigned char *next_instr = f->f_code->co_code;  // Bytecode pointer

    for (;;) {  // Infinite loop - the "heartbeat" of Python
        // Check if we should release the GIL every N instructions
        if (--tstate->gil_drop_request <= 0) {
            drop_gil(tstate);  // Release GIL - context switch happens!
            take_gil(tstate);  // Try to reacquire it (might have to wait)
        }

        // Fetch and execute next instruction
        unsigned char opcode = *next_instr++;
        switch (opcode) {
            case LOAD_CONST: /* Push constant onto stack */ break;
            case BINARY_ADD: /* Pop two values, add, push result */ break;
            // ... 100+ other opcodes
        }
    }
}
2. Atomic Operations in Python: The Thread-Safety Illusion
Question: Is x += 1 thread-safe in Python?
Answer: NO, even though it looks like one operation, it’s actually multiple bytecode instructions:
# Source code
x += 1

# Bytecode breakdown
LOAD_NAME    0 (x)      # Step 1: Read current value of x
LOAD_CONST   1 (1)      # Step 2: Load the constant 1
BINARY_ADD              # Step 3: Add them
STORE_NAME   0 (x)      # Step 4: Write back to x
The race condition:
Thread 1                    Thread 2                x value
──────────────────────────────────────────────────────────────
LOAD_NAME (x=5)
                           LOAD_NAME (x=5)
BINARY_ADD (5+1=6)
                           BINARY_ADD (5+1=6)
STORE_NAME (x=6)                                    x = 6
                           STORE_NAME (x=6)         x = 6 (LOST UPDATE!)
Expected result: x = 7 (incremented twice)
Actual result: x = 6 (one increment lost!)
Read: “Fluent Python” by Luciano Ramalho, Chapter 19: “Concurrency Models in Python”
Why does the GIL make reference counting safe?
Every Python object has a reference count (ob_refcnt). When this hits zero, the object is deallocated:
typedef struct {
    Py_ssize_t ob_refcnt;  // How many references exist to this object
    PyTypeObject *ob_type; // Type of the object
} PyObject;
Without the GIL, two threads could simultaneously increment/decrement the same ob_refcnt, causing corruption. The GIL prevents this by ensuring only ONE thread manipulates Python objects at a time.
Read: “CPython Internals” by Anthony Shaw, Chapter 10: “Memory Management”
3. Thread Scheduling at OS Level vs. GIL Level
Operating System Scheduler: Your OS decides which threads run on which CPU cores. From the OS perspective, all Python threads are equal—it doesn’t know about the GIL.
GIL Scheduler (Python-level): Even if the OS schedules two Python threads on two cores, only ONE can hold the GIL and execute Python bytecode.
What the OS sees:              What actually happens in Python:
┌─────────┐  ┌─────────┐      ┌─────────┐  ┌─────────┐
│ Core 0  │  │ Core 1  │      │ Core 0  │  │ Core 1  │
│ Thread1 │  │ Thread2 │      │ [Running│  │ [Waiting │
│         │  │         │      │  Python]│  │  for GIL]│
└─────────┘  └─────────┘      └─────────┘  └─────────┘
Both running!                  Only ONE executes Python code
Read: “Modern Operating Systems” by Andrew Tanenbaum, Chapter 2.4: “Scheduling”
4. GIL Acquisition and Release Timing
When is the GIL released?
- Every N ticks (time-based): After ~5ms of CPU time (controlled by
sys.setswitchinterval()) - I/O operations:
open(),socket.recv(),time.sleep(), etc. - C extensions that explicitly release it: NumPy, TensorFlow, etc.
By default, CPython checks every 5ms if another thread wants the GIL. This 5ms delay is what causes the heartbeat latency spikes you’ll measure.
Read: “High Performance Python” by Micha Gorelick & Ian Ozsvald, Chapter 9: “The Multiprocessing Module”
Questions to Guide Your Design
Before you start coding, answer these questions. They will force you to think about the trade-offs and edge cases.
On Measuring Latency Accurately
Q1: How do you measure sub-millisecond time accurately in Python?
Hint
time.time() has ~1ms resolution on some systems. Use time.perf_counter() or time.perf_counter_ns() for nanosecond precision.
Read: “High Performance Python”, Chapter 2: “Profiling to Find Bottlenecks”
Q2: How do you ensure the “heartbeat” thread wakes up at precise intervals?
Hint
time.sleep(0.01) is not precise—it’s a minimum sleep time. The OS might wake your thread late. Use threading.Event.wait(timeout) and measure the actual wake time.
Read: “Using Asyncio in Python” by Caleb Hattingh, Chapter 2: “The Truth About Threads”
On Thread Synchronization
Q3: How do you safely start all threads at the same time to get a clean baseline?
Hint
Use a threading.Barrier to synchronize thread startup.
Read: Python documentation for threading.Barrier
Q4: How do you stop the heartbeat thread cleanly when the experiment ends?
Hint
Use a shared threading.Event as a shutdown signal.
Read: “Python Cookbook”, Recipe 12.2: “Terminating a Thread”
On Visualizing Results
Q5: How would you visualize the GIL contention over time?
Hint
Use matplotlib to create a timeline graph showing latency spikes.
Read: “Python Data Science Handbook” by Jake VanderPlas, Chapter 4: “Visualization with Matplotlib”
On Handling Different Workloads
Q6: What happens if you run this on a single-core machine?
Hint
You’ll still see latency spikes! The GIL makes time-slicing worse—even when the OS gives the heartbeat thread CPU time, it still has to wait for the GIL.
Read: “Modern Operating Systems”, Chapter 2.4: “Scheduling”
Q7: How would you modify this to test I/O-bound workloads?
Hint
Replace the CPU-bound worker with time.sleep(0.001) loops. You should see NO latency spikes—the GIL is released during sleep().
Read: “Fluent Python”, Chapter 19: “Concurrency Models in Python”
Thinking Exercise: Trace the GIL by Hand
Before you implement the monitor, work through this exercise on paper. This will build your mental model of how the GIL operates.
The Scenario
You have two threads executing this code:
# Thread 1: Heartbeat
def heartbeat():
    while True:
        time.sleep(0.01)  # 10ms target
        print("tick")

# Thread 2: Worker
def worker():
    total = 0
    for i in range(1000):
        total += i
Assume:
- GIL switch interval: 5ms (default)
- Each loop iteration in the worker takes 0.02ms of CPU time
- The OS schedules both threads on separate cores
Trace Through the Execution
Fill in this timeline (times are approximate):
Time (ms)  | Thread 1 (Heartbeat)        | Thread 2 (Worker)           | GIL Holder
───────────┼─────────────────────────────┼─────────────────────────────┼─────────────
0.00       | Created, waiting for GIL    | Created, waiting for GIL    | (None)
0.01       | Acquires GIL                | Waiting...                  | Thread 1
0.05       | Enters sleep(), RELEASES GIL| Waiting...                  | (Released)
0.06       | Sleeping (OS blocks thread) | Acquires GIL!               | Thread 2
???        | ???                         | ???                         | ???
Your task: Continue this timeline for 20ms. Answer:
- When does Thread 1 wake up from sleep?
- Can it immediately print “tick”, or must it wait for the GIL?
- How many loop iterations does Thread 2 complete before Thread 1 gets the GIL back?
- What is the latency of Thread 1’s first heartbeat?
Answer
Expected latency: 6.09ms (Thread 1 wakes at 10.01ms but waits until 10.08ms for GIL). Thread 2 completes ~250 iterations (5ms / 0.02ms per iteration) before releasing.
Read: “CPython Internals” by Anthony Shaw, Chapter 11: “Parallelism and Concurrency”
The Interview Questions They’ll Ask
After building this project, you should be able to answer these confidently. Practice explaining them out loud.
Question 1: The Classic
Q: “What is the GIL, and why does it exist?”
Expected Answer: The Global Interpreter Lock (GIL) is a mutex in CPython that prevents multiple threads from executing Python bytecode simultaneously. It exists because CPython uses reference counting for memory management, and without the GIL, concurrent modifications to reference counts would cause race conditions leading to memory corruption or leaks. Guido chose a single global lock over per-object locks because it made the single-threaded case faster and simplified C extension development.
Follow-up they’ll ask: “Why can’t CPython just remove the GIL?”
Answer: Removing it would require rewriting the memory management system, which would break backward compatibility with thousands of C extensions that assume the GIL exists. Attempts like Gilectomy showed that per-object locks make single-threaded Python significantly slower.
Question 2: The Practical One
Q: “When should I use threading vs. multiprocessing in Python?”
Expected Answer: Use threading for I/O-bound tasks (network requests, file I/O, database queries) because the GIL is released during I/O operations, allowing other threads to run. Use multiprocessing for CPU-bound tasks (heavy computation, data processing) because each process has its own GIL, enabling true parallel execution across multiple cores. The trade-off is that multiprocessing has higher overhead (memory, IPC serialization) and slower startup time.
Follow-up: “What about asyncio?”
Answer: Asyncio is best for high-concurrency I/O-bound workloads where you need to handle thousands of connections with minimal resource overhead. It’s single-threaded, so it’s not suitable for CPU-bound tasks, but it outperforms threading for I/O because there’s no thread context-switching overhead.
Question 3: The Debugging Scenario
Q: “Your web server is using threading to handle requests, but it’s slow under load. How would you diagnose if it’s GIL-related?”
Expected Answer: I would:
- Profile CPU usage—if one core is at 100% while others are idle, it’s likely GIL contention
- Check request latency distribution—high p99 latencies with low p50 suggest threads waiting for the GIL
- Use
sys._current_frames()to dump thread stacks and see if threads are blocked on the GIL - If confirmed, I’d identify CPU-bound code paths (using
cProfile) and either:- Move heavy computation to a C extension that releases the GIL
- Offload work to a multiprocessing pool
- Switch to an async framework if the bottleneck is I/O, not CPU
Question 4: The Deep Technical One
Q: “Explain what happens at the bytecode level when two threads try to increment the same variable.”
Expected Answer:
The operation x += 1 compiles to four bytecode instructions:
LOAD_NAME(read x)LOAD_CONST(load 1)BINARY_ADD(add them)STORE_NAME(write back to x)
Even though the GIL ensures only one thread executes bytecode at a time, the GIL can be released between any of these instructions. So if Thread A reads x=5 and then the GIL switches to Thread B, which also reads x=5, increments to 6, and writes back, then Thread A resumes and writes 6, you’ve lost one increment. This is why even with the GIL, you need locks or atomic operations for shared mutable state.
Follow-up: “How would you fix this?”
Answer: Use threading.Lock to make the increment atomic at the Python level, or use queue.Queue for thread-safe communication.
Question 5: The System Design One
Q: “You’re building a real-time analytics pipeline in Python. It needs to process 10,000 events per second. How would you architect it?”
Expected Answer: Given the GIL limitation, I’d use:
- Asyncio for I/O: Ingest events asynchronously (e.g., from Kafka, HTTP) using
asynciooraiohttp - Multiprocessing for computation: Spawn worker processes (using
multiprocessing.Pool) to process events in parallel - C extensions for hot paths: If profiling shows a specific calculation is the bottleneck, write it in C/Cython to bypass Python overhead
- Shared memory for IPC: Use
multiprocessing.shared_memoryor Redis to avoid pickling overhead when passing data between processes
I’d benchmark each layer to ensure I’m not over-engineering—if the processing is lightweight enough, even a single asyncio event loop might handle 10k/s.
Question 6: The “Why Not Other Languages” One
Q: “If the GIL is such a problem, why not just use Go or Java for concurrency?”
Expected Answer: Python’s ecosystem, productivity, and library support often outweigh the GIL’s limitations. For many real-world workloads (web servers, data pipelines), the bottleneck is I/O, not CPU, so the GIL doesn’t matter. When CPU parallelism is critical, you can use multiprocessing or C extensions. That said, there are cases (e.g., high-frequency trading, real-time systems) where Go’s goroutines or Java’s true multithreading are better choices. The right tool depends on the problem—Python excels at “glue code” and rapid development, not raw parallel compute.
Hints in Layers
If you get stuck during implementation, reveal these hints progressively. Don’t read them all at once—try to solve the problem first!
Hint 1: Getting Started (Architecture)
Click to reveal
Structure your program in three parts:
- Heartbeat Thread:
- Sleeps for a precise interval (e.g., 10ms)
- Records expected vs. actual wake time
- Calculates latency
- Worker Thread:
- Runs a CPU-bound loop (hashing, primes, etc.)
- Does NOT release the GIL
- Main Thread:
- Starts heartbeat in baseline mode (no worker)
- Starts worker after baseline is established
- Adjusts
sys.setswitchinterval()mid-run - Collects and prints statistics
Use threading.Thread for both threads, and threading.Event for synchronization.
Hint 2: Measuring Latency Accurately
Click to reveal
Don’t use time.sleep(0.01) naively!
import time

interval = 0.01  # Target 10ms
next_beat = time.perf_counter()

while True:
    # Calculate when the NEXT beat should occur
    next_beat += interval

    # Sleep until then
    now = time.perf_counter()
    sleep_duration = next_beat - now
    if sleep_duration > 0:
        time.sleep(sleep_duration)

    # Measure when we actually woke up
    actual_wake = time.perf_counter()
    latency = (actual_wake - next_beat) * 1000  # ms

    print(f"Expected: {next_beat:.2f} | Actual: {actual_wake:.2f} | Latency: {latency:.2f}ms")
This compensates for drift and measures the GIL wait time.
Hint 3: Creating a Good CPU Bottleneck
Click to reveal
Use a hashing loop that doesn’t release the GIL:
import hashlib

def cpu_intensive_task():
    data = b"x" * 1_000_000  # 1 MB
    for i in range(10_000):
        # SHA256 is CPU-intensive and doesn't release GIL
        hashlib.sha256(data).hexdigest()
Avoid:
time.sleep()(releases GIL)- File I/O (releases GIL)
- NumPy operations (releases GIL in C code)
You want pure Python bytecode that monopolizes the GIL.
Hint 4: Changing the GIL Switch Interval Mid-Run
Click to reveal
import sys
import time

# Start with default
print(f"Initial GIL switch interval: {sys.getswitchinterval()}s")

# Run experiment for 5 seconds
time.sleep(5)

# Change it
sys.setswitchinterval(0.001)  # 1ms (more responsive, lower throughput)
print(f"New GIL switch interval: {sys.getswitchinterval()}s")

# Run for another 5 seconds and compare latencies
You should see heartbeat latency drop, but worker throughput also decreases (measure with a counter).
Hint 5: Collecting and Displaying Statistics
Click to reveal
Store latencies in a list and compute statistics:
import statistics

latencies = []  # Collect all latencies here

# After experiment
print(f"Samples: {len(latencies)}")
print(f"Min latency: {min(latencies):.2f}ms")
print(f"Max latency: {max(latencies):.2f}ms")
print(f"Median latency: {statistics.median(latencies):.2f}ms")
print(f"Mean latency: {statistics.mean(latencies):.2f}ms")
print(f"Std dev: {statistics.stdev(latencies):.2f}ms")

# Bonus: Percentiles
latencies.sort()
p50 = latencies[len(latencies) // 2]
p99 = latencies[int(len(latencies) * 0.99)]
print(f"P50: {p50:.2f}ms | P99: {p99:.2f}ms")
This gives you a professional latency report.
Books That Will Help
This table maps specific topics to book chapters. Use it as a reference when you get stuck or want to dive deeper.
| Topic | Book | Chapter/Section | Why It Helps |
|---|---|---|---|
| GIL Internals | “CPython Internals” by Anthony Shaw | Ch. 11: “Parallelism and Concurrency” | Explains the C code behind GIL acquisition/release |
| GIL Behavior | “Fluent Python” by Luciano Ramalho | Ch. 19: “Concurrency Models in Python” | High-level explanation of when the GIL is released |
| Threading Basics | “Python Cookbook” by David Beazley | Ch. 12: “Concurrency”, Recipe 12.1-12.3 | Practical threading patterns and synchronization |
| Bytecode Execution | “CPython Internals” by Anthony Shaw | Ch. 7: “The Evaluation Loop” | How bytecode is executed and where the GIL checks happen |
| Thread Synchronization | “Python Cookbook” by David Beazley | Ch. 12, Recipe 12.4: “Locking Critical Sections” | Using Lock, Event, Barrier correctly |
| Profiling | “High Performance Python” by Gorelick & Ozsvald | Ch. 2: “Profiling to Find Bottlenecks” | How to use cProfile and line_profiler |
| Timing Precision | “High Performance Python” by Gorelick & Ozsvald | Ch. 2: “The timeit Module” |
Why time.perf_counter() is better than time.time() |
| OS Scheduling | “Modern Operating Systems” by Andrew Tanenbaum | Ch. 2.4: “Scheduling” | How the OS schedules threads (context for GIL behavior) |
| Reference Counting | “CPython Internals” by Anthony Shaw | Ch. 10: “Memory Management” | Why the GIL exists to protect ob_refcnt |
| Multiprocessing vs Threading | “High Performance Python” by Gorelick & Ozsvald | Ch. 9: “The Multiprocessing Module” | When to use each approach |
| Asyncio Comparison | “Using Asyncio in Python” by Caleb Hattingh | Ch. 2: “The Truth About Threads” | Why asyncio avoids GIL contention for I/O |
Project 2: Parallel Fractal Renderer (Multiprocessing)
- File: PYTHON_PERFORMANCE_AND_SCALING_MASTERY.md
- Main Programming Language: Python
- Alternative Programming Languages: Rust (via PyO3)
- Coolness Level: Level 5: Pure Magic
- Business Potential: 2. The “Micro-SaaS”
- Difficulty: Level 3: Advanced
- Knowledge Area: Parallel Computing / Graphics
- Software or Tool:
multiprocessing,Pillow(PIL) - Main Book: “High Performance Python” by Gorelick & Ozsvald
What you’ll build: A Mandelbrot fractal renderer that splits the image into chunks and renders them in parallel across all CPU cores, comparing the speedup against a single-threaded version.
Why it teaches Python Performance: This is the cure for the GIL. You’ll learn how to bypass the lock by spawning entirely separate processes, and you’ll grapple with the overhead of Inter-Process Communication (IPC).
Core challenges you’ll face:
- Load Balancing → How do you split work if some parts of the fractal take longer to calculate?
- IPC Overhead → Passing large images between processes is slow. How do you use
SharedMemory? - Process Pool Management → Understanding the difference between
spawn,fork, andforkserver.
Key Concepts:
- Amdahl’s Law: The theoretical limit of speedup.
- SharedMemory (PEP 574): Efficiently sharing data without serialization (pickle).
- Process Pickling: Why some objects can’t be sent to another process.
Real World Outcome
A CLI tool that renders a 4K fractal. You will see a near-linear speedup as you add cores (e.g., a 4-core machine rendering ~4x faster than 1 core).
Example Output:
$ python mandelbrot.py --cores 1 --size 4000x4000
[Setup] Initializing single-threaded renderer...
[Setup] Image dimensions: 4000x4000 (16,000,000 pixels)
[Setup] Max iterations: 256
[Render] Computing fractal...
[Progress] ████████████████████████████████████ 100% | 16.0M pixels
[Complete] Render time: 45.2 seconds
[Output] Saved to: mandelbrot_4000x4000_1core.png
[Stats] Throughput: 353,982 pixels/second

$ python mandelbrot.py --cores 8 --size 4000x4000
[Setup] Initializing multiprocessing renderer...
[Setup] Image dimensions: 4000x4000 (16,000,000 pixels)
[Setup] Max iterations: 256
[Setup] Process pool: 8 workers
[Setup] Chunk strategy: Dynamic load balancing (256 chunks)
[Setup] IPC method: SharedMemory (zero-copy)
[Render] Distributing work to 8 processes...
[Progress] Core 0: ████░░░░ 50% | Core 1: ████████ 100%
[Progress] Core 2: ██████░░ 75% | Core 3: ████████ 100%
[Progress] Core 4: ████░░░░ 50% | Core 5: ██████░░ 75%
[Progress] Core 6: ████████ 100% | Core 7: ████████ 100%
[Progress] ████████████████████████████████████ 100% | 16.0M pixels
[Complete] Render time: 6.1 seconds
[Output] Saved to: mandelbrot_4000x4000_8core.png
[Stats] Throughput: 2,622,951 pixels/second
[Stats] Speedup: 7.41x (Efficiency: 92.6%)
[Stats] Overhead: Process spawn (0.3s) + IPC (0.1s) = 0.4s (6.5% of total)
[Analysis] Amdahl's Law prediction: 7.78x (within 5% of actual)
[Analysis] Near-optimal scaling achieved!

$ python mandelbrot.py --cores 1 --cores 2 --cores 4 --cores 8 --benchmark
[Benchmark] Running comparative analysis...
╔═══════╦═══════════════╦═════════════╦════════════╦═════════════╗
║ Cores ║ Render Time   ║ Speedup     ║ Efficiency ║ Overhead    ║
╠═══════╬═══════════════╬═════════════╬════════════╬═════════════╣
║   1   ║  45.2s        ║  1.00x      ║  100.0%    ║  0.0s (0%)  ║
║   2   ║  23.5s        ║  1.92x      ║   96.2%    ║  0.3s (1%)  ║
║   4   ║  12.1s        ║  3.74x      ║   93.4%    ║  0.4s (3%)  ║
║   8   ║   6.1s        ║  7.41x      ║   92.6%    ║  0.4s (7%)  ║
╚═══════╩═══════════════╩═════════════╩════════════╩═════════════╝
[Analysis] Strong scaling observed up to 8 cores.
[Warning] Beyond 8 cores, overhead may exceed benefits for this problem size.
The Core Question You’re Answering
“When is the cost of starting a new process and moving data higher than the time saved by parallel execution?”
Multiprocessing isn’t free. You pay in RAM and startup time. You need to find the “Goldilocks zone” where the task is heavy enough to justify the overhead.
Concepts You Must Understand First
Before writing any multiprocessing code, you need to deeply understand these foundational concepts:
1. Process Creation Overhead (fork vs spawn vs forkserver)
The Three Process Start Methods:
| Method | How It Works | Speed | Memory | Platform | Use Case |
|---|---|---|---|---|---|
| fork | Clones entire parent process using Copy-on-Write (COW) | Fast (1-2ms) | Efficient (COW) | Unix only | Default on Linux/macOS. Fast startup, but can inherit unwanted state (file handles, locks). |
| spawn | Starts fresh Python interpreter | Slow (50-100ms) | High (fresh interpreter) | All platforms | Default on Windows. Clean state, but slow startup and high memory. |
| forkserver | Pre-spawned server forks on demand | Medium (5-10ms) | Medium | Unix only | Compromise: cleaner than fork, faster than spawn. |
Book Reference: “High Performance Python” by Gorelick & Ozsvald — Ch. 9: “The multiprocessing Module”
Why This Matters: If your task takes only 10ms to compute, but spawning the process takes 100ms, you’ve made your program 10x slower!
import multiprocessing as mp
import time

def tiny_task(x):
    return x * 2

# On Windows (spawn): 100ms overhead + 1ms work = 101ms
# On Linux (fork): 2ms overhead + 1ms work = 3ms
# Lesson: Small tasks should NOT use multiprocessing!
2. Inter-Process Communication (IPC) Mechanisms
How Processes Share Data:
Parent Process                    Child Process
┌──────────────┐                 ┌──────────────┐
│ Python VM 1  │                 │ Python VM 2  │
│              │                 │              │
│ data = [1,2] │                 │ data = ???   │
└──────┬───────┘                 └───────▲──────┘
       │                                 │
       │  ❌ NO SHARED MEMORY SPACE      │
       │                                 │
       └─────────── IPC Method ──────────┘
              (pickle/pipe/queue)
IPC Options:
| Method | How It Works | Speed | Max Size | Serialization |
|---|---|---|---|---|
| Queue | FIFO pipe with automatic locking | Medium | Unlimited | pickle (slow for large objects) |
| Pipe | Two-way communication channel | Fast | 32MB (Linux) | pickle |
| SharedMemory | Direct memory mapping between processes | Very Fast | RAM limited | None (raw bytes) |
| Manager | Proxy server for shared objects | Slow | Unlimited | pickle + network overhead |
Book Reference: “Python Cookbook” by Beazley & Jones — Ch. 12.3: “Communicating Between Threads”
Critical Insight: Pickle serialization is expensive! For a 100MB NumPy array:
Queue.put(): ~500ms (serialize + copy + deserialize)SharedMemory: ~5ms (zero-copy, just map memory)
3. SharedMemory and Memory-Mapped Files
The Zero-Copy Technique (Python 3.8+):
from multiprocessing import shared_memory
import numpy as np

# Parent process
shm = shared_memory.SharedMemory(create=True, size=1000000)
arr = np.ndarray((1000, 1000), dtype=np.uint8, buffer=shm.buf)

# Child process (in another Python VM!)
existing_shm = shared_memory.SharedMemory(name=shm.name)
arr = np.ndarray((1000, 1000), dtype=np.uint8, buffer=existing_shm.buf)
# arr now points to THE SAME MEMORY as the parent process!
How It Works Under the Hood:
Physical RAM
┌────────────────────────────────────┐
│  Shared Memory Block (1MB)         │
│  ┌──────────────────────────────┐  │
│  │  [1, 2, 3, 4, 5, ...]        │  │
│  └──────────────────────────────┘  │
└───────────▲────────────▲───────────┘
            │            │
   ┌────────┘            └────────┐
   │                              │
Process A's                  Process B's
Virtual Memory               Virtual Memory
Book Reference: “Linux Programming Interface” by Kerrisk — Ch. 54: “POSIX Shared Memory”
Danger Zone: Shared memory has NO locks! You must manually synchronize access or face race conditions.
4. Process Pool Management
Pool Lifecycle:
from multiprocessing import Pool

# 1. Pool Creation (EXPENSIVE: spawns N processes)
pool = Pool(processes=4)  # 200-400ms startup cost!

# 2. Task Submission (CHEAP: just puts task in queue)
results = pool.map(heavy_function, data)  # <1ms per task

# 3. Pool Destruction (IMPORTANT: must cleanup!)
pool.close()   # No more tasks accepted
pool.join()    # Wait for all tasks to finish
# If you skip this, zombie processes will leak!
Book Reference: “High Performance Python” by Gorelick & Ozsvald — Ch. 9.2: “Using Pool for Parallel Processing”
Best Practice: Use with statement to guarantee cleanup:
with Pool(processes=4) as pool:
    results = pool.map(func, data)
# pool.close() and pool.join() called automatically
5. Amdahl’s Law: The Mathematical Reality Check
The Formula:
Speedup = 1 / (S + (P / N))

Where:
  S = Serial portion (cannot be parallelized)
  P = Parallel portion (can be parallelized)
  N = Number of processors
  S + P = 1 (100% of the program)
Concrete Example: Fractal Rendering
Your program:
  - Setup (load config, allocate memory): 1 second (SERIAL)
  - Compute pixels: 99 seconds (PARALLEL)
  - Save image to disk: 0 seconds (negligible)

Total: 100 seconds on 1 core

Theoretical speedup with 8 cores:
  S = 0.01 (1% serial)
  P = 0.99 (99% parallel)
  N = 8

  Speedup = 1 / (0.01 + 0.99/8)
          = 1 / (0.01 + 0.124)
          = 1 / 0.134
          = 7.46x

Maximum speedup: 7.46x (NOT 8x!)
Book Reference: “Computer Architecture: A Quantitative Approach” by Hennessy & Patterson — Ch. 1.9: “Fallacies and Pitfalls”
Reality Check: Amdahl’s Law is optimistic! It assumes:
- Zero IPC overhead (FALSE)
- Perfect load balancing (RARELY TRUE)
- No memory contention (FALSE on shared memory systems)
Actual speedup is usually 80-90% of Amdahl’s prediction.
Questions to Guide Your Design
Before you write a single line of code, answer these questions on paper:
1. How do you split work evenly when computation varies?
The Problem: The edge of the Mandelbrot set takes 256 iterations per pixel. The interior takes 1 iteration. If you split the image into equal-sized chunks:
Chunk 1 (left edge):  ████████████████████████ 24 seconds
Chunk 2 (interior):   ██ 2 seconds
Chunk 3 (right edge): ████████████████████████ 24 seconds
Chunk 4 (interior):   ██ 2 seconds

Total time: 24 seconds (worst chunk determines total time!)
Speedup: 100s / 24s = 4.2x (ONLY 50% efficiency on 8 cores!)
Better Approach: Dynamic Load Balancing
# BAD: Static chunks (uneven work)
chunks = np.array_split(pixels, num_cores)

# GOOD: Many small chunks (workers grab next chunk when idle)
chunks = np.array_split(pixels, num_cores * 32)
# Now if one chunk is slow, other workers keep busy!
Trade-off: More chunks = better balancing, but more overhead.
Question for You: How many chunks is optimal for a 4000x4000 image on 8 cores? (Hint: Measure overhead vs balance!)
2. How do you minimize data transfer between processes?
The Anti-Pattern:
# TERRIBLE: Sending 48MB back and forth!
def render_chunk(params):
    x_min, x_max, y_min, y_max, width, height = params
    result = np.zeros((height, width), dtype=np.uint8)
    # ... compute ...
    return result  # 48MB serialized via pickle! 500ms overhead!

with Pool(8) as pool:
    results = pool.map(render_chunk, chunks)
    # Total IPC time: 500ms * 8 = 4 seconds wasted!
Better Pattern: Shared Memory
# GOOD: Workers write directly to shared buffer
shm = shared_memory.SharedMemory(create=True, size=width*height)
image = np.ndarray((height, width), dtype=np.uint8, buffer=shm.buf)

def render_chunk_inplace(params):
    x_min, x_max, y_min, y_max, shm_name = params
    shm = shared_memory.SharedMemory(name=shm_name)
    image = np.ndarray((height, width), dtype=np.uint8, buffer=shm.buf)
    # Write directly to shared memory!
    for y in range(y_min, y_max):
        for x in range(x_min, x_max):
            image[y, x] = compute_pixel(x, y)
    # No return statement! No IPC overhead!

# Total IPC time: ~0ms!
Question for You: What’s the danger of shared memory? (Hint: Race conditions if two processes write to same pixel!)
3. When should you use Pool vs individual Processes?
| Use Case | Pool | Process |
|---|---|---|
| Many similar tasks | ✓ (map/starmap) | ✗ (too much boilerplate) |
| Tasks with different signatures | ✗ (all tasks must use same function) | ✓ |
| Long-running workers | ✗ (pool overhead on each task) | ✓ (spawn once, run forever) |
| Need result ordering | ✓ (map preserves order) | ✗ (manual tracking) |
Example: Pool for batch jobs, Process for server workers.
4. How do you handle worker crashes?
The Problem: If a worker process crashes (segfault in C extension, OOM, etc.), your program hangs forever waiting for a result that will never come.
Solution: Timeouts and Error Handling
from multiprocessing import Pool, TimeoutError

with Pool(8) as pool:
    try:
        results = pool.map_async(func, data).get(timeout=300)  # 5min max
    except TimeoutError:
        print("Workers timed out! Killing pool...")
        pool.terminate()  # Force-kill all workers
        pool.join()
Question for You: What happens to partial results if you terminate the pool? (Hint: They’re lost! You need checkpointing.)
Thinking Exercise
Before writing code, work through this exercise by hand:
Exercise: Calculate Theoretical Speedup
Given:
- Task: Render 1,000,000 pixels
- Single-threaded performance: 10,000 pixels/second
- Total time on 1 core: 100 seconds
- Overhead per process: 50ms startup + 10ms per data transfer
- Available cores: 4
Questions:
- If you split into 4 chunks (one per core), what is the theoretical speedup?
- What is the actual speedup accounting for overhead?
- If you split into 16 chunks (4 chunks per core), how does overhead change?
- What is the minimum task size where multiprocessing breaks even (speedup > 1.0)?
Answers (work these out yourself first!):
Click to reveal answers
- Theoretical (no overhead):
- Each core processes 250,000 pixels
- Time per core: 250,000 / 10,000 = 25 seconds
- Speedup: 100 / 25 = 4.0x (perfect linear scaling)
- Actual (with overhead):
- Startup: 4 processes × 50ms = 200ms
- Data transfer: 4 chunks × 10ms = 40ms
- Total overhead: 240ms
- Compute time: 25 seconds
- Total time: 25.24 seconds
- Speedup: 100 / 25.24 = 3.96x (99% efficiency)
- With 16 chunks:
- Startup: still 200ms (same 4 processes)
- Data transfer: 16 chunks × 10ms = 160ms
- Compute: still ~25s (better load balancing, slight improvement)
- Total overhead: 360ms (higher, but better balancing may compensate)
- Break-even calculation:
- Process overhead: 50ms + 10ms = 60ms
- Break-even: compute_time > overhead × (N - 1)
- For 4 cores: compute_time > 60ms × 3 = 180ms
- Minimum pixels: 180ms × 10,000 px/s = 1,800 pixels
- Rule of thumb: Task should be at least 10x the overhead!
Code Analysis Exercise
Analyze this code and identify the performance bugs:
from multiprocessing import Pool
import numpy as np

def process_image(image_data):
    # Bug 1: Where is the bug here?
    result = expensive_computation(image_data)
    return result

def main():
    images = [load_image(f'img{i}.png') for i in range(100)]

    # Bug 2: What's wrong with this pool usage?
    for img in images:
        pool = Pool(4)
        result = pool.apply(process_image, (img,))
        pool.close()
        pool.join()
        save_result(result)

# Bug 3: What happens to memory here?
def expensive_computation(data):
    big_array = np.zeros((10000, 10000))  # 800MB!
    # ... computation ...
    return big_array
Click to reveal bugs
Bug 1: expensive_computation creates an 800MB array that gets pickled and sent back to parent. IPC overhead: ~3 seconds per task!
Fix: Use SharedMemory or return only the small result.
Bug 2: Creating a new pool for EACH image! Pool creation costs ~200ms, and you’re processing 100 images sequentially instead of in parallel!
Fix:
with Pool(4) as pool:
    results = pool.map(process_image, images)  # Parallel processing!
Bug 3: Each worker allocates 800MB. With 4 workers, that’s 3.2GB RAM! If your machine has 8GB, you’re swapping to disk.
Fix: Preallocate shared memory or process smaller chunks.
The Interview Questions They’ll Ask
1. “Explain the difference between fork, spawn, and forkserver. When would you use each?”
Expected Answer:
- Fork: Fast Copy-on-Write cloning. Use on Linux/macOS for heavy tasks where startup overhead matters. Risk: inherits parent’s state (file descriptors, locks).
- Spawn: Clean slate, fresh interpreter. Use on Windows or when you need guaranteed clean state. Cost: 50-100ms startup.
- Forkserver: Compromise. Use when you need clean state but can’t afford spawn’s overhead. Available on Unix only.
Follow-up: “What happens if you fork() while holding a lock in the parent process?” (Answer: Deadlock! Child inherits locked state.)
2. “How does SharedMemory avoid serialization overhead? What’s the trade-off?”
Expected Answer: SharedMemory uses OS-level memory mapping (mmap) to allow multiple processes to access the same physical memory. No pickle serialization needed—just map bytes to Python objects (like NumPy arrays).
Trade-off: No automatic synchronization! You must use locks (Lock, RLock) to prevent race conditions. Also, only raw bytes are shared—complex Python objects don’t work.
3. “You have an 8-core machine. Your multiprocessing code achieves only 3x speedup. Walk me through how you’d debug this.”
Expected Answer (structured debugging):
- Measure serial fraction: Profile to find non-parallelized code.
# Use cProfile to identify bottlenecks python -m cProfile -s cumulative script.py - Check process overhead: Time the pool creation.
start = time.time() pool = Pool(8) print(f"Pool creation: {time.time() - start}s") - Measure IPC costs: Log data transfer times.
# If using Queue/Pipe, measure .get()/.send() times - Verify load balancing: Check if some processes finish way before others.
# Log per-process completion times - Check CPU usage: Use
htopto see if all cores are 100%.- If not, you’re probably bottlenecked by I/O or GIL (using threads instead of processes?)
- Apply Amdahl’s Law: Calculate theoretical max speedup. If you’re close, overhead is the issue. If you’re far, serial code is the issue.
4. “What is the Global Interpreter Lock, and how does multiprocessing bypass it?”
Expected Answer: The GIL is a mutex in CPython that ensures only one thread executes Python bytecode at a time. It exists to simplify memory management (reference counting).
Multiprocessing bypasses the GIL by creating separate Python interpreter processes. Each process has its own GIL, so they can run truly in parallel on multiple cores. The cost is IPC overhead and higher memory usage.
Follow-up: “Why not just remove the GIL?” (Answer: Backward compatibility. Removing GIL makes single-threaded code ~30% slower. See PEP 703 for ongoing work on “no-GIL Python”.)
5. “Your worker processes are leaking memory. How do you diagnose and fix it?”
Expected Answer:
- Diagnose:
import psutil, os process = psutil.Process(os.getpid()) print(f"Memory: {process.memory_info().rss / 1024**2} MB") - Common causes:
- Forgot to close SharedMemory:
shm.close()andshm.unlink() - Circular references preventing garbage collection
- Large objects cached in worker state
- Forgot to close SharedMemory:
- Fix: Use
maxtasksperchildto restart workers periodically:pool = Pool(processes=8, maxtasksperchild=100) # Each worker processes max 100 tasks, then respawns fresh
6. “Explain Amdahl’s Law and its implications for parallelism.”
Expected Answer:
Amdahl’s Law states that speedup is limited by the serial portion of your program. Formula: Speedup = 1 / (S + P/N).
Implication: If 10% of your code is serial, maximum speedup is 10x, even with infinite cores.
Example: If your program is 5% serial, max speedup on 100 cores is only 20x, not 100x.
Practical takeaway: Focus on parallelizing the biggest bottlenecks first (Pareto principle).
Hints in Layers
Work through these hints only if you’re stuck. Try each level before peeking at the next!
Level 1: High-Level Architecture Hint
Click to reveal
Your fractal renderer should have three phases:
- Setup: Create SharedMemory buffer for the image
- Compute: Split image into chunks, distribute to workers
- Teardown: Wait for workers, save image, cleanup SharedMemory
Use Pool.map() for simplicity, but pass SharedMemory name (string) to workers, not the data itself.
Level 2: Work Distribution Hint
Click to reveal
Don’t split by columns or rows—split by rectangular tiles! Why? Better cache locality.
# GOOD: 8x8 tiles (64 chunks for 8 cores)
chunk_size = image_width // 8
chunks = [
    (x, y, x + chunk_size, y + chunk_size)
    for y in range(0, height, chunk_size)
    for x in range(0, width, chunk_size)
]

# Rule: num_chunks should be 4-8x the number of cores
This allows dynamic load balancing—fast chunks finish early, workers grab more work.
Level 3: SharedMemory Implementation Hint
Click to reveal
Worker function signature:
def render_chunk(args):
    x_min, x_max, y_min, y_max, width, height, shm_name, max_iter = args

    # Attach to shared memory
    shm = shared_memory.SharedMemory(name=shm_name)
    image = np.ndarray((height, width), dtype=np.uint8, buffer=shm.buf)

    # Compute Mandelbrot for this chunk
    for py in range(y_min, y_max):
        for px in range(x_min, x_max):
            # Map pixel to complex plane
            x0 = (px / width) * 3.5 - 2.5
            y0 = (py / height) * 2.0 - 1.0

            # Mandelbrot iteration
            x, y, iteration = 0.0, 0.0, 0
            while x*x + y*y <= 4 and iteration < max_iter:
                xtemp = x*x - y*y + x0
                y = 2*x*y + y0
                x = xtemp
                iteration += 1

            # Write directly to shared memory (NO RETURN!)
            image[py, px] = iteration

    # Don't return anything—data is already in shared memory!
    shm.close()  # Detach (but don't unlink—parent owns it)
Level 4: Benchmarking Hint
Click to reveal
Measure overhead accurately:
import time

# Baseline: single-threaded
start = time.perf_counter()
render_single_threaded()
baseline_time = time.perf_counter() - start

# Multiprocessing: separate overhead from compute
start_total = time.perf_counter()

start_setup = time.perf_counter()
pool = Pool(num_cores)
shm = create_shared_memory()
setup_time = time.perf_counter() - start_setup

start_compute = time.perf_counter()
pool.map(render_chunk, chunks)
compute_time = time.perf_counter() - start_compute

start_teardown = time.perf_counter()
pool.close()
pool.join()
shm.unlink()
teardown_time = time.perf_counter() - start_teardown

total_time = time.perf_counter() - start_total

print(f"Overhead: {setup_time + teardown_time:.3f}s")
print(f"Speedup: {baseline_time / total_time:.2f}x")
print(f"Efficiency: {(baseline_time / total_time) / num_cores * 100:.1f}%")
Level 5: Debugging Hint
Click to reveal
Common issues and fixes:
- “Speedup is only 2x on 8 cores!”
- Check: Are you splitting into only 8 chunks? Make it 64+ chunks for better load balancing.
- Check: Is image data being copied back? Use SharedMemory with no return statement.
- “Process hangs forever!”
- Check: Did you call
pool.close()andpool.join()? - Check: Are workers crashing silently? Add try-except in worker function.
- Check: Did you call
- “Memory leak! RSS growing!”
- Check: Did you call
shm.unlink()in the parent after joining? - Check: Are workers calling
shm.close()(not unlink—only parent unlinks)?
- Check: Did you call
- “Speedup gets worse with more cores!”
- You’ve hit overhead threshold. Check process creation time. Use
forkinstead ofspawnon Unix.
- You’ve hit overhead threshold. Check process creation time. Use
Books That Will Help
| Concept | Book | Chapter | What You’ll Learn |
|---|---|---|---|
| Process Creation | “High Performance Python” by Gorelick & Ozsvald | Ch. 9: The multiprocessing Module | Deep dive into fork/spawn trade-offs, when to use each. |
| Amdahl’s Law | “Computer Architecture: A Quantitative Approach” by Hennessy & Patterson | Ch. 1.9: Fallacies and Pitfalls | Mathematical framework for predicting speedup limits. |
| SharedMemory | “Python Cookbook” by Beazley & Jones | Ch. 12.8: Creating a Thread Pool | How to use SharedMemory for zero-copy IPC. |
| IPC Mechanisms | “Linux Programming Interface” by Kerrisk | Ch. 44: Pipes and FIFOs | Low-level understanding of how pipes/queues work in OS. |
| Load Balancing | “Introduction to Parallel Computing” by Grama et al. | Ch. 3.3: Dynamic Load Balancing | Strategies for work distribution in parallel systems. |
| Process Pools | “Parallel Programming with Python” by Jan Palach | Ch. 2: Process-Based Parallelism | Practical patterns for Pool usage in real applications. |
| Debugging Parallel Code | “The Art of Multiprocessor Programming” by Herlihy & Shavit | Ch. 3: Mutual Exclusion | Understanding race conditions and synchronization bugs. |
Essential Reading Order:
- Start with “High Performance Python” Ch. 9 for practical Python multiprocessing.
- Read Hennessy & Patterson Ch. 1.9 for theoretical foundation (Amdahl’s Law).
- Deep-dive into Kerrisk’s “Linux Programming Interface” Ch. 44 if you want to understand IPC at the system call level.
Bonus: PEP 371 (multiprocessing module design), PEP 574 (pickle protocol 5 with out-of-band data) for historical context.
Project 3: The Asyncio “Storm” (High-Concurrency Scraper)
- File: PYTHON_PERFORMANCE_AND_SCALING_MASTERY.md
- Main Programming Language: Python
- Alternative Programming Languages: Go (for comparison)
- Coolness Level: Level 3: Genuinely Clever
- Business Potential: 4. The “Open Core” Infrastructure
- Difficulty: Level 2: Intermediate
- Knowledge Area: Network I/O / Async
- Software or Tool:
asyncio,aiohttp,uvloop - Main Book: “Using Asyncio in Python” by Caleb Hattingh
What you’ll build: A web scraper capable of fetching 1,000+ URLs concurrently without spawning 1,000 threads. It will include rate limiting, retry logic, and a real-time progress dashboard.
Why it teaches Python Performance: You’ll learn the power of the Event Loop. You’ll see why a single thread can outperform 100 threads for network-bound tasks because it doesn’t waste time on context switching.
Core challenges you’ll face:
- Managing Flow Control → How do you prevent your script from overwhelming the OS with too many open sockets?
- Exception Aggregation → Handling 100 different failures simultaneously using
asyncio.gatherorTaskGroups. - Replacing the Loop → Using
uvloop(written in Cython) to speed up the event loop itself.
Real World Outcome
A scraper that handles thousands of requests in seconds, with a live display of active tasks and throughput.
Example Output:
$ python storm_scraper.py urls.txt --limit 100
[Active] 100 | [Success] 450 | [Error] 2 | [Throughput] 85 req/s
[Active] 100 | [Success] 750 | [Error] 5 | [Throughput] 92 req/s
[Rate Limit] Backing off on domain: api.example.com (429 status)
[Retry] Retrying failed request (Attempt 2/3) - timeout on slow-server.net
...
Scan complete. 1000 URLs in 12.1s.
(Compare to threaded scraper: 45.3s)

Performance Breakdown:
├─ Mean Response Time: 145ms
├─ Fastest Response: 23ms
├─ Slowest Response: 4.2s
├─ Timeouts: 8
├─ Retries: 15
└─ Peak Concurrent Tasks: 100
With uvloop optimization:
$ python storm_scraper.py urls.txt --limit 100 --uvloop
Scan complete. 1000 URLs in 8.3s (45% faster!)
The Core Question You’re Answering
“How can a single thread handle 10,000 connections when 10,000 threads would crash the system?”
This is the fundamental insight of async programming. Threads are expensive (each consumes ~8MB of stack space and requires OS context switching). The event loop is cheap (one thread, minimal overhead, cooperative switching).
The Mental Model Shift:
- Threaded thinking: “I need 100 workers to fetch 100 URLs simultaneously.”
- Async thinking: “I need 1 worker that can juggle 100 waiting tasks and resume each when I/O completes.”
Concepts You Must Understand First
Before writing async code, internalize these foundational concepts:
1. Event Loops and the Reactor Pattern
The event loop is a design pattern where a single thread continuously polls for I/O readiness and dispatches work.
Book Reference: “Using Asyncio in Python” by Caleb Hattingh — Ch. 1: “Introducing Asyncio”
Key Insight: The loop uses system calls (select, poll, epoll, kqueue) to monitor file descriptors. When data is ready, it wakes up the suspended coroutine.
2. Coroutines vs Generators
Python’s async def creates a coroutine — a function that can pause (with await) and resume.
Book Reference: “Fluent Python” by Luciano Ramalho — Ch. 18: “Concurrency with Asyncio”
Key Insight: Generators (yield) and coroutines (await) both create suspendable functions, but coroutines are part of the asyncio protocol and can only be awaited, not iterated.
3. select/poll/epoll/kqueue System Calls
These are OS-level APIs for monitoring multiple file descriptors.
Book Reference: “The Linux Programming Interface” by Michael Kerrisk — Ch. 63: “Alternative I/O Models”
Key Insight:
select: Original, limited to 1024 file descriptorspoll: No FD limit, but O(n) scanningepoll(Linux): O(1) event notification, scales to millions of connectionskqueue(BSD/macOS): Similar to epoll
4. Non-blocking I/O
When you call socket.recv() on a blocking socket, the thread stops until data arrives. Non-blocking sockets return immediately with EWOULDBLOCK if no data is ready.
Book Reference: “Unix Network Programming” by Stevens — Ch. 16: “Nonblocking I/O”
Key Insight: Asyncio sets sockets to non-blocking mode and uses the event loop to retry reads when the OS signals readiness.
5. Backpressure and Flow Control
When a producer creates data faster than a consumer can process it, you get memory bloat. Backpressure mechanisms pause the producer.
Book Reference: “Using Asyncio in Python” by Caleb Hattingh — Ch. 5: “Streams and Protocols”
Key Insight: asyncio.Queue with maxsize, semaphores, and drain() on writers are tools for implementing backpressure.
Questions to Guide Your Design
Don’t jump into coding. First answer these architectural questions:
- How do you limit concurrent connections?
- Use
asyncio.Semaphore(100)to cap the number of simultaneous requests - Should the limit be global or per-domain?
- Use
- How do you handle timeouts gracefully?
asyncio.wait_for(coro, timeout=5.0)raisesTimeoutError- Should timeouts cancel the request or count as errors?
- How do you aggregate errors from many tasks?
asyncio.gather(*tasks, return_exceptions=True)collects all results- Should one failure stop all tasks or continue scraping?
- How do you implement retry logic?
- Exponential backoff:
wait_time = base ** attempt(e.g., 1s, 2s, 4s, 8s) - Should retries share the same semaphore slot?
- Exponential backoff:
- How do you display real-time progress?
- Use a separate
asyncio.Taskthat reads from a shared counter - Should you use
print()or a library likerichfor terminal UI?
- Use a separate
Thinking Exercise
Trace the execution: Imagine this simplified async code. Draw what happens step-by-step as the event loop runs.
import asyncio

async def fetch_url(url_id):
    print(f"[{url_id}] Starting request")
    await asyncio.sleep(0.5)  # Simulates network I/O
    print(f"[{url_id}] Request complete")
    return f"Data from {url_id}"

async def main():
    tasks = [fetch_url(i) for i in range(3)]
    results = await asyncio.gather(*tasks)
    print(f"Results: {results}")

asyncio.run(main())
Manual Trace (Time in seconds):
t=0.00: Event loop starts
t=0.00: main() creates 3 coroutines (they don't run yet)
t=0.00: gather() schedules all 3 tasks
t=0.00: Task 0 runs: prints "[0] Starting request", hits await sleep(0.5)
t=0.00: Task 0 PAUSES, event loop switches to Task 1
t=0.00: Task 1 runs: prints "[1] Starting request", hits await sleep(0.5)
t=0.00: Task 1 PAUSES, event loop switches to Task 2
t=0.00: Task 2 runs: prints "[2] Starting request", hits await sleep(0.5)
t=0.00: Task 2 PAUSES, event loop has nothing ready to run
t=0.00-0.50: Event loop WAITS (using epoll/kqueue) for timer events
t=0.50: Timer for Task 0 fires, Task 0 resumes
t=0.50: Task 0 prints "[0] Request complete", returns result
t=0.50: Timer for Task 1 fires, Task 1 resumes
t=0.50: Task 1 prints "[1] Request complete", returns result
t=0.50: Timer for Task 2 fires, Task 2 resumes
t=0.50: Task 2 prints "[2] Request complete", returns result
t=0.50: gather() collects all results
t=0.50: main() prints "Results: ['Data from 0', 'Data from 1', 'Data from 2']"
Key Observation: All three “requests” ran in 0.5 seconds, not 1.5 seconds, because they paused concurrently.
The Interview Questions They’ll Ask
- “What is the difference between
threadingandasyncio?” - “How does the event loop know when a socket is ready for reading without blocking?”
- “What happens if you run a CPU-bound function (like
math.factorial) inside anasync deffunction?” - “What is
uvloopand why is it faster than the defaultasyncioloop?”
Hints in Layers
If you’re stuck implementing the high-concurrency scraper, reveal these hints progressively:
Hint 1: Start with a Semaphore
You can’t just create 10,000 tasks at once or your OS will run out of file descriptors.
import asyncio

semaphore = asyncio.Semaphore(100)  # Max 100 concurrent requests

async def fetch_with_limit(session, url):
    async with semaphore:
        async with session.get(url) as response:
            return await response.text()
Hint 2: Use asyncio.gather() with return_exceptions=True
This prevents one failed request from canceling all others.
results = await asyncio.gather(*tasks, return_exceptions=True)
for i, result in enumerate(results):
    if isinstance(result, Exception):
        print(f"Task {i} failed: {result}")
Hint 3: Implement Exponential Backoff for Retries
If a request fails, don’t retry immediately. Wait longer each time.
async def fetch_with_retry(session, url, max_retries=3):
    for attempt in range(max_retries):
        try:
            async with session.get(url, timeout=5) as response:
                return await response.text()
        except (asyncio.TimeoutError, aiohttp.ClientError) as e:
            if attempt == max_retries - 1:
                raise
            wait_time = 2 ** attempt  # 1s, 2s, 4s
            await asyncio.sleep(wait_time)
Hint 4: Use aiohttp.ClientSession with Connection Pooling
Creating a new connection for each request is slow. Reuse connections.
async def main(urls):
    connector = aiohttp.TCPConnector(limit=100, limit_per_host=10)
    async with aiohttp.ClientSession(connector=connector) as session:
        tasks = [fetch_url(session, url) for url in urls]
        return await asyncio.gather(*tasks)
Hint 5: Add a Real-Time Progress Display
Use a background task to print stats every second.
from collections import Counter

stats = Counter()

async def progress_monitor():
    while True:
        print(f"[Active] {stats['active']} | [Success] {stats['success']} | [Error] {stats['error']}")
        await asyncio.sleep(1)

async def main(urls):
    asyncio.create_task(progress_monitor())  # Runs in background
    # ... rest of scraping logic
Books That Will Help
These chapters provide deep dives into the concepts needed for this project:
| Topic | Book & Chapter |
|---|---|
| Event Loop Fundamentals | “Using Asyncio in Python” by Caleb Hattingh — Ch. 2: “The Event Loop” |
| Async/Await Syntax | “Fluent Python” by Luciano Ramalho — Ch. 18: “Concurrency with Asyncio” |
| Coroutine Mechanics | “Python Cookbook” by David Beazley — Ch. 12.12: “Understanding Event-Driven I/O” |
| Error Handling in Async | “Using Asyncio in Python” by Caleb Hattingh — Ch. 4: “Async Context Managers and Cleanup” |
| HTTP Client Patterns | “Using Asyncio in Python” by Caleb Hattingh — Ch. 6: “Working with HTTP” |
| Performance Optimization | “High Performance Python” by Gorelick & Ozsvald — Ch. 9: “The multiprocessing Module” |
| System Call Internals | “The Linux Programming Interface” by Michael Kerrisk — Ch. 63: “Alternative I/O Models” |
Project 4: The C-Speed Injection (C Extensions)
- File: PYTHON_PERFORMANCE_AND_SCALING_MASTERY.md
- Main Programming Language: C and Python
- Alternative Programming Languages: Rust (using PyO3), Cython
- Coolness Level: Level 4: Hardcore Tech Flex
- Business Potential: 5. The “Industry Disruptor”
- Difficulty: Level 4: Expert
- Knowledge Area: C-API / Low-level Optimization
- Software or Tool: Python C-API,
setuptools - Main Book: “Python Cookbook” by David Beazley
What you’ll build: A computationally heavy module (e.g., Matrix Multiplication or a custom encryption algorithm) written in pure C, wrapped as a Python module, and compared against a pure Python implementation.
Why it teaches Python Performance: This is the ultimate “escape hatch.” You’ll learn how Python handles objects under the hood, how reference counting works, and how to release the GIL manually in C to achieve true multi-core performance for a single function call.
Core challenges you’ll face:
- Reference Counting → If you forget to increment or decrement a reference, your Python program will crash or leak memory.
- The Python Object Model → Mapping C types to
PyObject*and vice versa. - Releasing the GIL → Using
Py_BEGIN_ALLOW_THREADSto let other Python threads run while your C code handles the heavy math.
Real World Outcome
A Python module fastmath that runs 50x-100x faster than the equivalent Python code.
Example Output:
import fastmath
import slowmath # Pure Python version

# 1000x1000 Matrix Multiplication
slow_time = benchmark(slowmath.matmul, A, B) # 12.5 seconds
fast_time = benchmark(fastmath.matmul, A, B) # 0.08 seconds
print(f"Speedup: {slow_time / fast_time:.1f}x")
The Core Question You’re Answering
“How do I take a piece of Python code that’s too slow and make it run at the speed of the hardware?”
This is how libraries like NumPy and TensorFlow work. They are C/C++ libraries with a Python “skin.”
Concepts You Must Understand First
Before writing a single line of C code, you need to internalize these concepts:
1. Python C-API Basics
- PyObject*: Every Python value is a struct pointer. Even
42is a heap-allocated object. - PyArg_ParseTuple: Extracting C types from Python function arguments.
- Module Initialization: The
PyInit_<modulename>()function that CPython calls when youimportyour module. - Type Conversion: Converting between
PyObject*and C primitives (PyLong_AsLong,PyFloat_FromDouble).
Read: “Python Cookbook” by David Beazley — Ch. 15: “C Extensions”
2. Reference Counting Rules
- Ownership Model: Every
PyObject*has a reference count. When it hits 0, Python frees it. - Py_INCREF / Py_DECREF: Manually incrementing/decrementing references.
- Borrowed vs New References: If a function returns a “New Reference,” you MUST
Py_DECREFit when done, or you leak memory. - Stealing References: Some API functions “steal” your reference (e.g.,
PyTuple_SetItem).
Read: “CPython Internals” by Anthony Shaw — Ch. 7: “Memory Management”
3. GIL Management in C
- Py_BEGIN_ALLOW_THREADS / Py_END_ALLOW_THREADS: Release the GIL for long-running C operations to allow other Python threads to run.
- When to Release: Only release the GIL if your C code doesn’t touch Python objects. A segfault will occur if you access
PyObject*without holding the GIL. - Thread State: Understanding
PyGILState_Ensure()for callbacks from C threads.
Read: “Fluent Python” by Luciano Ramalho — Ch. 19: “Concurrency Models”
4. Memory Ownership Across the Boundary
- Who Allocates?: If Python passes you a buffer, don’t
free()it. If you allocate in C, you must free in C. - Buffer Protocol: Exposing C arrays as Python
memoryviewobjects for zero-copy data sharing. - PyMem_Malloc vs malloc: Use
PyMem_Mallocfor Python-managed memory to respecttracemalloc.
Read: “High Performance Python” by Gorelick & Ozsvald — Ch. 7: “Compiling to C”
5. Building with setuptools/distutils
- Extension Module Definition: Creating a
setup.pythat compiles your.cfile into a.so(Linux) or.pyd(Windows). - Include Paths: Pointing to Python’s header files (
Python.h). - Compiler Flags: Using
-O3for optimization,-fPICfor position-independent code.
Read: “Python Cookbook” by David Beazley — Ch. 15: “C Extensions”
Questions to Guide Your Design
Before you start coding, answer these:
- How do I handle Python exceptions from C?
- When a Python API call returns NULL, an exception is set. Do I propagate it? Clear it?
- How do I raise my own exceptions using
PyErr_SetString?
- How do I convert between Python and C types safely?
- What if
PyLong_AsLongoverflows? (It sets an exception) - How do I handle
Nonebeing passed where I expect an integer? - Should I use
PyArg_ParseTupleorPyArg_ParseTupleAndKeywordsfor optional arguments?
- What if
- When should I release the GIL?
- If my C function does pure math with no Python objects, release it.
- If I call back into Python (e.g., a callback function), I must re-acquire the GIL first.
- What happens if I forget to re-acquire it? (Segfault or deadlock)
- How do I handle memory that crosses the boundary?
- If I allocate a C array and want to return it to Python as a
bytesobject, who owns it after the call? - If Python passes me a list, do I own the list items or are they borrowed references?
- If I allocate a C array and want to return it to Python as a
Thinking Exercise: Trace the Reference Counts
Before you implement your C extension, trace through this code mentally:
static PyObject* risky_function(PyObject* self, PyObject* args) {
    PyObject* input_list;
    PyObject* item;
    PyObject* result;

    // Step 1: Parse arguments (input_list is a BORROWED reference)
    if (!PyArg_ParseTuple(args, "O", &input_list)) {
        return NULL; // Exception is already set
    }

    // Step 2: Get first item (item is a BORROWED reference)
    item = PyList_GetItem(input_list, 0);
    if (item == NULL) {
        return NULL; // Exception set if list is empty
    }

    // Step 3: Increment an integer (creates a NEW reference)
    long value = PyLong_AsLong(item);
    if (value == -1 && PyErr_Occurred()) {
        return NULL; // Not an integer
    }

    result = PyLong_FromLong(value + 1); // NEW reference

    // Step 4: Return (caller now owns the reference)
    return result;
}
Questions:
- Do we need to
Py_DECREF(input_list)before returning? - Do we need to
Py_INCREF(item)before using it? - What happens if we forget to return
resultand returnPy_Noneinstead?
Answers:
- No.
input_listis borrowed fromargs. We didn’t create it, so we don’t free it. - Not here. We only use
itemto extract a Clong. If we were storing it for later, we’d need to increment. - Memory leak.
resultwould have refcount=1 with no owner. Always return orPy_DECREFnew references.
Thinking Exercise: What Happens When the GIL is Released?
Consider this C extension that performs matrix multiplication:
static PyObject* matmul(PyObject* self, PyObject* args) {
    PyObject* matrix_a;
    PyObject* matrix_b;
    double* a_data;
    double* b_data;
    double* result_data;
    int size;

    if (!PyArg_ParseTuple(args, "OOi", &matrix_a, &matrix_b, &size)) {
        return NULL;
    }

    // Extract raw data pointers from Python buffers
    a_data = (double*)PyMemoryView_GET_BUFFER(matrix_a)->buf;
    b_data = (double*)PyMemoryView_GET_BUFFER(matrix_b)->buf;

    // Allocate result
    result_data = (double*)PyMem_Malloc(size * size * sizeof(double));

    // Release the GIL before heavy computation
    Py_BEGIN_ALLOW_THREADS

    for (int i = 0; i < size; i++) {
        for (int j = 0; j < size; j++) {
            result_data[i * size + j] = 0.0;
            for (int k = 0; k < size; k++) {
                result_data[i * size + j] += a_data[i * size + k] * b_data[k * size + j];
            }
        }
    }

    Py_END_ALLOW_THREADS

    // Wrap result in a Python memoryview
    PyObject* result = PyMemoryView_FromMemory((char*)result_data,
                                                size * size * sizeof(double),
                                                PyBUF_WRITE);
    return result;
}
Questions:
- Why can we safely release the GIL here?
- What would happen if we called
PyList_Appendinside thePy_BEGIN_ALLOW_THREADSblock? - If another Python thread modifies
matrix_awhile we’re computing, what happens?
Answers:
- We’re only accessing raw C pointers (
a_data,b_data), not Python objects. The GIL only protects Python object access. - Segfault or deadlock.
PyList_Appendrequires the GIL. You’d need to wrap it withPyGILState_Ensure(). - Data race. The buffer protocol doesn’t lock memory. You’d need external synchronization (Python-side lock) or copy the data before releasing the GIL.
The Interview Questions They’ll Ask
1. “What is the difference between a borrowed reference and a new reference in the Python C-API?”
Answer: A borrowed reference is a pointer to a PyObject that you don’t own. You must not Py_DECREF it. A new reference is one you are responsible for freeing with Py_DECREF. Example: PyList_GetItem returns borrowed, PyLong_FromLong returns new.
2. “When would you release the GIL in a C extension?”
Answer: When performing CPU-intensive operations that don’t touch Python objects (e.g., numeric computation on raw arrays). This allows other Python threads to run concurrently. You must re-acquire the GIL before calling any Python API functions.
3. “How do you raise a Python exception from C code?”
Answer: Use PyErr_SetString(ExceptionType, "message") and return NULL from your function. CPython will propagate the exception to the Python caller.
Example:
if (denominator == 0) {
    PyErr_SetString(PyExc_ZeroDivisionError, "Cannot divide by zero");
    return NULL;
}
4. “What happens if you forget to Py_DECREF a new reference?”
Answer: Memory leak. The object’s reference count will never reach 0, so it will never be freed. Over time, your program will consume unbounded memory.
5. “Why do libraries like NumPy use C extensions instead of pure Python?”
Answer: C extensions bypass Python’s bytecode interpreter and operate on raw memory. They can release the GIL for true parallelism and use SIMD instructions (vectorization) for orders of magnitude speedup on numeric operations.
6. “What is the Buffer Protocol and why is it important for performance?”
Answer: The Buffer Protocol allows C extensions to directly access the underlying memory of Python objects like bytes, bytearray, and memoryview without copying. This enables zero-copy data sharing between Python and C, crucial for performance when dealing with large arrays.
Hints in Layers
Hint 1: Start with Tooling
Don’t fight the build system. Use a minimal setup.py:
from setuptools import setup, Extension

module = Extension('fastmath', sources=['fastmath.c'])

setup(name='fastmath',
      version='1.0',
      description='Fast math functions',
      ext_modules=[module])
Build with: python setup.py build_ext --inplace
Hint 2: Always Check Return Values
Every Python C-API function that returns PyObject* can return NULL on error. Never proceed if you get NULL:
PyObject* item = PyList_GetItem(list, 0);
if (item == NULL) {
    return NULL; // Exception already set
}
Hint 3: Use Reference Counting Helpers
For complex functions, use Py_XDECREF (safe for NULL) and group your cleanup:
PyObject* result = NULL;
PyObject* temp1 = NULL;
PyObject* temp2 = NULL;

// ... do work ...

cleanup:
    Py_XDECREF(temp1);
    Py_XDECREF(temp2);
    return result;
Hint 4: Profile Before and After
Use timeit to measure speedup:
import timeit

python_time = timeit.timeit('slowmath.compute(data)', setup='...', number=100)
c_time = timeit.timeit('fastmath.compute(data)', setup='...', number=100)

print(f"Speedup: {python_time / c_time:.1f}x")
Hint 5: Start Simple, Then Optimize
First implementation: Get it working with basic PyLong_AsLong and PyLong_FromLong.
Second iteration: Use the Buffer Protocol for arrays.
Third iteration: Release the GIL.
Fourth iteration: Add OpenMP for multi-threading in C.
Books That Will Help
| Concept | Book & Chapter | Why It’s Essential |
|---|---|---|
| C-API Basics | “Python Cookbook” by David Beazley — Ch. 15: “C Extensions” | Covers module initialization, argument parsing, and type conversion with practical examples. |
| Reference Counting | “CPython Internals” by Anthony Shaw — Ch. 7: “Memory Management” | Deep dive into how CPython manages memory and the rules for reference counting. |
| GIL Management | “Fluent Python” by Luciano Ramalho — Ch. 19: “Concurrency Models” | Explains when and how to release the GIL for performance. |
| Buffer Protocol | “High Performance Python” by Gorelick & Ozsvald — Ch. 7: “Compiling to C” | Shows zero-copy techniques using memoryviews and the buffer protocol. |
| Building Extensions | Official Python Documentation: “Extending and Embedding Python” | The authoritative guide to the C-API, always up-to-date. |
| Practical Examples | “Cython” by Kurt Smith — Ch. 3: “Working with NumPy Arrays” | While Cython-focused, shows patterns for efficient C/Python interop. |
Project 5: The Memory Autopsy (Custom Profiler)
- File: PYTHON_PERFORMANCE_AND_SCALING_MASTERY.md
- Main Programming Language: Python
- Alternative Programming Languages: None (Requires deep CPython hooks)
- Coolness Level: Level 4: Hardcore Tech Flex
- Business Potential: 3. The “Service & Support” Model
- Difficulty: Level 4: Expert
- Knowledge Area: Memory Management / Introspection
- Software or Tool:
tracemalloc,gcmodule,objgraph - Main Book: “High Performance Python” by Gorelick & Ozsvald
What you’ll build: A memory profiler that hooks into Python’s garbage collector to identify “leaks” (objects that aren’t being collected) and visualizes the object reference graph.
Why it teaches Python Performance: Scaling isn’t just about CPU; it’s about RAM. You’ll learn how Python’s Generational Garbage Collector works, what “Reference Cycles” are, and how to use __slots__ to drastically reduce memory overhead.
Core challenges you’ll face:
- Tracking Object Lifetimes → Using
sys.settraceortracemallocto see where objects are allocated. - Detecting Cycles → Finding objects that point to each other and can’t be freed by simple reference counting.
- Memory Mapping → Understanding the difference between RSS (Resident Set Size) and the Python Heap.
Real World Outcome
A tool that produces a “Leak Report” showing which classes are growing in memory and a visual PDF of the reference cycle causing the leak.
Example Output:
$ python memory_autopsy.py my_app.py
[GC] Collection triggered. 450 objects unreachable.
[Leak Warning] UserSession objects are growing at 1.2MB/min.
[Action] Reference found: UserSession -> Request -> UserSession (Cycle!)
[Slots Suggestion] Adding __slots__ to 'Point' class would save 45MB.
The Core Question You’re Answering
“Where did all my RAM go, and why isn’t Python’s garbage collector freeing it?”
This is the most frustrating debugging experience in Python. Your app runs fine for an hour, then memory usage creeps from 500MB to 8GB. You call del on objects, but the memory doesn’t drop. You’re fighting reference cycles, hidden global state, and the mysterious gap between Python’s heap and what the OS reports.
Concepts You Must Understand First
Before building this profiler, you need to internalize these memory management fundamentals:
1. Python’s Memory Allocator (pymalloc)
What it is: Python doesn’t call malloc() for every small object. It uses a custom allocator (pymalloc) that manages “arenas” of memory in 256KB chunks, split into “pools” for objects of specific sizes (8, 16, 24… 512 bytes).
Why it matters: Even if you delete objects, Python may not return memory to the OS immediately. The arena stays allocated until all objects in it are freed.
Book Reference:
- “CPython Internals” by Anthony Shaw — Ch. 9: “Memory Management”
- “High Performance Python” by Gorelick & Ozsvald — Ch. 3: “Lists and Tuples”
2. Generational Garbage Collection
What it is: Python uses a hybrid system:
- Reference Counting (primary): Every object tracks how many references point to it. When the count hits 0, it’s immediately freed.
- Generational GC (backup): Detects reference cycles that reference counting can’t handle (e.g.,
A.ref = B; B.ref = A).
Objects are born in Generation 0 (youngest). If they survive a GC cycle, they’re promoted to Gen 1, then Gen 2 (oldest). Gen 2 collections are expensive.
Why it matters: Long-lived objects in Gen 2 that have cycles won’t be freed until a full collection runs, which might be rare in long-running services.
Book Reference:
- “Fluent Python” by Luciano Ramalho — Ch. 8: “Object References, Mutability, and Recycling”
- Python Docs:
gcmodule — “Generational Garbage Collection”
3. Reference Cycles and Weak References
What they are:
- Cycle: Two objects that reference each other. Reference counting alone can’t free them because their counts never hit 0.
- Weak Reference: A reference that doesn’t increase the reference count. When only weak refs remain, the object is freed.
Why it matters: The GC can break cycles, but only for objects with __del__ methods under certain conditions. Weak references let you create caches that don’t prevent cleanup.
Book Reference:
- “Python Cookbook” by David Beazley — Recipe 8.23: “Managing Memory in Cyclic Data Structures”
- Python Docs:
weakrefmodule
4. __slots__ and Object Layout
What it is: By default, every Python object has a __dict__ that stores attributes. This dictionary has overhead (~200 bytes even when empty). Using __slots__ replaces the dictionary with a fixed array, saving 40-60% of memory for simple classes.
Example:
class Point:
    __slots__ = ['x', 'y']  # No __dict__, just two fixed fields
Why it matters: If you’re creating millions of objects (e.g., a game engine with entities), __slots__ can reduce memory from 8GB to 3GB.
Book Reference:
- “Fluent Python” by Luciano Ramalho — Ch. 11: “A Pythonic Object”
- “High Performance Python” by Gorelick & Ozsvald — Ch. 3: “Tuples and Named Tuples”
5. tracemalloc Internals
What it is: A standard library module that hooks into Python’s memory allocator to track where every allocation happens (file, line number, size).
How it works: It maintains a hash table mapping memory addresses to traceback objects. You can take “snapshots” and diff them to see what grew between two points in time.
Why it matters: This is your primary tool for answering “Which line of code allocated that 500MB of RAM?”
Book Reference:
- Python Docs:
tracemallocmodule — “Trace memory allocations” - “High Performance Python” by Gorelick & Ozsvald — Ch. 2: “Profiling to Find Bottlenecks”
Questions to Guide Your Design
These questions will shape how you architect the profiler:
1. How do you track allocations without slowing down the program?
The Dilemma: sys.settrace() can track every function call, but it makes your program 10-100x slower. tracemalloc is faster but still adds ~30% overhead.
Design Decision: Should you sample (take snapshots every N seconds) or trace continuously? Should you filter by size (only track allocations > 1MB)?
2. How do you visualize reference graphs?
The Challenge: A live Python process might have 100,000+ objects. How do you render a graph showing which objects are holding references to your “leaked” objects?
Design Decision: Will you use graphviz to generate a DOT file? Will you limit the depth (only show 3 levels of references)? How do you highlight the “root” that’s preventing GC?
3. How do you detect cycles vs legitimate references?
The Challenge: Not all circular references are bugs. A parent-child relationship (e.g., Node.children[0].parent = Node) is intentional. A true “leak” is when objects should be dead but are held alive by an unexpected reference.
Design Decision: Will you use gc.get_referents() to walk the reference chain? How do you distinguish “expected” cycles (data structures) from “unexpected” ones (bugs)?
4. How do you measure memory per object type?
The Challenge: sys.getsizeof() only measures the object itself, not the objects it references. A list with 1 million strings will report as 8MB (the list container), ignoring the 500MB of string data.
Design Decision: Will you recursively measure all reachable objects? How do you avoid double-counting objects referenced from multiple places?
Thinking Exercise
Before you write any code, do this exercise by hand to internalize how reference cycles work.
Exercise: Create and Visualize a Reference Cycle
Step 1: Create a cycle manually:
import gc
import sys

class Node:
    def __init__(self, name):
        self.name = name
        self.ref = None

    def __repr__(self):
        return f"Node({self.name})"

# Create a cycle
A = Node("A")
B = Node("B")
A.ref = B
B.ref = A

print(f"A refcount: {sys.getrefcount(A) - 1}")  # -1 to exclude the arg to getrefcount
print(f"B refcount: {sys.getrefcount(B) - 1}")

# Delete the names
del A
del B

# Are they freed?
gc.collect()
print(f"Unreachable objects: {gc.collect()}")
Question 1: What are the reference counts for A and B before you delete them? Why aren’t they 2?
Question 2: After del A and del B, why haven’t the objects been freed yet?
Question 3: Run gc.get_referents() on one of the objects before deletion. What unexpected references do you see? (Hint: Check for __main__.__dict__ and the current frame.)
Exercise: Trace Garbage Collection Generations
Step 2: Watch objects move through generations:
import gc

gc.set_debug(gc.DEBUG_STATS)  # Print GC statistics

class Tracker:
    def __init__(self, name):
        self.name = name

    def __del__(self):
        print(f"{self.name} is being destroyed")

# Create objects
obj1 = Tracker("Gen0-Short")
obj2 = Tracker("Gen0-Long")

# Trigger Gen 0 collection
gc.collect(0)

# Delete obj1 (should be collected immediately via refcount)
del obj1

# obj2 survives and gets promoted to Gen 1
print(f"obj2 generation: {gc.get_objects().index(obj2)}")  # This is a hack; normally you'd use gc.get_stats()

# Create a cycle that will only be caught by GC
A = Tracker("Cycle-A")
B = Tracker("Cycle-B")
A.ref = B
B.ref = A
del A, B

# Trigger full collection
gc.collect()
Question 4: Which objects trigger the __del__ method immediately (refcount), and which require a GC cycle?
Question 5: If you add __del__ to a class involved in a reference cycle, what happens? (Hint: Look up “uncollectable garbage” in Python docs.)
What You Should Learn From This
- Reference counting handles 99% of cleanup instantly.
- The GC only runs occasionally, and Gen 2 collections are rare (every 10,000+ Gen 0 collections).
- Cycles involving
__del__methods can become uncollectable, leaking forever.
The Interview Questions They’ll Ask
When you claim expertise in Python memory management, expect these questions:
1. “Why does my Python process use 2GB of RAM even though all my objects total 500MB?”
What they’re testing: Do you understand the difference between the Python heap and RSS (Resident Set Size)?
Answer: Python’s memory allocator (pymalloc) allocates memory in arenas that it doesn’t return to the OS even when objects are freed. The memory is reused for future allocations but remains in the process’s virtual memory. You can use tracemalloc to see Python’s view vs psutil.Process().memory_info().rss for the OS view.
2. “What’s the difference between del obj and obj = None?”
What they’re testing: Do you understand reference counting?
Answer: Both decrement the reference count by 1, but del removes the name from the namespace, while = None rebinds it. If multiple names point to the object, del doesn’t free it—only when the last reference is gone. Example:
a = [1, 2, 3]
b = a
del a  # List still exists; b points to it
del b  # NOW the list is freed (refcount = 0)
3. “When does Python’s garbage collector run?”
What they’re testing: Do you know the GC isn’t always-on?
Answer:
- Reference counting runs immediately when refcount hits 0.
- Generational GC runs when allocation thresholds are hit (default: 700 Gen0 allocations, or 10 Gen1 collections → 1 Gen2 collection).
- You can trigger it manually with
gc.collect()or disable it entirely withgc.disable()(useful in short-lived scripts).
4. “How do you debug a memory leak in a long-running Python service?”
What they’re testing: Do you know real-world tools?
Answer:
- Use
tracemallocto take snapshots before and after a request cycle. Compare with.compare_to(). - Check for reference cycles with
gc.get_referrers()on leaked objects. - Profile with
memory_profilerto see memory usage per line. - Look for global caches (e.g.,
@lru_cachewithoutmaxsize) or event handlers that aren’t unregistered.
5. “What’s the cost of using __slots__?”
What they’re testing: Do you understand the trade-offs?
Answer:
- Pro: Saves 40-60% memory per instance; faster attribute access (no dict lookup).
- Con: Can’t add new attributes dynamically; breaks multiple inheritance if parents have different
__slots__; can’t use__dict__-based introspection tools. - When to use: Classes with millions of instances (e.g., database rows, game entities).
6. “Why can’t Python’s GC collect objects with __del__ in a cycle?”
What they’re testing: Do you understand uncollectable garbage?
Answer: If A and B reference each other and both have __del__, Python can’t determine which to destroy first (since __del__ might access the other object). Before Python 3.4, these became uncollectable. Python 3.4+ handles this better but still requires care. Use weakref to break cycles involving cleanup logic.
Hints in Layers
If you get stuck building the profiler, reveal these hints progressively:
Hint 1: Start with Snapshot Comparison (Beginner)
Don’t try to build everything at once. Start with:
import tracemalloc

tracemalloc.start()
snapshot1 = tracemalloc.take_snapshot()

# Run your suspicious code here
leak_causing_function()

snapshot2 = tracemalloc.take_snapshot()
top_stats = snapshot2.compare_to(snapshot1, 'lineno')

for stat in top_stats[:10]:
    print(stat)
This shows you the top 10 lines that allocated the most memory between snapshots.
Hint 2: Filter by Size (Intermediate)
To reduce noise, only track large allocations:
tracemalloc.start(25)  # Track 25 stack frames deep

# Filter stats
snapshot = tracemalloc.take_snapshot()
top_stats = snapshot.statistics('lineno')

for stat in top_stats:
    if stat.size > 1024 * 1024:  # Only show allocations > 1MB
        print(stat)
Hint 3: Visualize Reference Graphs (Advanced)
Use objgraph to generate PNG images of object relationships:
import objgraph

# Find objects of a specific type
leaky_objects = objgraph.by_type('UserSession')

# Show what's referencing the first one
objgraph.show_backrefs(leaky_objects[0], max_depth=5, filename='leak.png')
This creates a graph showing why UserSession isn’t being freed.
Hint 4: Hook into GC Events (Expert)
Track when the GC runs and what it collects:
import gc

def gc_callback(phase, info):
    if phase == "start":
        print(f"GC starting: {info}")
    elif phase == "stop":
        print(f"GC collected {info['collected']} objects")

gc.callbacks.append(gc_callback)
Combine this with gc.get_stats() to see generation sizes over time.
Hint 5: Measure True Size Recursively (Expert)
sys.getsizeof() is shallow. For deep size:
import sys
from collections import deque

def get_deep_size(obj, seen=None):
    """Recursively measure memory of obj and all reachable objects."""
    if seen is None:
        seen = set()

    obj_id = id(obj)
    if obj_id in seen:
        return 0

    seen.add(obj_id)
    size = sys.getsizeof(obj)

    if isinstance(obj, dict):
        size += sum(get_deep_size(v, seen) for v in obj.values())
        size += sum(get_deep_size(k, seen) for k in obj.keys())
    elif hasattr(obj, '__dict__'):
        size += get_deep_size(obj.__dict__, seen)
    elif hasattr(obj, '__iter__') and not isinstance(obj, (str, bytes, bytearray)):
        size += sum(get_deep_size(i, seen) for i in obj)

    return size
Warning: This is slow on large object graphs. Use sparingly.
Books That Will Help
Here’s where to find detailed explanations for each concept:
| Concept | Book & Chapter |
|---|---|
| Python Memory Model | “CPython Internals” by Anthony Shaw — Ch. 9: “Memory Management” |
| Garbage Collection | “Fluent Python” by Luciano Ramalho — Ch. 8: “Object References, Mutability, and Recycling” |
| Reference Counting | “Python Cookbook” by David Beazley — Recipe 8.23: “Managing Memory in Cyclic Data Structures” |
__slots__ Optimization |
“Fluent Python” by Luciano Ramalho — Ch. 11: “A Pythonic Object” |
| Profiling Tools | “High Performance Python” by Gorelick & Ozsvald — Ch. 2: “Profiling to Find Bottlenecks” |
tracemalloc Usage |
“High Performance Python” by Gorelick & Ozsvald — Ch. 3: “Lists and Tuples” |
| Weak References | “Python Cookbook” by David Beazley — Recipe 8.24: “Making Classes Support Comparison Operations” |
| Memory Allocators | “Python Internals” (Blog) by Armin Ronacher — “Python’s Allocator” |
Recommended Reading Order
- Start with Fluent Python Ch. 8 to understand references and GC conceptually.
- Read CPython Internals Ch. 9 for the technical implementation.
- Work through High Performance Python Ch. 2-3 for practical profiling techniques.
- Reference Python Cookbook when you hit specific issues (cycles, weak refs).
Project 6: The “Mini-FastAPI” (Async Web Framework)
- File: PYTHON_PERFORMANCE_AND_SCALING_MASTERY.md
- Main Programming Language: Python
- Alternative Programming Languages: None
- Coolness Level: Level 3: Genuinely Clever
- Business Potential: 4. The “Open Core” Infrastructure
- Difficulty: Level 3: Advanced
- Knowledge Area: Web Architecture / Async
- Software or Tool:
sockets,asyncio,httptools - Main Book: “Architecture Patterns with Python” by Harry Percival
What you’ll build: A high-performance web framework from scratch using raw sockets and asyncio. It will handle HTTP parsing, routing, and asynchronous request handling.
Why it teaches Python Performance: You’ll understand the “Magic” of modern frameworks. By building the routing engine and the socket handler yourself, you’ll learn where the overhead in web apps actually lives (it’s usually in the middleware).
Core challenges you’ll face:
- Zero-Copy Parsing → How to parse HTTP headers without creating thousands of small strings.
- Efficient Routing → Using Radix Trees or Regex for O(1) route lookups.
- The WSGI vs ASGI split → Implementing the ASGI spec to allow your framework to run on
uvicorn.
Real World Outcome
A lightweight async web framework that can handle tens of thousands of requests per second on a single core, demonstrating the power of async I/O for web servers.
Example Output:
$ python mini_fastapi.py
[Server] Starting on 0.0.0.0:8000...
[Server] Async event loop initialized (using uvloop)
[Server] Loaded 15 routes in 2.3ms

$ curl http://localhost:8000/api/users/123
HTTP/1.1 200 OK
Content-Type: application/json
Content-Length: 45
Connection: keep-alive

{"user_id": 123, "name": "Alice", "status": "active"}

$ wrk -t4 -c100 -d10s http://localhost:8000/api/users/123
Running 10s test @ http://localhost:8000/api/users/123
  4 threads and 100 connections
  Thread Stats   Avg      Stdev     Max   +/- Stdev
    Latency     3.21ms    1.12ms   28.45ms   89.34%
    Req/Sec     7.9k     421.12    9.1k      76.00%
  314,892 requests in 10.00s, 52.31MB read
Requests/sec:  31,489.20
Transfer/sec:      5.23MB

[Server] Performance Stats:
  - Active connections: 100
  - Keep-alive connections: 87
  - Requests handled: 314,892
  - Average latency: 3.21ms
  - Peak memory: 45MB
  - Zero-copy parsing savings: ~15% CPU
Comparison with blocking server:
$ python blocking_server.py # Using threading.Thread
Requests/sec:  2,341.83  # 13.4x SLOWER than async version!
Peak memory: 320MB  # 7x MORE memory due to thread stacks
The Core Question You’re Answering
“What makes a web framework fast, and why can a single-threaded async server outperform a multi-threaded blocking server?”
Before you write code, understand this: FastAPI and Starlette don’t use magic. They use the OS-level epoll (Linux) or kqueue (macOS) to watch thousands of sockets simultaneously without blocking. When a socket has data ready, the event loop wakes up that coroutine. No thread creation, no context switching overhead.
Concepts You Must Understand First
1. HTTP Protocol Fundamentals
- Request/Response Structure: Understanding HTTP/1.1 message format
- Request line:
GET /path HTTP/1.1 - Headers:
Host: example.com\r\n - Body: Optional payload after
\r\n\r\n
- Request line:
- Keep-Alive Connections: How persistent connections save TCP handshake overhead
- Reading: “HTTP: The Definitive Guide” by David Gourley — Ch. 4: “Connection Management”
2. Socket Programming with Asyncio
- Non-blocking Sockets:
socket.setblocking(False)and handlingEWOULDBLOCK - The Event Loop: How
asynciousesselect()/epoll()to multiplex I/O - Reading: “Using Asyncio in Python” by Caleb Hattingh — Ch. 2: “The Truth About Threads”
3. WSGI vs ASGI Specification
- WSGI (Web Server Gateway Interface): Synchronous, blocks on I/O
- Function signature:
application(environ, start_response)
- Function signature:
- ASGI (Asynchronous Server Gateway Interface): Async-native
- Coroutine signature:
async def application(scope, receive, send)
- Coroutine signature:
- Reading: “Architecture Patterns with Python” by Harry Percival — Ch. 13: “Dependency Injection”
- Spec: PEP 3333 (WSGI), ASGI Specification
4. Routing Algorithms (Radix Trees)
- Linear Search: O(n) — iterate through all routes (slow)
- Regex Compilation: O(1) lookup but expensive to compile
- Radix Tree (Prefix Tree): O(k) where k = URL length
- Used by FastAPI, Express.js, and Gin (Go)
- Reading: “The Algorithm Design Manual” by Steven Skiena — Ch. 12: “Data Structures”
5. Middleware Patterns
- Onion Architecture: Request flows through layers, response flows back
- Zero-Copy Middleware: How to avoid copying request data at each layer
- Context Variables: Using
contextvarsto avoid passingrequesteverywhere - Reading: “Fluent Python” by Luciano Ramalho — Ch. 18: “Context Managers and else Blocks”
6. HTTP Parsing without Garbage
- The Problem:
request.split('\r\n')creates thousands of small strings - The Solution: Parse in-place using
memoryviewand slicing - Libraries:
httptools(used by Uvicorn) wraps Node.js’s http-parser in C - Reading: “High Performance Python” by Gorelick & Ozsvald — Ch. 6: “Compiling to C”
Questions to Guide Your Design
1. How do I parse HTTP requests without creating garbage?
The Problem: Naive parsing creates temporary strings:
# BAD: Creates 50+ string objects for a single request
lines = raw_request.decode('utf-8').split('\r\n')
method, path, version = lines[0].split(' ')
headers = {}
for line in lines[1:]:
    key, value = line.split(': ')
    headers[key] = value
Think About:
- Can you parse using byte indices instead of splitting?
- How does
httptoolsachieve zero-copy parsing? - What is a
memoryviewand how does it avoid copying bytes?
2. How do I handle keep-alive connections efficiently?
The Problem: Creating a new TCP connection has overhead:
- DNS lookup: ~50ms
- TCP handshake: 1.5 RTT (round-trip time)
- TLS handshake: 2 RTT
Think About:
- How do you know when a client sends multiple requests on the same connection?
- What is the
Connection: keep-aliveheader? - When should you close an idle connection to free resources?
3. How do I implement routing with O(1) lookup speed?
The Problem: Checking each route with regex is expensive:
# BAD: O(n) where n = number of routes
for pattern, handler in routes:
    if re.match(pattern, path):
        return handler
Think About:
- Can you build a tree structure where
/users/:idshares a prefix with/users/profile? - How does a Radix Tree compress common prefixes?
- What’s the tradeoff between a compiled regex and a tree lookup?
4. How do I add middleware without overhead?
The Problem: Each middleware layer wraps the next:
# If you have 10 middleware, that's 10 function calls per request
response = auth_middleware(
    logging_middleware(
        cors_middleware(
            handler(request)
        )
    )
)
Think About:
- Can you “flatten” middleware into a single pipeline?
- How does the ASGI spec use
await send()to stream responses through middleware? - What’s the cost of
async deffunction calls vs regular function calls?
5. How do I handle backpressure when clients are slow?
The Problem: If a client reads response data slowly, the server’s memory fills up with unsent bytes.
Think About:
- What is a socket’s send buffer?
- How does
await writer.drain()apply backpressure? - Should you limit the number of concurrent connections?
Thinking Exercise: Trace an HTTP Request
Scenario: A client sends GET /users/42 HTTP/1.1 to your server. Trace the execution through your framework’s internals.
The Journey:
1. [TCP Layer] OS accepts connection → fd (file descriptor) = 7
2. [Event Loop] asyncio detects readable data on fd 7
3. [Socket Reader] Reads 256 bytes into buffer
4. [HTTP Parser] Finds "\r\n\r\n" at byte 128 → headers complete
5. [Router] Radix tree lookup: /users/:id → matches → UserHandler
6. [Middleware] Auth checks JWT token in header
7. [Handler] Calls `await get_user(42)` → database query (I/O)
8. [Event Loop] While waiting for DB, handles OTHER requests
9. [Database] Returns user data
10. [Response Builder] Serializes JSON, adds headers
11. [Socket Writer] Writes response bytes to fd 7
12. [Keep-Alive Check] Connection: keep-alive → loop back to step 2
Code to Analyze:
async def handle_connection(reader, writer):
    while True:  # Keep-alive loop
        # Step 3: Read request
        raw_request = await reader.read(4096)
        if not raw_request:
            break  # Client closed connection

        # Step 4: Parse HTTP
        method, path, headers = parse_http(raw_request)

        # Step 5: Route lookup
        handler, params = router.match(path)

        # Step 6: Middleware
        request = Request(method, path, headers, params)
        for middleware in middlewares:
            request = await middleware(request)

        # Step 7: Execute handler (might await database)
        response = await handler(request)

        # Step 10-11: Send response
        writer.write(response.to_bytes())
        await writer.drain()

        # Step 12: Check keep-alive
        if headers.get('Connection') != 'keep-alive':
            break

    writer.close()
Questions:
- What happens if
parse_httpis a blocking function (not async)? - Where would you add logging middleware without slowing down the hot path?
- If
await handler(request)takes 5 seconds, can the server handle other requests? - What’s the risk of the infinite
while Trueloop?
The Interview Questions They’ll Ask
1. “What’s the difference between WSGI and ASGI, and why does ASGI enable higher concurrency?”
Expected Answer: WSGI is synchronous—each request blocks a worker thread until the response is ready. ASGI is async—a single worker can handle thousands of requests concurrently by yielding control during I/O waits. ASGI uses coroutines (async def) and an event loop, while WSGI uses regular functions.
2. “How does an async web framework handle 10,000 concurrent connections on a single thread?”
Expected Answer: The event loop uses OS primitives like epoll (Linux) or kqueue (macOS) to monitor all sockets. When ANY socket has data ready (readable or writable), the loop wakes up the corresponding coroutine. Only ONE coroutine runs at a time, but switching between them is extremely fast (~microseconds) compared to OS thread context switches (~milliseconds).
3. “Why is parsing HTTP requests a performance bottleneck, and how do production frameworks optimize it?”
Expected Answer: Naive string splitting (split('\r\n')) creates many temporary string objects, triggering garbage collection. Production frameworks like Uvicorn use httptools, which wraps a C-based parser (Node.js’s http-parser). It parses in-place using byte offsets, avoiding Python object creation entirely.
4. “What is a Radix Tree, and why do web frameworks use it for routing?”
Expected Answer: A Radix Tree (compressed trie) stores routes by their path segments. /users/:id and /users/profile share the /users/ prefix, so they’re stored in the same branch. Lookup is O(k) where k = path length, much faster than O(n) regex matching against all routes. Frameworks like FastAPI use this for sub-millisecond route resolution.
5. “How does middleware work in async frameworks, and what’s the performance cost?”
Expected Answer: Middleware wraps the request/response cycle. In ASGI, middleware is an async function that calls await next_middleware(request). The cost is minimal because async def calls are cheap, but poorly written middleware can add latency. For example, if middleware does synchronous I/O (like reading a file), it blocks the entire event loop.
6. “What is ‘backpressure’ and how do you handle slow clients in an async server?”
Expected Answer: Backpressure occurs when the server produces data faster than the client consumes it. In asyncio, you use await writer.drain() to pause sending until the client’s TCP receive buffer has space. Without backpressure handling, the server’s memory would grow unbounded as unsent response data accumulates.
Hints in Layers
Hint 1: Start with a Synchronous Echo Server
Don’t jump into async immediately. Build a basic blocking socket server that echoes back whatever it receives. This teaches you socket.bind(), socket.listen(), and socket.accept().
import socket

server = socket.socket(socket.AF_INET, socket.SOCK_STREAM)
server.bind(('0.0.0.0', 8000))
server.listen(5)

while True:
    client, addr = server.accept()  # BLOCKS here
    data = client.recv(1024)        # BLOCKS here
    client.sendall(data)
    client.close()
Hint 2: Make it Async with asyncio.start_server
Replace blocking calls with async equivalents. Now the server can handle multiple clients concurrently.
import asyncio

async def handle_client(reader, writer):
    data = await reader.read(1024)  # Yields control if no data ready
    writer.write(data)
    await writer.drain()
    writer.close()

async def main():
    server = await asyncio.start_server(handle_client, '0.0.0.0', 8000)
    await server.serve_forever()

asyncio.run(main())
Hint 3: Parse HTTP Requests Manually
Don’t use a library yet. Parse the raw bytes to extract method, path, and headers. This is where you’ll appreciate libraries like httptools later.
def parse_http(raw_bytes):
    lines = raw_bytes.split(b'\r\n')
    request_line = lines[0].decode('ascii')
    method, path, version = request_line.split(' ')
    headers = {}
    for line in lines[1:]:
        if not line:
            break
        key, value = line.decode('ascii').split(': ', 1)
        headers[key] = value
    return method, path, headers
Hint 4: Implement a Simple Router with a Dictionary
Map paths to handler functions. Later, upgrade to a Radix Tree for performance.
routes = {
    '/': index_handler,
    '/users': users_handler,
}

def route(path):
    return routes.get(path, not_found_handler)
Hint 5: Add Middleware as a Decorator Pattern
Wrap handlers with middleware that runs before/after the handler.
async def logging_middleware(handler):
    async def wrapper(request):
        print(f"[{request.method}] {request.path}")
        response = await handler(request)
        return response
    return wrapper

@logging_middleware
async def my_handler(request):
    return Response("Hello World")
Books That Will Help
| Concept | Book & Chapter | Why It’s Essential |
|---|---|---|
| HTTP Protocol | “HTTP: The Definitive Guide” by David Gourley — Ch. 3: “HTTP Messages” | Learn the structure of requests/responses, headers, and status codes |
| Async I/O | “Using Asyncio in Python” by Caleb Hattingh — Ch. 3: “Asyncio Walkthrough” | Understand the event loop, coroutines, and await semantics |
| Socket Programming | “Computer Networking: A Top-Down Approach” by Kurose & Ross — Ch. 2: “Socket Programming” | Learn TCP sockets, bind(), listen(), accept(), and buffers |
| ASGI Specification | “Architecture Patterns with Python” by Harry Percival — Ch. 13: “Dependency Injection” | See how modern frameworks structure request handling |
| Routing Algorithms | “The Algorithm Design Manual” by Steven Skiena — Ch. 12: “Data Structures” | Understand tries, radix trees, and why they’re O(k) for lookups |
| Performance | “High Performance Python” by Gorelick & Ozsvald — Ch. 9: “Multiprocessing and Asyncio” | Learn profiling async code and avoiding common pitfalls |
| Web Framework Internals | “Flask Web Development” by Miguel Grinberg — Ch. 2: “Basic Application Structure” | See how Flask routes and middleware work (good comparison to your async version) |
Project 7: The Distributed Brain (Task Queue)
- File: PYTHON_PERFORMANCE_AND_SCALING_MASTERY.md
- Main Programming Language: Python
- Alternative Programming Languages: Rust or Go for the Worker
- Coolness Level: Level 4: Hardcore Tech Flex
- Business Potential: 4. The “Open Core” Infrastructure
- Difficulty: Level 4: Expert
- Knowledge Area: Distributed Systems / Scaling
- Software or Tool:
Redis,pickle/msgpack,multiprocessing - Main Book: “Designing Data-Intensive Applications” by Martin Kleppmann
What you’ll build: A distributed task queue (similar to Celery) that allows a “Producer” to send heavy tasks to multiple “Workers” running on different machines, with support for retries and results storage.
Why it teaches Python Performance: Scaling a single machine has limits. You’ll learn how to scale horizontally. You’ll handle serialization, network latency, and worker health checks.
Core challenges you’ll face:
- Serialization Wars → Should you use
pickle(Python-only) orJSON/Msgpack(interoperable)? - At-Least-Once Delivery → Ensuring a task isn’t lost if a worker crashes.
- Concurrency in the Worker → Should each worker process handle one task at a time or use
asynciofor many?
Real World Outcome
A system where you can run worker.py on 10 different servers and call task.delay() from your main app to distribute work across all of them.
Example Output:
# Server A
$ python worker.py --queue default
[Worker] Received 'heavy_compute' ID: abc-123
[Worker] Task complete in 4.2s. Sending result to Redis.

# Main App
$ python app.py
>>> result = heavy_compute.delay(data)
>>> print(result.get()) # Blocks until ANY worker finishes
42
This is the architecture behind every major web platform: Instagram uses Celery workers for photo processing, Spotify uses them for playlist generation, and Reddit uses them for comment ranking. You’ll understand how to scale beyond a single machine’s limits.
The Core Question You’re Answering
“How do I scale my application beyond a single machine? What happens when the work is too large for one Python process to handle?”
Every application eventually hits the limits of vertical scaling (buying a bigger server). This project teaches you horizontal scaling: distributing work across multiple machines.
Before you write any code, think about these fundamental questions:
- What happens if a worker crashes in the middle of processing a task?
- How do you prevent the same task from being processed twice?
- How do you know when a task is finished and retrieve its result?
- How do you add more workers without changing your application code?
These are the questions that Celery, RQ, and Dramatiq answer. By building your own, you’ll understand the tradeoffs they made.
Concepts You Must Understand First
1. Message Queues and Brokers
What it is: A message broker (like Redis or RabbitMQ) sits between your application and workers. It stores tasks in a queue until a worker is ready to process them.
Why it matters: Without a queue, your application would need to know about every worker and manage connections directly. The broker decouples producers (your app) from consumers (workers).
Book Reference:
- “Designing Data-Intensive Applications” by Martin Kleppmann — Chapter 11: “Stream Processing”
- Pattern: Message Broker vs Event Logs (Redis vs Kafka)
2. Serialization Formats (pickle, msgpack, JSON)
What it is: To send a Python function call over the network, you need to convert it to bytes. This is serialization.
The tradeoffs:
- pickle: Python-only, can serialize almost anything (including classes), but insecure and not cross-language compatible.
- JSON: Universal, safe, but limited types (no datetime, bytes, or custom classes).
- msgpack: Like JSON but binary and faster. Good middle ground.
Why it matters: If you choose pickle, your workers MUST be Python. If you choose JSON, you could write workers in Go or Rust, but you’ll need to manually convert complex types.
Book Reference:
- “High Performance Python” by Gorelick & Ozsvald — Chapter 9: “Multiprocessing” (discusses serialization overhead)
3. At-Least-Once vs Exactly-Once Delivery
At-Least-Once: The task might be processed more than once if a worker crashes. The broker will retry.
Exactly-Once: The task is guaranteed to run only once. This is HARD to achieve and requires distributed transactions.
Why it matters: If your task is “send an email,” at-least-once is dangerous (duplicate emails). If it’s “calculate a sum,” it’s fine (idempotent operation).
Book Reference:
- “Designing Data-Intensive Applications” — Chapter 11: “Idempotence and Exactly-Once Processing”
4. Worker Pools and Concurrency Models
The question: Should each worker process handle one task at a time, or should it use asyncio to juggle multiple tasks?
The tradeoff:
- One task per process: Simple, predictable, but limited by CPU cores.
- AsyncIO in the worker: Can handle hundreds of I/O-bound tasks per worker, but complex error handling.
- Thread pool: Middle ground, but hits the GIL for CPU-bound tasks.
Book Reference:
- “Python Cookbook” by David Beazley — Chapter 12: “Concurrency” (discusses worker pool architectures)
5. Distributed Consensus Basics
What it is: How do multiple workers agree on who should process a task? How do they coordinate without a central coordinator?
Why it matters: If two workers both grab the same task from the queue, you need a locking mechanism (like Redis SETNX) to ensure only one processes it.
Book Reference:
- “Designing Data-Intensive Applications” — Chapter 8: “The Trouble with Distributed Systems”
- Chapter 9: “Consistency and Consensus”
Questions to Guide Your Design
These are the questions you should answer before you start coding. Write them down and revisit them as you build.
1. How do you handle worker failures?
Scenario: A worker receives a task, starts processing, and then crashes (out of memory, killed by OS, network failure).
Questions:
- Does the task disappear forever?
- Does another worker automatically pick it up?
- How long should the broker wait before assuming the worker died?
Design Decision: Implement a “heartbeat” system where workers periodically say “I’m still alive.” If a worker misses heartbeats, the broker re-queues the task.
2. How do you ensure tasks aren’t lost?
Scenario: Your application calls task.delay(), but the Redis server crashes before a worker processes it.
Questions:
- Should tasks be written to disk (durable queues)?
- Should you use Redis AOF (Append-Only File) persistence?
- What about using RabbitMQ with durable queues instead?
Design Decision: Redis with AOF enabled, or use RabbitMQ for mission-critical tasks that must survive broker crashes.
3. How do you scale workers dynamically?
Scenario: At 3 PM, your queue has 10,000 pending tasks. At 3 AM, it has 2 tasks.
Questions:
- Should you run 50 workers 24/7 (expensive)?
- Should you auto-scale workers based on queue depth?
- How do you shut down idle workers gracefully (finish current task first)?
Design Decision: Implement a “scaling signal” where a coordinator process monitors queue depth and spawns/kills workers. Or use Kubernetes with HPA (Horizontal Pod Autoscaler).
4. How do you handle result storage?
Scenario: A worker finishes a task. Where does the result go?
Questions:
- Should results be stored in Redis (fast, but limited memory)?
- Should they be written to a database?
- How long should results be kept (TTL)?
- What if the result is 100MB (like a rendered video)?
Design Decision: Store small results (<1MB) in Redis with a 24-hour TTL. For large results, store them in S3 and put the S3 URL in Redis.
Thinking Exercise: Trace a Task Through the System
Before you code, trace the journey of a single task through your system. Draw this on paper or in a text file.
Scenario: User uploads an image that needs to be resized
1. Web Server (Django/Flask)
   └── user_uploads_image.jpg
   └── Calls: resize_image.delay("user_uploads_image.jpg", width=800)

2. Task Queue System (Your Code)
   └── Serializes the function call:
       {"task": "resize_image", "args": ["user_uploads_image.jpg"], "kwargs": {"width": 800}, "id": "abc-123"}
   └── Pushes to Redis: LPUSH queue:default <serialized_task>
   └── Returns a TaskResult object with ID "abc-123"

3. Redis Broker
   └── Queue: [task_abc-123, task_def-456, task_ghi-789, ...]

4. Worker Process (Running on separate machine)
   └── BRPOP queue:default (blocking until task available)
   └── Receives: {"task": "resize_image", "args": [...], "id": "abc-123"}
   └── Deserializes and imports: from tasks import resize_image
   └── Executes: result = resize_image("user_uploads_image.jpg", width=800)
   └── Stores result: SET result:abc-123 <serialized_result>
   └── Sets expiration: EXPIRE result:abc-123 86400 (24 hours)

5. Back to Web Server
   >>> result = resize_image.delay("user_uploads_image.jpg", width=800)
   >>> result.get(timeout=10)  # Polls Redis for result:abc-123
   >>> # Returns: {"success": True, "path": "resized_800w_image.jpg"}
Failure Scenarios to Consider
Scenario A: Worker Crashes Mid-Task
1. Worker receives task abc-123 and starts processing.
2. Worker crashes (killed by OS, power failure, etc.).
3. Task is "in-flight" — not in the queue, but not completed.
4. Problem: Without a heartbeat system, the task is LOST FOREVER.

Solution: Before processing, worker does: SET processing:abc-123 worker-id EX 300 (5 min TTL)
Another "monitor" process checks for expired processing:* keys and re-queues them.
Scenario B: Redis Crashes Before Worker Finishes
1. Task abc-123 is in Redis queue.
2. Worker pulls it from queue (BRPOP removes it from queue).
3. Redis crashes before worker finishes.
4. Problem: Result has nowhere to go.

Solution: Use Redis AOF (Append-Only File) persistence, or switch to RabbitMQ with durable queues.
Scenario C: Two Workers Pull Same Task (Race Condition)
1. Worker A: BRPOP queue:default → gets task abc-123
2. Worker B: BRPOP queue:default → should get task def-456
3. But if Redis lags, both might get abc-123.

Solution: Redis BRPOP is atomic. This can't happen with Redis LPUSH/BRPOP.
But if you manually implement polling, use SETNX for task locks.
The Interview Questions They’ll Ask
These are real questions from interviews at companies that use distributed task queues (Instagram, Spotify, Airbnb, etc.).
1. “How would you prevent a task from being processed twice if a worker crashes halfway through?”
What they’re testing: Understanding of idempotency and task acknowledgment.
Good Answer: “Before a worker starts processing, it should mark the task as ‘in-progress’ with a TTL. If the worker crashes, the TTL expires and another worker can pick it up. The task logic should also be idempotent—running it twice should be safe.”
2. “Redis is in-memory. What happens to queued tasks if Redis restarts?”
What they’re testing: Understanding of persistence and durability.
Good Answer: “Without persistence, tasks are lost. You’d enable Redis AOF (Append-Only File) or RDB snapshots. For critical tasks, use RabbitMQ with durable queues backed by disk.”
3. “How would you prioritize tasks? For example, paying users should be processed before free users.”
What they’re testing: Understanding of multiple queues and priority systems.
Good Answer: “I’d use multiple queues: queue:high, queue:medium, queue:low. Workers poll high-priority queues first. Celery does this with queue_name routing.”
4. “A single task is taking 10 minutes to process and blocking other quick tasks. How do you fix this?”
What they’re testing: Understanding of concurrency models and worker pools.
Good Answer: “I’d use a worker pool with multiple processes. Each worker handles one task, so long tasks don’t block short ones. Or split queues: fast tasks go to queue:fast with many workers, slow tasks go to queue:slow with fewer workers.”
5. “How would you implement task retries if a worker encounters a temporary failure (like a network timeout)?”
What they’re testing: Retry policies and exponential backoff.
Good Answer: “I’d catch exceptions in the worker, and if it’s a retriable error (network timeout, not a logic error), I’d re-queue the task with a retry_count field. If retry_count > 3, send it to a dead-letter queue for manual inspection. Use exponential backoff: 1s, 2s, 4s delays.”
6. “What’s the difference between a task queue and a message queue?”
What they’re testing: Conceptual understanding.
Good Answer: “A message queue is generic—it just passes messages between services. A task queue is specialized for executing code. It includes serialization of function calls, result storage, and retry logic. Celery is a task queue; RabbitMQ is a message queue. Celery uses RabbitMQ under the hood.”
Hints in Layers
When you get stuck, read the hints from top to bottom. Don’t skip ahead!
Hint 1: Start with a Single Machine
Don’t try to build a distributed system on day 1. Start with:
- A producer script that puts tasks in a Redis list (
LPUSH). - A worker script that pulls tasks from the list (
BRPOP). - Tasks are just JSON strings:
{"func": "add", "args": [2, 3]}.
Once this works, THEN add networking, serialization, and result storage.
Hint 2: Use Redis Pub/Sub for Real-Time Result Notifications
Instead of polling Redis every 100ms to check if a result is ready, use Pub/Sub:
# Worker, after finishing task:
redis.set(f"result:{task_id}", result)
redis.publish(f"result:{task_id}", "done")

# Main app:
pubsub = redis.pubsub()
pubsub.subscribe(f"result:{task_id}")
for message in pubsub.listen():
    if message['data'] == b'done':
        return redis.get(f"result:{task_id}")
This is more efficient than polling.
Hint 3: Handle Serialization Carefully
If you use pickle, you can serialize almost anything, but:
- It’s Python-only (can’t write workers in Go).
- It’s INSECURE—a malicious pickle can execute arbitrary code.
For security, use msgpack or JSON and manually convert types:
import msgpack
import datetime

def serialize_task(func_name, args, kwargs):
    # Convert datetime objects to ISO strings
    serialized_args = [arg.isoformat() if isinstance(arg, datetime.datetime) else arg for arg in args]
    return msgpack.packb({"func": func_name, "args": serialized_args, "kwargs": kwargs})
Hint 4: Implement Graceful Shutdown
Workers should finish their current task before shutting down. Use signal handling:
import signal

shutdown_flag = False

def signal_handler(sig, frame):
    global shutdown_flag
    print("[Worker] Shutdown signal received. Finishing current task...")
    shutdown_flag = True

signal.signal(signal.SIGINT, signal_handler)
signal.signal(signal.SIGTERM, signal_handler)

while not shutdown_flag:
    task = redis.brpop("queue:default", timeout=1)
    if task:
        process_task(task)
This prevents half-processed tasks when you deploy new code.
Hint 5: Monitor Queue Depth
If the queue grows faster than workers can consume, you have a bottleneck. Expose metrics:
$ python queue_stats.py
[Queue] Depth: 1,234 tasks | Rate: +15 tasks/sec | Workers: 5
[Alert] Queue growing! Consider scaling workers.
Use Redis LLEN queue:default to get queue depth.
Books That Will Help
| Concept | Book & Chapter | Why It’s Essential |
|---|---|---|
| Message Brokers | “Designing Data-Intensive Applications” by Martin Kleppmann — Ch. 11: “Stream Processing” | Understand the difference between message queues (RabbitMQ) and event logs (Kafka). |
| Distributed Systems Fundamentals | “Designing Data-Intensive Applications” — Ch. 8: “The Trouble with Distributed Systems” | Learn about network failures, timeouts, and why distributed consensus is hard. |
| Serialization & RPC | “Designing Data-Intensive Applications” — Ch. 4: “Encoding and Evolution” | Understand the tradeoffs between JSON, Protocol Buffers, and pickle. |
| Task Queue Patterns | “Python Cookbook” by David Beazley — Ch. 12: “Concurrency” (Section 12.4: “Implementing Producer/Consumer Queues”) | See concrete Python code for producer/consumer patterns. |
| Multiprocessing & IPC | “High Performance Python” by Gorelick & Ozsvald — Ch. 9: “Multiprocessing” | Understand the overhead of inter-process communication and when to use shared memory. |
| Redis Internals | “Redis in Action” by Josiah Carlson — Ch. 6: “Application Components in Redis” (Task Queues) | Learn how to use Redis data structures (lists, sorted sets) for queuing. |
| Celery Deep Dive | “Celery Documentation” (online) — Architecture Section | Study how Celery solves these problems. Read their design decisions to understand tradeoffs. |
Essential Reading Order
- Start with Kleppmann Chapter 11 to understand message brokers conceptually.
- Read Beazley’s “Python Cookbook” Chapter 12 for concrete Python queue patterns.
- Build a basic prototype.
- Read Kleppmann Chapter 8 to understand failure modes.
- Add retry logic, heartbeats, and result storage.
- Read “Redis in Action” Chapter 6 to optimize your Redis usage.
Project Comparison Table
| Project | Difficulty | Time | Depth of Understanding | Fun Factor |
|---|---|---|---|---|
| 1. GIL Heartbeat | ⭐⭐⭐ | Weekend | Deep Internals | ⭐⭐⭐ |
| 2. Fractal Renderer | ⭐⭐⭐ | 1 week | Multi-core Parallelism | ⭐⭐⭐⭐⭐ |
| 3. Asyncio Storm | ⭐⭐ | 1 week | High Concurrency | ⭐⭐⭐⭐ |
| 4. C Extension | ⭐⭐⭐⭐ | 1-2 weeks | Low-level Mastery | ⭐⭐⭐⭐ |
| 5. Memory Autopsy | ⭐⭐⭐⭐ | 2 weeks | Resource Management | ⭐⭐⭐ |
| 6. Mini-FastAPI | ⭐⭐⭐ | 2 weeks | Web Internals | ⭐⭐⭐⭐ |
| 7. Distributed Brain | ⭐⭐⭐⭐ | 1 month | Distributed Scaling | ⭐⭐⭐⭐⭐ |
Recommendation
If you are a web developer: Start with Project 3 (Asyncio Storm) and Project 6 (Mini-FastAPI). Understanding the event loop is the most immediate way to improve web app performance.
If you are a data scientist: Start with Project 2 (Fractal Renderer) and Project 4 (C Extension). Parallelizing math and dropping to C will save you hours of compute time.
If you want to be a Python Expert: Follow the path numerically. Start with the GIL Heartbeat to understand the fundamental limitation, then build up to Distributed Scaling.
Final Overall Project: The Real-Time Analytical Engine
What you’ll build: A system that ingests a high-frequency stream of data (e.g., stock market ticks or IoT sensor data), processes it using parallel workers, performs complex calculations in a C-extension optimized module, and provides a real-time async dashboard for users.
Why this is the ultimate test: This combines every concept:
- AsyncIO: For high-concurrency ingestion of data streams.
- Multiprocessing: To distribute processing across all local cores.
- C Extensions: To handle the math with zero Python overhead.
- Profiling: To ensure the ingestion doesn’t block the calculation.
- Distributed Scaling: To allow adding more machines as the data stream grows.
Summary
This learning path covers Python performance through 7 hands-on projects. Here’s the complete list:
| # | Project Name | Main Language | Difficulty | Time Estimate |
|---|---|---|---|---|
| 1 | The GIL Heartbeat Monitor | Python | Advanced | Weekend |
| 2 | Parallel Fractal Renderer | Python | Advanced | 1 week |
| 3 | The Asyncio Storm | Python | Intermediate | 1 week |
| 4 | The C-Speed Injection | C/Python | Expert | 1-2 weeks |
| 5 | The Memory Autopsy | Python | Expert | 2 weeks |
| 6 | The Mini-FastAPI | Python | Advanced | 2 weeks |
| 7 | The Distributed Brain | Python | Expert | 1 month |
Expected Outcomes
After completing these projects, you will:
- Understand the CPython interpreter’s execution loop and the GIL’s role.
- Be able to choose the correct concurrency model (Async vs Threads vs Processes).
- Write performance-critical code in C and call it from Python safely.
- Profile complex applications to find memory leaks and CPU bottlenecks.
- Architect systems that scale from a single core to a distributed cluster.
You’ll have built 7 working projects that demonstrate deep understanding of Python’s performance characteristics from first principles.