Project 9: System Call and I/O Latency Profiler
Project Overview
| Attribute | Details |
|---|---|
| Difficulty | Intermediate |
| Time Estimate | 1-2 weeks |
| Primary Language | C |
| Alternative Languages | Go, Rust, Python |
| Knowledge Area | I/O and Syscalls |
| Tools Required | perf, strace, bpftrace |
| Primary Reference | “The Linux Programming Interface” by Michael Kerrisk |
Learning Objectives
By completing this project, you will be able to:
- Explain syscall mechanics including user-kernel transitions and overhead
- Trace and time individual syscalls with microsecond precision
- Identify I/O-bound workloads distinguishing them from CPU-bound
- Measure I/O latency distributions for different operations
- Correlate syscall patterns with application behavior
- Apply I/O optimization techniques (batching, async I/O)
Deep Theoretical Foundation
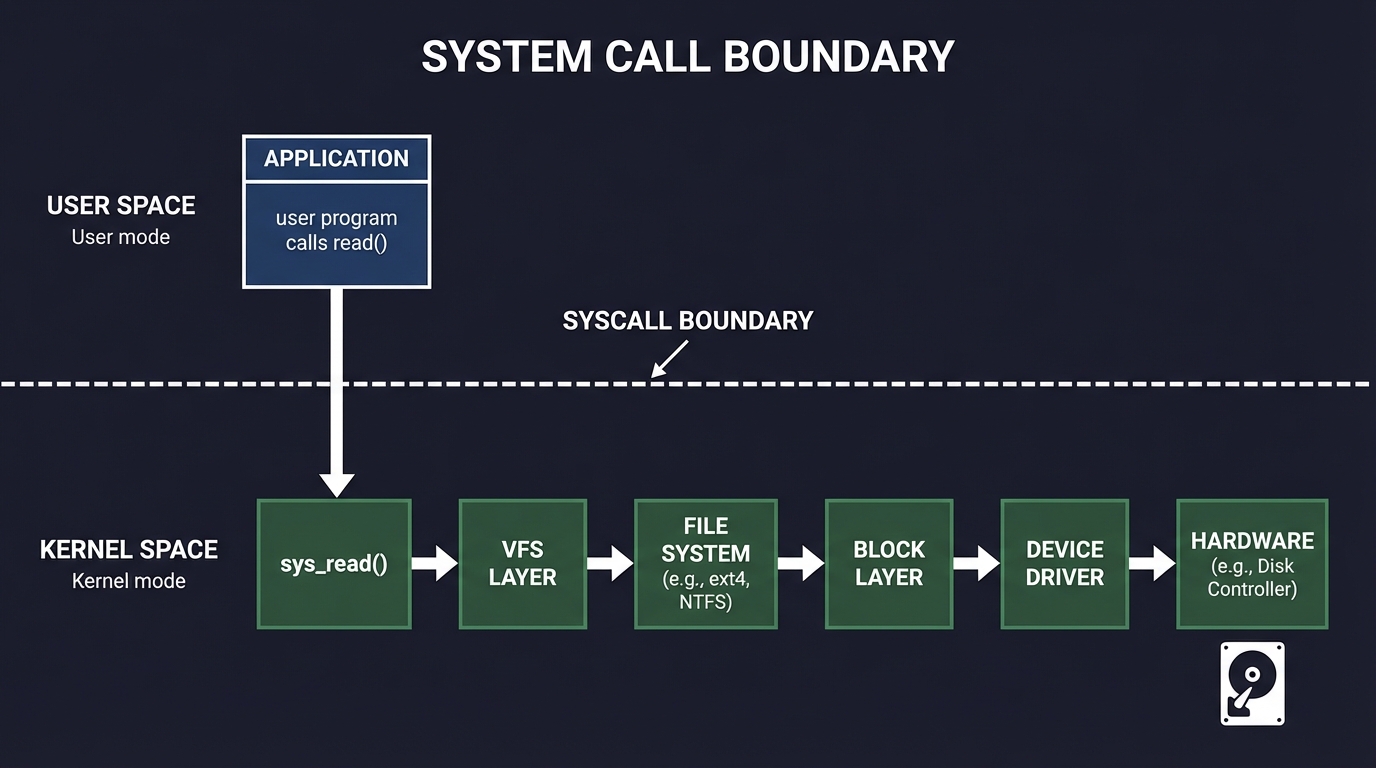
The Syscall Boundary
User programs cannot directly access hardware. They must request services from the kernel via system calls:
User Space                        Kernel Space
┌────────────────────┐           ┌────────────────────┐
│ Application        │           │ Kernel             │
│                    │  syscall  │                    │
│ read(fd, buf, n)  ─┼───────────►  sys_read()       │
│                    │           │    ↓               │
│                    │           │  VFS layer         │
│                    │           │    ↓               │
│                    │           │  Block device      │
│                    │           │    ↓               │
│                    │  return   │  Hardware I/O      │
│ ← result ──────────┼───────────┤                    │
└────────────────────┘           └────────────────────┘
Syscall Overhead Components
1. Mode Switch (1-2 µs)
- Save user registers
- Switch to kernel stack
- Security checks (Spectre mitigations add ~100ns)
2. Kernel Processing (varies)
- Path lookup for file operations
- Permission checks
- Buffer management
3. Hardware I/O (huge variance)
- NVMe SSD: 10-200 µs
- SATA SSD: 50-500 µs
- HDD: 5,000-15,000 µs
- Network: 100-100,000 µs
4. Return to User (1-2 µs)
- Copy results to user buffers
- Restore user context
Categories of Syscalls
Fast Syscalls (< 10 µs)
getpid()      // Returns cached value
gettimeofday()// Reads shared memory (vDSO)
Medium Syscalls (10-100 µs)
open()        // Path lookup, permission check
stat()        // File metadata (may be cached)
mmap()        // Virtual memory manipulation
Slow Syscalls (100+ µs)
read()        // If data not in cache → disk I/O
write()       // If synchronous → wait for disk
fsync()       // Wait for all data to disk
connect()     // Network handshake
Potentially Blocking Syscalls (unbounded)
read()        // On slow device or network
accept()      // Waiting for connection
select()      // Waiting for events
sleep()       // Explicit waiting
I/O Latency Stack
Application Request
        │
        ▼
┌───────────────────┐
│ System Call       │  1-5 µs overhead
└────────┬──────────┘
         ▼
┌───────────────────┐
│ VFS Layer         │  Path resolution, caching
└────────┬──────────┘
         ▼
┌───────────────────┐
│ File System       │  ext4, XFS, btrfs logic
└────────┬──────────┘
         ▼
┌───────────────────┐
│ Block Layer       │  I/O scheduling, merging
└────────┬──────────┘
         ▼
┌───────────────────┐
│ Device Driver     │  Hardware-specific
└────────┬──────────┘
         ▼
┌───────────────────┐
│ Hardware          │  Actual I/O
└───────────────────┘

Each layer adds latency and variability
Buffering and Caching Effects
Page Cache Linux caches recently accessed file data in RAM:
First read:   Application → Syscall → Disk → Cache → Return
Second read:  Application → Syscall → Cache → Return (100x faster)
Write Buffering Writes go to page cache, not immediately to disk:
write():   Copy to page cache → Return (fast, < 10 µs)
           Background: Page cache → Disk (delayed)

fsync():   Wait for all dirty pages → Disk (slow, 1-100 ms)
This means write() latency is deceptively low until fsync().
Complete Project Specification
What You’re Building
A syscall profiling toolkit called syscall_prof that:
- Traces syscalls for target process with timing
- Categorizes syscalls by type and latency
- Identifies slow operations and their sources
- Generates latency distributions per syscall type
- Recommends I/O optimizations based on patterns
Functional Requirements
syscall_prof trace --pid <pid> --duration <sec> --output <file.csv>
syscall_prof trace --command "<cmd>" --output <file.csv>
syscall_prof analyze --input <file.csv> --top <n>
syscall_prof histogram --input <file.csv> --syscall <name>
syscall_prof report --input <file.csv> --output <report.md>
Example Output
Syscall Profiling Report
═══════════════════════════════════════════════════
Process: database_server (PID 12345)
Duration: 60 seconds
Total syscalls: 1,247,891

Syscall Summary:
───────────────────────────────────────────────────
Syscall        Count      Total Time   Avg      p99
read           423,891    12.4 s       29 µs    2.1 ms
write          312,456    3.2 s        10 µs    890 µs
fsync          2,341      48.7 s       20.8 ms  127 ms
epoll_wait     89,234     142.1 s      1.6 ms   15 ms
open           15,678     0.8 s        51 µs    320 µs
close          15,678     0.1 s        6 µs     42 µs

I/O Pattern Analysis:
───────────────────────────────────────────────────
Category           Time      % of Total
Disk I/O (fsync)   48.7 s    76.2%      ← BOTTLENECK
Network wait       142.1 s   N/A (async)
Disk read          8.2 s     12.8%
Disk write         3.2 s     5.0%
Other              3.8 s     6.0%

Critical Findings:
───────────────────────────────────────────────────
1. fsync() dominates latency (76% of I/O time)
   - Called 2,341 times (39 per second)
   - Each fsync waits 20.8 ms average
   - p99: 127 ms → causes tail latency spikes

   Recommendation:
   • Batch writes before fsync (group commit)
   • Consider O_DIRECT + io_uring for control
   • Review if all fsyncs are necessary

2. read() shows bimodal distribution
   - 95% complete in < 100 µs (cached)
   - 5% take 1-10 ms (disk hit)

   Recommendation:
   • Working set may exceed RAM
   • Consider memory-mapped I/O for hot data
   • Pre-fetch predictable access patterns

Latency Distribution (read):
───────────────────────────────────────────────────
    < 10 µs   ████████████████████████████████  34.2%
   10-50 µs   ████████████████████████          24.1%
  50-100 µs   ██████████████████████            22.3%
 100-500 µs   ████████████                      11.8%
  500 µs-1ms  ███                                3.2%
    1-10 ms   ████                               4.2%
     > 10 ms  ▌                                  0.2%
Solution Architecture
Component Design
┌─────────────────────────────────────────────────────────────┐
│                    CLI Interface                             │
│   Target selection, tracing parameters                       │
└──────────────────────────┬──────────────────────────────────┘
                           │
          ┌────────────────┼────────────────┐
          │                │                │
          ▼                ▼                ▼
   ┌─────────────┐  ┌─────────────┐  ┌─────────────┐
   │ strace      │  │ perf trace  │  │ bpftrace    │
   │ Backend     │  │ Backend     │  │ Backend     │
   └──────┬──────┘  └──────┬──────┘  └──────┬──────┘
          │                │                │
          └────────────────┼────────────────┘
                           │
                           ▼
           ┌───────────────────────────────┐
           │      Syscall Event Parser      │
           │  Normalize across backends     │
           └───────────────┬───────────────┘
                           │
          ┌────────────────┼────────────────┐
          │                │                │
          ▼                ▼                ▼
   ┌─────────────┐  ┌─────────────┐  ┌─────────────┐
   │ Statistics  │  │ Histogram   │  │ Pattern     │
   │ Calculator  │  │ Builder     │  │ Detector    │
   └─────────────┘  └─────────────┘  └─────────────┘
Key Data Structures
// Syscall event record
typedef struct {
    uint64_t timestamp_ns;
    uint32_t pid;
    uint32_t tid;
    int syscall_nr;           // Syscall number
    const char *syscall_name;
    uint64_t duration_ns;
    int return_value;
    uint64_t args[6];         // Syscall arguments
} syscall_event_t;

// Per-syscall statistics
typedef struct {
    const char *name;
    uint64_t count;
    uint64_t total_time_ns;
    uint64_t min_time_ns;
    uint64_t max_time_ns;
    histogram_t latency_hist;
} syscall_stats_t;

// I/O pattern classification
typedef enum {
    IO_PATTERN_SEQUENTIAL,
    IO_PATTERN_RANDOM,
    IO_PATTERN_MIXED
} io_pattern_t;

typedef struct {
    int fd;
    const char *path;         // If available
    io_pattern_t pattern;
    uint64_t total_bytes;
    uint64_t total_ops;
    uint64_t total_time_ns;
} fd_stats_t;
Tracing Backend Implementations
strace Backend (Portable)
# Capture syscall timing
strace -c -p $PID -o stats.txt &
sleep 60
kill %1

# Or with timestamps
strace -tt -T -o trace.txt -p $PID
Parse output:
// Line format: "14:23:45.123456 read(3, "...", 4096) = 4096 <0.000034>"
//                                                          ↑ duration
perf trace Backend (Lower Overhead)
perf trace -p $PID --duration 60000 -o trace.data
perf script -i trace.data
bpftrace Backend (Minimal Overhead)
bpftrace -e '
tracepoint:syscalls:sys_enter_read { @start[tid] = nsecs; }
tracepoint:syscalls:sys_exit_read /@start[tid]/ {
    @latency = hist(nsecs - @start[tid]);
    delete(@start[tid]);
}
'
Phased Implementation Guide
Phase 1: Basic Tracing (Days 1-3)
Goal: Capture syscalls with timing using strace.
Steps:
- Create strace wrapper with timing options
- Parse strace output format
- Extract syscall name, duration, return value
- Store events in structured format
- Calculate basic statistics
Validation: Capture matches strace -c summary.
Phase 2: Multi-Backend Support (Days 4-6)
Goal: Add perf trace and bpftrace backends.
Steps:
- Implement perf trace output parser
- Create bpftrace script for syscall tracing
- Normalize event format across backends
- Add backend selection in CLI
Validation: Same results from different backends.
Phase 3: Histogram and Analysis (Days 7-9)
Goal: Build latency distributions per syscall.
Steps:
- Implement histogram with configurable buckets
- Calculate percentiles (p50, p90, p95, p99)
- Detect bimodal distributions
- Generate visualization output
Validation: Histogram matches expected distribution.
Phase 4: I/O Pattern Detection (Days 10-11)
Goal: Classify I/O access patterns.
Steps:
- Track per-FD operations
- Detect sequential vs random access
- Calculate read/write ratio
- Identify hot files/descriptors
Validation: Sequential access correctly identified.
Phase 5: Recommendations Engine (Days 12-14)
Goal: Generate optimization suggestions.
Steps:
- Define pattern-to-recommendation rules
- Detect common anti-patterns
- Generate actionable suggestions
- Estimate improvement potential
Validation: Recommendations sensible for test cases.
Testing Strategy
Synthetic Workloads
1. Pure CPU (No I/O)
// Should show minimal syscall activity
while (running) {
    compute();
}
Expected: Few syscalls, low overhead.
2. Synchronous File I/O
// Heavy fsync usage
for (int i = 0; i < 1000; i++) {
    write(fd, data, 4096);
    fsync(fd);
}
Expected: fsync dominates latency.
3. Buffered I/O
// No fsync, uses page cache
for (int i = 0; i < 1000; i++) {
    write(fd, data, 4096);
}
// No fsync
Expected: Fast writes, potential cache pressure.
4. Random vs Sequential Read
// Sequential
for (int i = 0; i < 1000; i++) {
    pread(fd, buf, 4096, i * 4096);
}

// Random
for (int i = 0; i < 1000; i++) {
    off_t offset = (rand() % file_size) & ~4095;
    pread(fd, buf, 4096, offset);
}
Expected: Random 10-100x slower if file > RAM.
Validation
- Compare with strace -c: Summary should match
- Timing sanity: Total syscall time < wall clock
- Count accuracy: Every enter has matching exit
Common Pitfalls and Debugging
Pitfall 1: Observer Effect
Symptom: Application runs slower with profiling.
Cause: strace adds 10-100x overhead per syscall.
Solution: Use lower-overhead methods:
# strace: High overhead (ptrace)
# perf trace: Medium overhead (kernel tracing)
# bpftrace: Low overhead (eBPF, in-kernel)

# For production, use sampling instead of tracing
perf record -e syscalls:sys_enter_* -c 100 ./app
Pitfall 2: Missing Context
Symptom: Don’t know which file a read/write targets.
Cause: strace only shows fd number, not path.
Solution: Track open() calls to build fd→path mapping:
// When see: open("/data/file.txt", O_RDONLY) = 3
// Record: fd 3 → "/data/file.txt"

// When see: read(3, ...) = 4096
// Lookup: fd 3 → "/data/file.txt"
Pitfall 3: Async I/O Confusion
Symptom: I/O operations complete instantly.
Cause: Using async I/O (io_uring, aio), work happens later.
Solution: Trace completion events too:
# For io_uring
bpftrace -e '
tracepoint:io_uring:io_uring_submit_sqe { ... }
tracepoint:io_uring:io_uring_complete { ... }
'
Pitfall 4: Page Cache Masking
Symptom: All reads show < 1 ms, even for huge files.
Cause: File is fully cached in RAM.
Solution: Understand this IS realistic production behavior:
# Drop caches to measure cold performance
echo 3 | sudo tee /proc/sys/vm/drop_caches

# Or trace cache hit/miss
perf record -e cache-misses ./app
Extensions and Challenges
Extension 1: io_uring Profiling
Add support for io_uring async I/O:
- Trace submission and completion separately
- Calculate true I/O latency
- Compare with synchronous I/O
Extension 2: Network I/O Focus
Specialize for network syscalls:
- Track connection lifecycle
- Measure time-to-first-byte
- Identify connection establishment overhead
Extension 3: Per-Thread Attribution
Break down by thread:
- Which threads do most I/O?
- Thread-specific patterns
- Correlation with application logic
Challenge: Production Tracing
Design production-safe tracing:
- < 1% overhead target
- Sampling-based approach
- Aggregate statistics only
- Automatic anomaly detection
Real-World Connections
Industry Practices
- eBPF Observability: Modern production tracing uses eBPF
- Cloud Profiling: GCP/AWS offer syscall-level visibility
- Database I/O Patterns: PostgreSQL, MySQL tune around fsync
- Storage Systems: Understanding I/O is core to storage engineering
Common Optimizations
- Batching: Group multiple writes, single fsync
- Async I/O: Don’t block on slow operations
- Memory Mapping: Avoid syscall overhead for hot data
- O_DIRECT: Bypass page cache for predictable latency
- Buffered I/O: Leverage page cache for read-heavy workloads
Self-Assessment Checklist
Before considering this project complete, verify:
- You can explain syscall overhead sources
- You traced syscalls and identified slow operations
- Latency histogram shows expected distribution
- You detected sequential vs random I/O patterns
- Recommendations are actionable for test workloads
- You understand page cache effects on measurements
- You know when to use different tracing backends
Resources
Essential Reading
- “The Linux Programming Interface” by Kerrisk, Chapter 3
- “Systems Performance” by Gregg, Chapter 7
- “Operating Systems: Three Easy Pieces” by Arpaci-Dusseau, Chapter 36
Reference
- Linux syscall table:
ausyscall --dump - strace man page
- perf trace documentation
- bpftrace tutorial
Tools
- strace: Classic syscall tracer
- perf trace: Lower overhead tracing
- bpftrace: eBPF-based tracing
- sysdig: Container-aware tracing