Project 3: GDB + Core Dump Performance Autopsy
Project Overview
| Attribute | Details |
|---|---|
| Difficulty | Intermediate |
| Time Estimate | 1-2 weeks |
| Primary Language | C |
| Alternative Languages | C++, Rust, Go |
| Knowledge Area | Debugging and Post-Mortem Analysis |
| Tools Required | GDB, core dumps, gcore |
| Primary Reference | “The Linux Programming Interface” by Michael Kerrisk |
Learning Objectives
By completing this project, you will be able to:
- Configure core dump generation for reliable capture of process state
- Analyze thread backtraces to identify blocked, spinning, and hot threads
- Diagnose lock contention from frozen process state
- Identify hot loops by examining program counters and registers
- Perform post-mortem performance analysis when live debugging isn’t possible
- Build investigation checklists for systematic performance incident response
Deep Theoretical Foundation
What Is a Core Dump?
A core dump is a snapshot of a process’s memory at a specific moment. It contains:
- Virtual memory contents: All mapped memory pages (heap, stack, data)
- Register state: For each thread, CPU registers at time of dump
- Memory mappings: Which files/libraries are loaded at which addresses
- Thread information: All threads and their states
- Signal information: What caused the dump (if crash-triggered)
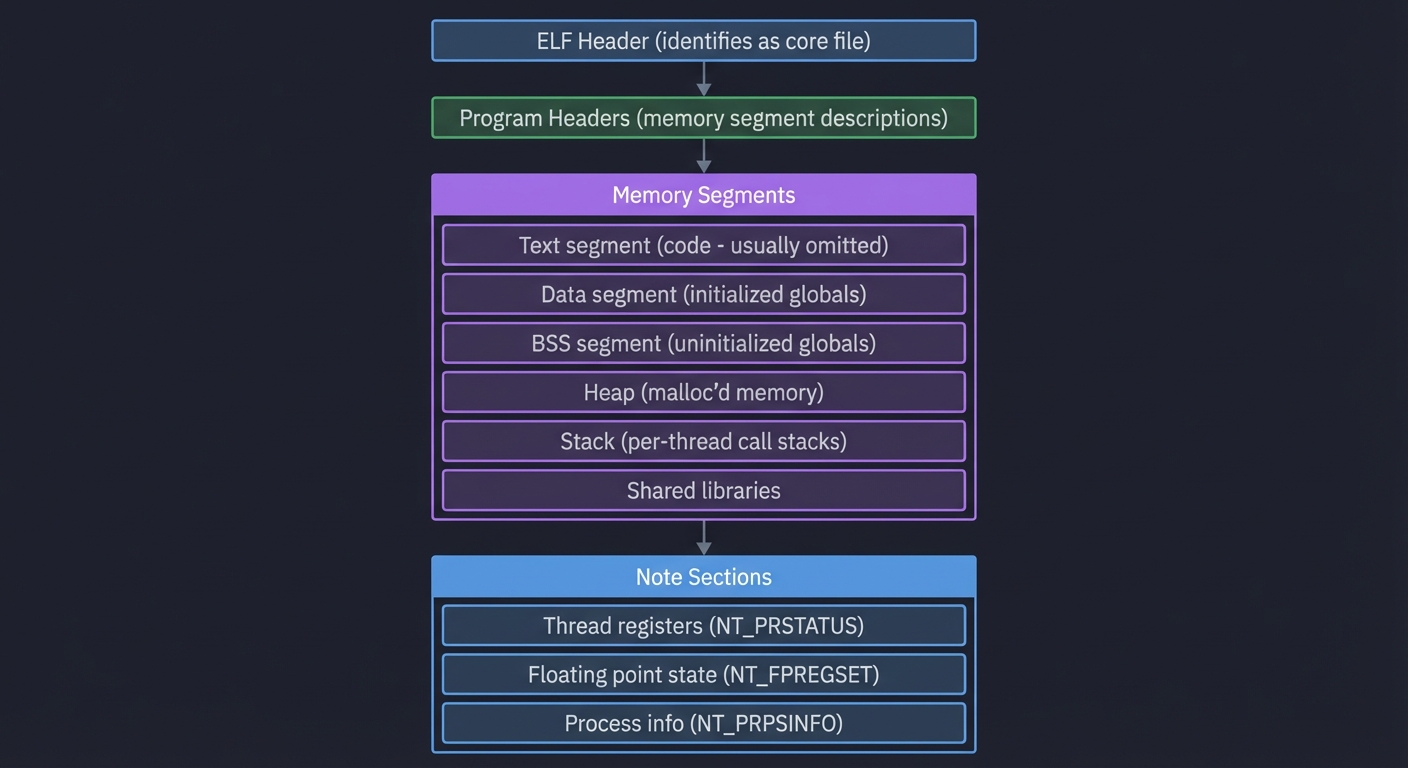
Core Dump Contents:
┌─────────────────────────────────────────────────┐
│ ELF Header (identifies as core file)            │
├─────────────────────────────────────────────────┤
│ Program Headers (memory segment descriptions)   │
├─────────────────────────────────────────────────┤
│ Memory Segments                                  │
│   ├─ Text segment (code - usually omitted)      │
│   ├─ Data segment (initialized globals)         │
│   ├─ BSS segment (uninitialized globals)        │
│   ├─ Heap (malloc'd memory)                     │
│   ├─ Stack (per-thread call stacks)             │
│   └─ Shared libraries                           │
├─────────────────────────────────────────────────┤
│ Note Sections                                    │
│   ├─ Thread registers (NT_PRSTATUS)             │
│   ├─ Floating point state (NT_FPREGSET)         │
│   └─ Process info (NT_PRPSINFO)                 │
└─────────────────────────────────────────────────┘
Why Core Dumps for Performance?
Unlike crashes (which leave a dump automatically), performance issues are insidious—the process keeps running, just slowly. Core dumps let you:
- Freeze time: Capture exact state during a latency spike
- Analyze offline: No pressure from production traffic
- Compare states: Dump during normal vs slow periods
- Investigate without live access: Analyze on development machine
Thread States and Performance Signals
When you examine a core dump, each thread is in one state:
Running (R): Thread was executing on CPU when dumped
- If multiple threads show same function → hot code path
- If single thread → CPU-bound bottleneck
Sleeping (S): Thread was blocked waiting for something
- Check what it’s waiting for (mutex, I/O, condition)
- Common:
pthread_cond_wait,__lll_lock_wait,poll
Disk Sleep (D): Uninterruptible sleep, usually I/O
- Indicates blocking I/O operation
- Common:
read,write,fsync
The Contention Pattern
When multiple threads compete for one lock:
Thread 1: [Running in __lll_lock_wait]     → Waiting for lock
Thread 2: [Running in __lll_lock_wait]     → Waiting for lock
Thread 3: [Running in critical_section]    → Holding lock
Thread 4: [Running in __lll_lock_wait]     → Waiting for lock
One thread holds the lock (doing real work), while others pile up waiting.
Stack Unwinding and Symbol Resolution
GDB reads the core dump and reconstructs call stacks by:
- Finding stack pointer (SP) from registers
- Walking the stack using frame pointers or DWARF info
- Mapping addresses to symbols using debug info
For this to work, you need:
- Executable with debug symbols (
-g) - Frame pointers not omitted (
-fno-omit-frame-pointer) - Or DWARF unwind info (
-gdwarf-4)
Complete Project Specification
What You’re Building
A performance investigation toolkit called autopsy that:
- Captures core dumps at the right moment (during performance issues)
- Analyzes thread states to identify blocked and hot threads
- Generates contention reports showing which locks are blocking progress
- Produces investigation reports with evidence and hypotheses
Functional Requirements
autopsy capture --pid <pid> --output <file>
autopsy analyze --core <file> --exe <path>
autopsy threads --core <file> --summary
autopsy locks --core <file> --contention
autopsy report --core <file> --output <report.md>
Example Analysis Report
Performance Autopsy Report
═══════════════════════════════════════════════════
Core file:    core.12345
Executable:   /opt/app/server
Capture time: 2025-01-27 14:23:17 (during latency spike)
Total threads: 8

Thread State Summary:
───────────────────────────────────────────────────
  Running:     1 thread  (Thread 3)
  Blocked:     6 threads (Threads 1,2,4,5,6,7)
  Sleeping:    1 thread  (Thread 8 - idle worker)

Contention Analysis:
───────────────────────────────────────────────────
Lock 0x7fff5a2b3c40 (request_queue_mutex):
  Holder:    Thread 3 (in process_request → disk_write)
  Waiters:   Threads 1, 2, 4, 5, 6, 7

  Thread 3 Stack (HOLDING LOCK):
    #0  disk_write()           at storage.c:127
    #1  process_request()      at handler.c:89
    #2  worker_loop()          at main.c:45

  Thread 1 Stack (WAITING):
    #0  __lll_lock_wait()      (kernel)
    #1  pthread_mutex_lock()
    #2  enqueue_request()      at queue.c:34
    #3  accept_connection()    at main.c:62

Root Cause Hypothesis:
───────────────────────────────────────────────────
Thread 3 is holding request_queue_mutex while performing
synchronous disk I/O (disk_write). This blocks all other
threads from enqueueing new requests.

Estimated impact: 6 threads blocked for duration of disk I/O
                  (typically 1-50ms per write)

Recommendations:
───────────────────────────────────────────────────
1. Move disk_write outside of critical section
2. Use async I/O (io_uring) for disk operations
3. Buffer writes and batch commit
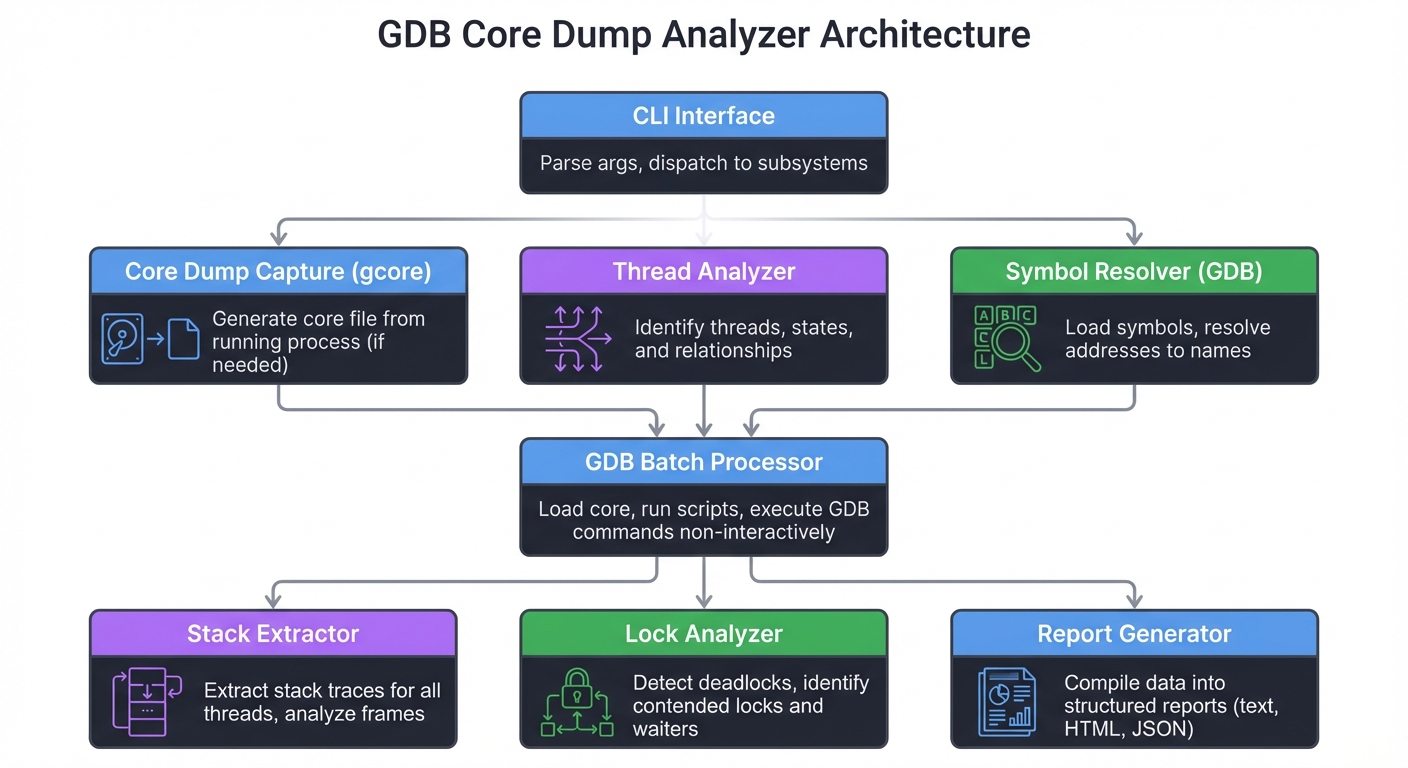
Solution Architecture
Component Design
┌─────────────────────────────────────────────────────────────┐
│                    CLI Interface                             │
│   Parse args, dispatch to subsystems                         │
└──────────────────────────┬──────────────────────────────────┘
                           │
          ┌────────────────┼────────────────┐
          │                │                │
          ▼                ▼                ▼
   ┌─────────────┐  ┌─────────────┐  ┌─────────────┐
   │ Core Dump   │  │ Thread      │  │ Symbol      │
   │ Capture     │  │ Analyzer    │  │ Resolver    │
   │ (gcore)     │  │             │  │ (GDB)       │
   └──────┬──────┘  └──────┬──────┘  └──────┬──────┘
          │                │                │
          └────────────────┼────────────────┘
                           │
                           ▼
           ┌───────────────────────────────┐
           │     GDB Batch Processor        │
           │  Load core, run scripts        │
           └───────────────┬───────────────┘
                           │
          ┌────────────────┼────────────────┐
          │                │                │
          ▼                ▼                ▼
   ┌─────────────┐  ┌─────────────┐  ┌─────────────┐
   │ Stack       │  │ Lock        │  │ Report      │
   │ Extractor   │  │ Analyzer    │  │ Generator   │
   └─────────────┘  └─────────────┘  └─────────────┘
GDB Automation Scripts
Thread Summary Script (thread_summary.gdb):
set pagination off
set logging file threads.txt
set logging on

echo ===== THREAD SUMMARY =====\n
info threads

echo ===== ALL BACKTRACES =====\n
thread apply all bt

echo ===== STACK FINGERPRINTS =====\n
thread apply all bt 3

set logging off
quit
Lock Analysis Script (lock_analysis.gdb):
set pagination off

# Find threads waiting on locks
thread apply all bt 5

# Look for __lll_lock_wait or pthread_mutex_lock
# in stack traces to identify blocked threads

# For each blocked thread, examine mutex address
# from function arguments

quit
Data Structures
// Thread state representation
typedef enum {
    THREAD_RUNNING,
    THREAD_BLOCKED_MUTEX,
    THREAD_BLOCKED_IO,
    THREAD_SLEEPING
} thread_state_t;

typedef struct {
    int tid;
    thread_state_t state;
    char **stack_frames;      // Array of function names
    int stack_depth;
    void *blocked_on;         // Mutex address if blocked
} thread_info_t;

// Lock contention analysis
typedef struct {
    void *mutex_addr;
    int holder_tid;           // -1 if unknown
    int *waiter_tids;
    int waiter_count;
} lock_contention_t;

// Complete analysis result
typedef struct {
    thread_info_t *threads;
    int thread_count;
    lock_contention_t *contentions;
    int contention_count;
    char *hypothesis;
} autopsy_result_t;
Phased Implementation Guide
Phase 1: Core Dump Capture (Days 1-2)
Goal: Reliably capture core dumps from running processes.
Steps:
- Configure system for core dump generation:
# Allow unlimited core size ulimit -c unlimited # Set core pattern (optional) echo '/tmp/core.%p' | sudo tee /proc/sys/kernel/core_pattern - Use
gcoreto capture from live process:gcore -o core_snapshot 12345 - Implement wrapper script with timestamp and process info
- Test with a simple blocking program
Validation: Core dump loads in GDB and shows backtraces.
Phase 2: Thread Analysis (Days 3-5)
Goal: Extract and categorize thread states from core dump.
Steps:
- Create GDB script to list all threads with states
- Parse GDB output to extract thread IDs and stack summaries
- Categorize threads by top stack frame:
__lll_lock_wait→ Blocked on mutexpoll/select/epoll_wait→ I/O wait- User function → Running
- Generate thread state summary
Validation: Correctly identifies blocked threads in test program.
Phase 3: Lock Contention Detection (Days 6-8)
Goal: Identify which locks are contended and by whom.
Steps:
- Identify mutex addresses from blocked thread stacks
- Find thread holding each mutex (if possible)
- Group threads by the mutex they’re waiting on
- Calculate contention severity (waiter count)
Validation: Correctly identifies holder and waiters in synthetic contention scenario.
Phase 4: Report Generation (Days 9-11)
Goal: Produce human-readable analysis with actionable insights.
Steps:
- Design report template with sections
- Generate hypothesis based on patterns:
- Many threads blocked on one lock → Critical section too long
- Threads blocked on I/O → Blocking I/O in hot path
- Single hot thread → CPU bottleneck
- Include evidence (stack traces, counts)
- Add recommendations based on patterns
Validation: Report correctly diagnoses synthetic issues.
Phase 5: Workflow Integration (Days 12-14)
Goal: Create end-to-end workflow for performance incidents.
Steps:
- Build investigation checklist
- Create capture-analyze-report pipeline
- Add comparison mode (normal vs incident core)
- Document usage for oncall scenarios
Validation: Full workflow runs from capture to report.
Testing Strategy
Synthetic Scenarios
Scenario 1: Lock Contention
// Create program where 10 threads wait on 1 lock
pthread_mutex_t hot_lock;
void *worker(void *arg) {
    pthread_mutex_lock(&hot_lock);
    sleep(10);  // Hold lock while core is captured
    pthread_mutex_unlock(&hot_lock);
}
Capture core during sleep, verify all threads shown as blocked on hot_lock.
Scenario 2: Hot Loop
// Create CPU-bound program
void *compute(void *arg) {
    volatile long sum = 0;
    while(1) { sum++; }  // Infinite loop
}
Capture core, verify thread shows in compute function.
Scenario 3: I/O Block
// Create I/O-blocked program
void *reader(void *arg) {
    int fd = open("/dev/zero", O_RDONLY);
    char buf[4096];
    while(1) { read(fd, buf, sizeof(buf)); }
}
Capture during read syscall.
Edge Cases
- Stripped binaries: Verify graceful handling
- Multi-process: Handle fork()’d children
- Very large core: Test with high memory usage
- Many threads: Test with 100+ threads
Common Pitfalls and Debugging
Pitfall 1: “No symbol table loaded”
Symptom: GDB shows addresses instead of function names.
Solution:
# Load symbols from executable
file /path/to/executable

# Load debug symbols if separate
add-symbol-file /path/to/executable.debug 0x0

# For shared libraries
set sysroot /path/to/sysroot
Pitfall 2: Core Dump Too Small
Symptom: Core dump is 0 bytes or very small.
Causes:
ulimit -c 0prevents core dumps- Disk full
- Core pattern points to invalid location
Debug:
ulimit -c            # Should show 'unlimited'
cat /proc/sys/kernel/core_pattern
df -h /tmp           # Check disk space
Pitfall 3: Wrong Executable Version
Symptom: Stack traces make no sense, functions don’t match code.
Cause: Core dump from different executable version than loaded.
Solution:
# Verify executable matches core
info files
# Shows build ID - must match

# Get build ID from core
eu-readelf -n core.12345 | grep Build
# Get build ID from executable
eu-readelf -n /path/to/exe | grep Build
Pitfall 4: Thread IDs Change
Symptom: Can’t correlate logs (using TID) with core dump threads.
Cause: GDB shows thread numbers, not system TIDs.
Solution:
info threads
# Shows LWP (Light Weight Process ID) which is the system TID
# Format: "Thread 0x7f... (LWP 12345)"
Extensions and Challenges
Extension 1: Automated Capture on Latency Spike
Build a monitoring agent that:
- Watches request latency (e.g., from log file)
- When p99 exceeds threshold, captures core dump
- Triggers analysis and sends alert
Extension 2: Core Dump Comparison
Implement side-by-side comparison:
- Compare thread states between “good” and “bad” core dumps
- Highlight differences in lock holding patterns
- Identify functions present in slow dump but not fast dump
Extension 3: Lock Graph Visualization
Generate graphical representation:
- Nodes = threads
- Edges = waiting-for relationships
- Detect deadlock cycles
- Show contention bottlenecks
Challenge: Production-Safe Capture
Design capture system that:
- Minimizes impact on running process
- Captures subset of memory for smaller dumps
- Works in containerized environments
- Handles thousands of threads efficiently
Real-World Connections
Production Scenarios
- Database Deadlock: Core dump reveals transaction holding locks while waiting for I/O
- Connection Pool Exhaustion: All handler threads blocked waiting for pool
- GIL Contention (Python): Multiple threads waiting on interpreter lock
- Memory Allocator Lock: Many threads blocked in malloc
Industry Practices
- Google: Automated core dump capture on SLO violation
- Linux Kernel: Crash dumps (kdump) for kernel debugging
- Mozilla: Crash reporter captures and symbolizes dumps
- Microsoft: WER (Windows Error Reporting) captures dumps automatically
Self-Assessment Checklist
Before considering this project complete, verify:
- You can capture a core dump from a running process
- You can load a core dump in GDB and see thread backtraces
- You can identify threads blocked on locks vs running
- You can determine which thread holds a contended lock
- You can distinguish CPU-bound from I/O-blocked patterns
- Your analysis script produces correct reports for synthetic scenarios
- You have a documented investigation checklist
Resources
Essential Reading
- “The Linux Programming Interface” by Kerrisk, Chapter 20: Signals
- “Debugging with GDB” (GNU documentation)
- “Operating Systems: Three Easy Pieces” by Arpaci-Dusseau, Chapter 26: Concurrency
Reference Documentation
- GDB manual: Examining core dumps
- core(5) man page: Core dump file format
- gcore(1) man page: Generating core dumps
Tools
- GDB: GNU Debugger
- gcore: Generate core dump from process
- eu-readelf: ELF file analysis (elfutils)
- addr2line: Convert addresses to file/line