Project 2: perf + Flamegraph Investigator
Project Overview
| Attribute | Details |
|---|---|
| Difficulty | Intermediate |
| Time Estimate | 1-2 weeks |
| Primary Language | C |
| Alternative Languages | Rust, Go, C++ |
| Knowledge Area | Profiling and Flamegraphs |
| Tools Required | perf, flamegraph scripts, graphviz |
| Primary Reference | “Systems Performance” by Brendan Gregg |
Learning Objectives
By completing this project, you will be able to:
- Configure perf for accurate sampling with appropriate sample rates and event types
- Generate and interpret flamegraphs understanding what width, depth, and color represent
- Attribute CPU time to specific functions and explain why they’re hot
- Distinguish CPU-bound work from I/O wait using different profiling modes
- Build repeatable profiling workflows that can be automated in CI/CD
- Cross-validate findings using multiple profiling tools
Deep Theoretical Foundation
How Sampling Profilers Work
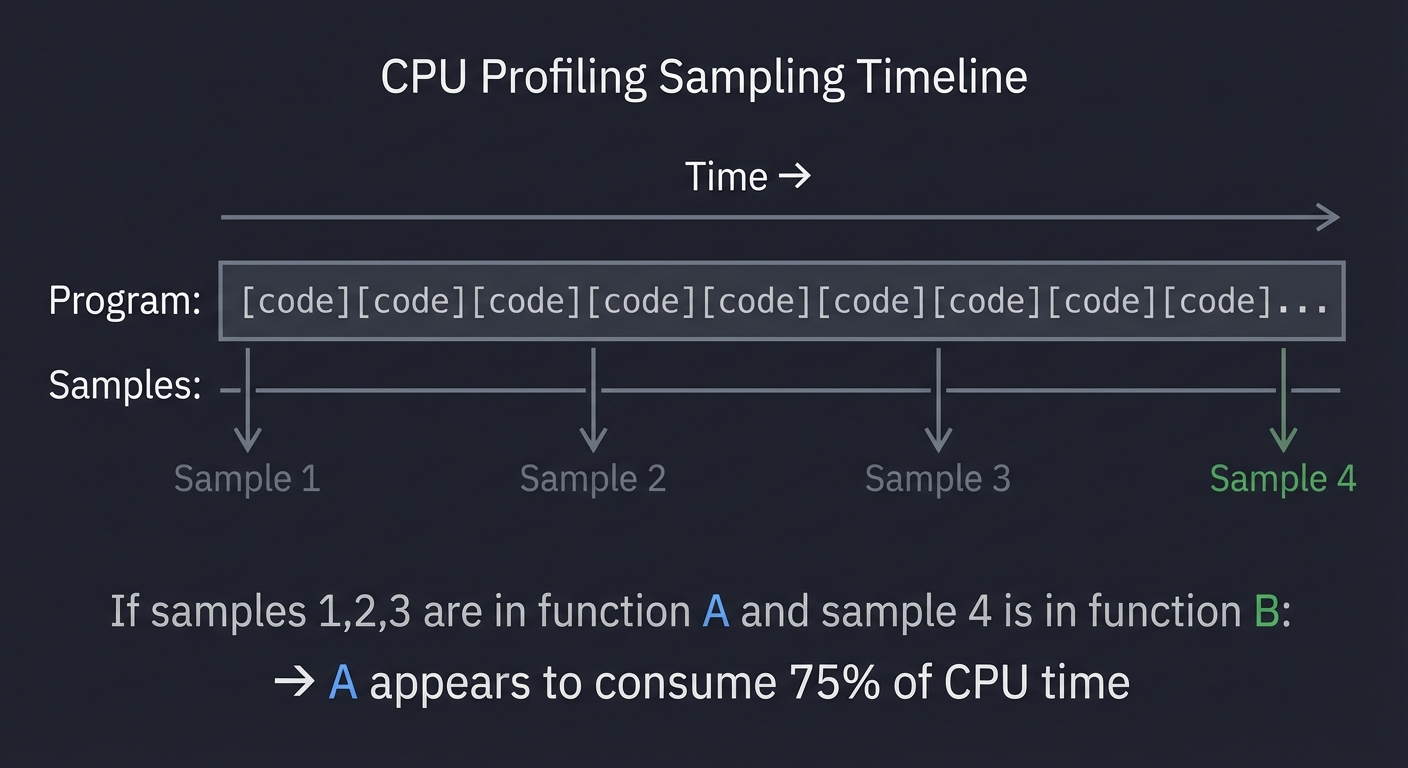
Unlike instrumentation (which adds code at every function entry/exit), sampling profilers periodically interrupt the program and record its current state. This approach has fundamental trade-offs you must understand:
The Sampling Process
Every 1/sample_rate seconds, the kernel interrupts your program and captures:
- The current instruction pointer (IP)
- The call stack (all return addresses on the stack)
- Optional: CPU registers, counter values
Time →
Program: [code][code][code][code][code][code][code][code]...
Samples:      ↑           ↑           ↑           ↑
              Sample 1    Sample 2    Sample 3    Sample 4

If samples 1,2,3 are in function A and sample 4 is in function B:
→ A appears to consume 75% of CPU time
Sample Rate Trade-offs
- High rate (10,000 Hz): More samples = more precision, but higher overhead (1-5% CPU)
- Low rate (100 Hz): Minimal overhead, but may miss short-lived functions
- Default (99 Hz): Avoids lockstep with 100 Hz kernel timers, good balance
Why Sampling Can Mislead
-
Short functions are invisible: A function running 100 microseconds between samples will never be captured, even if it runs 1000 times per second.
-
Inlined functions disappear: Compiler inlining merges functions, so the “hot” function shown is actually its caller.
-
Kernel time is separate: By default, perf only shows user-space time. Kernel time (syscalls) requires additional configuration.
Understanding Call Stacks
A call stack is the chain of function calls that led to the current instruction:
main()
 └→ process_request()
     └→ parse_input()
         └→ json_decode()
             └→ utf8_validate() ← Current IP
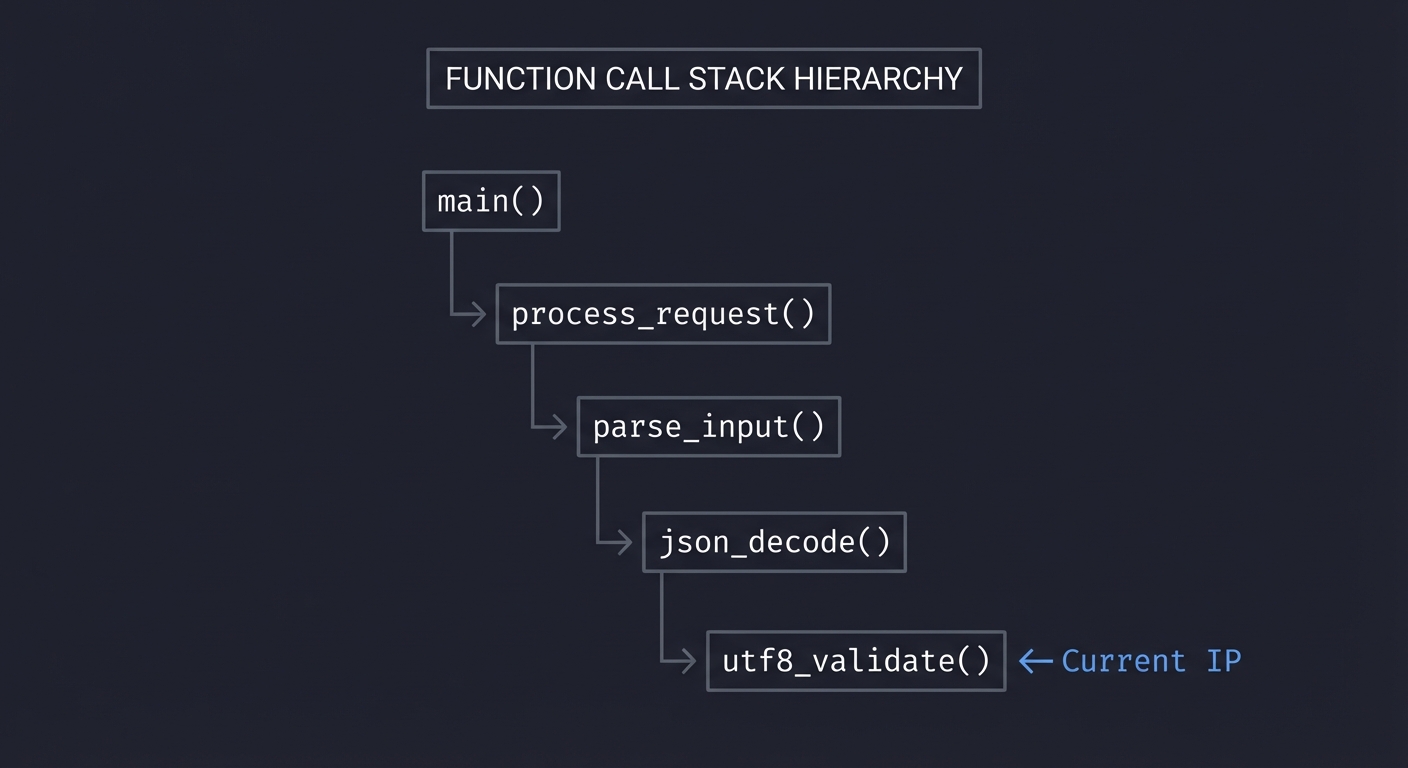
When we sample, we record this entire chain. Over many samples, we can determine:
- Which functions are directly consuming CPU (leaf functions)
- Which functions are responsible for CPU consumption (ancestors)
The Attribution Problem
Consider this stack sampled 100 times:
main → process → parse → validate (100 samples)
Who is “responsible” for the CPU time?
validateis doing the actual work (leaf)parsecalledvalidate(parent)mainstarted everything (root)
The answer depends on what you can change. If validate is a library function you can’t modify, then parse calling it unnecessarily is the problem.
Flamegraph Anatomy
Flamegraphs are a visualization invented by Brendan Gregg that makes call stack data intuitive:
┌─────────────────────────────────────────────────────────────────────┐
│                              main                                    │
├──────────────────────────────────┬──────────────────────────────────┤
│          process_a               │            process_b             │
├───────────────┬──────────────────┼────────────┬─────────────────────┤
│    parse      │     compute      │   parse    │       render        │
├───────┬───────┼──────────────────┼────────────┼──────────┬──────────┤
│ json  │ xml   │                  │            │   html   │   css    │
└───────┴───────┴──────────────────┴────────────┴──────────┴──────────┘

Width = Time (samples)     Height = Stack Depth     Color = Frame type
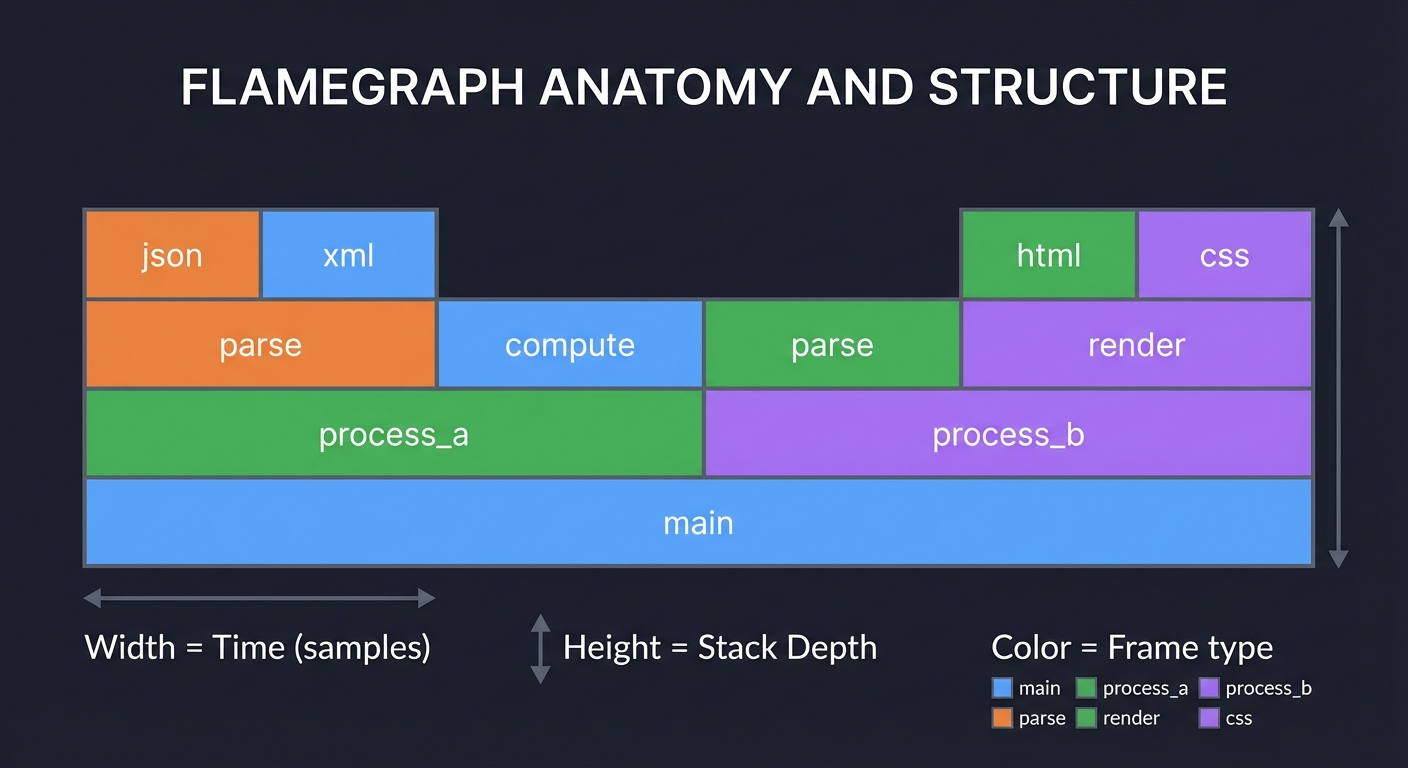
Reading Rules:
- Width is proportional to CPU time: Wider bars consumed more samples
- Height is call stack depth: Top of each column is the leaf function
- Parent-child is above-below: A function calls the functions directly above it
- Order is alphabetical by default: Horizontal position is for readability, not time
What to Look For:
- Plateaus: Wide flat tops indicate functions that consume CPU themselves (not via children)
- Towers: Tall thin stacks indicate deep call chains for rare events
- Repeated patterns: Same function appearing under multiple callers indicates a hot utility
CPU vs Off-CPU Profiling
Standard profiling captures CPU time—when your code is actively running. But programs also wait:
- I/O wait: Blocked on disk or network
- Lock contention: Waiting for a mutex
- Sleep: Explicitly sleeping
- Page faults: Waiting for memory pages
Off-CPU profiling captures what the program is waiting for:
CPU Flamegraph:        Shows where CPU cycles go
Off-CPU Flamegraph:    Shows where time goes while NOT on CPU
Combining both gives complete picture of latency.
Complete Project Specification
What You’re Building
A profiling workflow called profile_run that:
- Captures CPU profiles using perf with configurable duration and sample rate
- Generates flamegraph SVGs with proper symbolization
- Produces analysis reports identifying top hotspots with sample counts
- Compares profiles to show before/after differences
- Stores artifacts for historical comparison
Functional Requirements
profile_run capture --workload <cmd> --duration <sec> --output <dir>
profile_run flamegraph --input <perf.data> --output <svg>
profile_run analyze --input <perf.data> --top <n>
profile_run diff --before <perf.data> --after <perf.data> --output <svg>
Output Artifacts
- perf.data: Raw profile data for reprocessing
- flamegraph.svg: Interactive flamegraph visualization
- folded.txt: Collapsed stack traces for custom analysis
- report.txt: Human-readable hotspot analysis
Example Analysis Report
Flamegraph Profiling Report
═══════════════════════════════════════════════════
Workload:        web_server
Date:            2025-01-27 15:45:22
Duration:        30 seconds
Sample rate:     99 Hz
Total samples:   2,970
Debug symbols:   Available

Top CPU Hotspots (by sample count):
───────────────────────────────────────────────────
1) parse_input              1,128 samples (38.0%)
   ├─ json_parse               687 samples (23.1%)
   ├─ validate_schema          298 samples (10.0%)
   └─ utf8_decode              143 samples (4.8%)

2) hash_lookup                624 samples (21.0%)
   ├─ hash_compute             374 samples (12.6%)
   └─ bucket_scan              250 samples (8.4%)

3) serialize_output           416 samples (14.0%)
   └─ json_encode              312 samples (10.5%)

Optimization Recommendations:
───────────────────────────────────────────────────
• json_parse (23.1%): Primary bottleneck
  → Consider: simdjson, pre-parsed schemas

• hash_compute (12.6%): Hash function overhead
  → Consider: faster hash (xxhash), perfect hashing

Artifacts saved:
  Profile: profiles/web_server_2025-01-27.data
  Flamegraph: reports/web_server_2025-01-27.svg
  Folded: reports/web_server_2025-01-27.folded
Solution Architecture
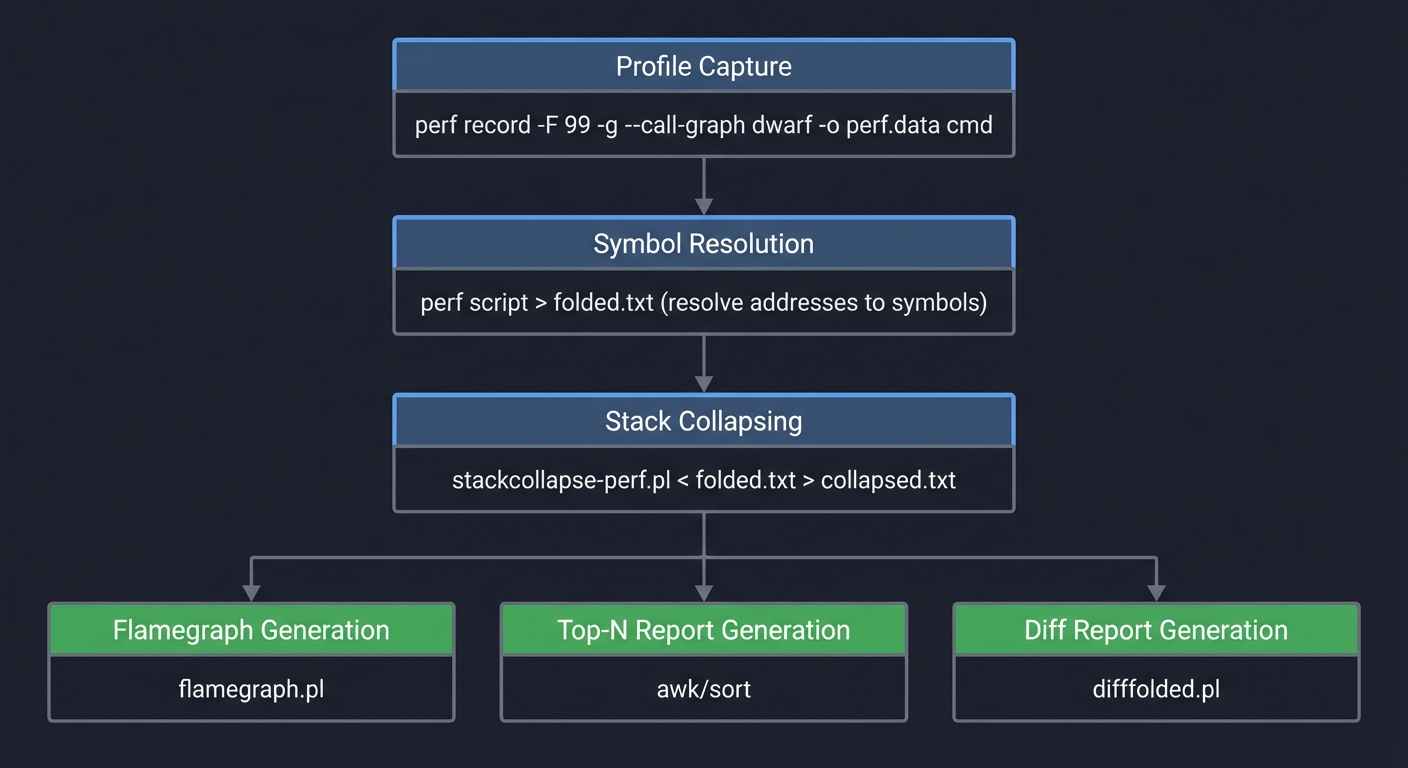
Workflow Pipeline
┌──────────────────────────────────────────────────────────────┐
│                      Profile Capture                          │
│  perf record -F 99 -g --call-graph dwarf -o perf.data cmd    │
└─────────────────────────────┬────────────────────────────────┘
                              │
                              ▼
┌──────────────────────────────────────────────────────────────┐
│                     Symbol Resolution                         │
│  perf script > folded.txt (resolve addresses to symbols)     │
└─────────────────────────────┬────────────────────────────────┘
                              │
                              ▼
┌──────────────────────────────────────────────────────────────┐
│                   Stack Collapsing                            │
│  stackcollapse-perf.pl < folded.txt > collapsed.txt          │
└─────────────────────────────┬────────────────────────────────┘
                              │
          ┌───────────────────┼───────────────────┐
          │                   │                   │
          ▼                   ▼                   ▼
┌──────────────────┐ ┌──────────────────┐ ┌──────────────────┐
│   Flamegraph     │ │   Top-N Report   │ │   Diff Report    │
│   Generation     │ │   Generation     │ │   Generation     │
│   flamegraph.pl  │ │   awk/sort       │ │   difffolded.pl  │
└──────────────────┘ └──────────────────┘ └──────────────────┘
Key Components
1. Profile Capture Script
Handles perf invocation with correct flags for symbol resolution:
#!/bin/bash
# Ensure debug symbols are available
# Use dwarf for accurate stack unwinding
# Sample at 99 Hz to avoid timer aliasing

perf record \
    -F 99 \                     # 99 samples/sec
    -g \                        # Capture call graphs
    --call-graph dwarf \        # Use DWARF for unwinding
    -o "$output_dir/perf.data" \
    -- "$@"                     # Command to profile
2. Symbolization Pipeline
Converts raw addresses to function names:
perf script -i perf.data > perf.script
stackcollapse-perf.pl perf.script > collapsed.txt
3. Flamegraph Generator
Creates interactive SVG:
flamegraph.pl \
    --title "CPU Profile: $workload" \
    --subtitle "Duration: ${duration}s, Samples: $total" \
    --width 1200 \
    --colors java \             # Color scheme
    collapsed.txt > flamegraph.svg
4. Analysis Engine
Parses collapsed stacks to extract hotspots:
# Extract leaf functions (actual CPU consumers)
awk -F';' '{print $NF}' collapsed.txt |
    awk '{sum[$1]+=$2} END {for(k in sum) print sum[k],k}' |
    sort -rn | head -20
Phased Implementation Guide
Phase 1: Basic Profiling (Days 1-2)
Goal: Capture a profile and generate a flamegraph for a test workload.
Steps:
- Install flamegraph scripts from GitHub
- Create a CPU-intensive test workload (e.g., recursive Fibonacci)
- Compile with debug symbols (
-g -fno-omit-frame-pointer) - Run perf record and generate flamegraph
- Open SVG in browser and explore interactively
Validation: Flamegraph shows expected function hierarchy.
Phase 2: Symbol Resolution (Days 3-4)
Goal: Ensure all functions are properly named, not [unknown].
Steps:
- Investigate
[unknown]symbols—usually missing debug info - Add
-fno-omit-frame-pointerto compiler flags - Use
--call-graph dwarffor better unwinding - Handle stripped binaries with external debuginfo
Validation: Less than 5% of samples show [unknown].
Phase 3: Analysis Report (Days 5-7)
Goal: Automate hotspot extraction and report generation.
Steps:
- Parse collapsed stack format
- Calculate sample percentages per function
- Identify call hierarchies (parent-child relationships)
- Generate human-readable report with recommendations
Validation: Report correctly identifies known hotspots.
Phase 4: Differential Profiling (Days 8-10)
Goal: Compare before/after profiles to show optimization impact.
Steps:
- Capture baseline profile
- Make code change
- Capture new profile
- Use difffolded.pl to generate differential flamegraph
- Report which functions improved/regressed
Validation: Synthetic optimization shows expected diff.
Phase 5: Automation and Storage (Days 11-14)
Goal: Create repeatable workflow with artifact storage.
Steps:
- Bundle into shell script or Makefile
- Add timestamp-based output directories
- Implement profile comparison against baselines
- Add CI integration hooks
Validation: Workflow runs unattended and produces consistent artifacts.
Testing Strategy
Synthetic Workload Tests
- Known distribution: Create workload where time is 50% A, 30% B, 20% C
- Verify flamegraph widths match expected ratios
- Deep call stack: Create 20-level recursion
- Verify all levels appear in flamegraph
- Inlined functions: Force inlining and verify impact
- Inlined functions should not appear as separate bars
Cross-Validation
- Compare with
perf top: Live hotspots should match flamegraph - Compare with gprof: Different profiler, similar results
- Manual inspection: Insert known delays and verify attribution
Edge Cases
- Multi-threaded: Verify thread attribution is correct
- Short-lived processes: Capture startup and teardown
- Kernel time: Enable kernel profiling and verify syscall visibility
Common Pitfalls and Debugging
Pitfall 1: All Samples Show [unknown]
Symptom: Flamegraph is full of [unknown] instead of function names.
Causes and Solutions:
- Missing debug symbols: Recompile with
-g - Frame pointer omitted: Add
-fno-omit-frame-pointer - Stripped binary: Use
--call-graph dwarfinstead of fp - JIT code: Need special handling (perf-map-agent for Java)
Pitfall 2: Flamegraph Shows Wrong Time Attribution
Symptom: Known-slow function doesn’t appear hot.
Causes:
- Function is inlined: Check assembly with
objdump -d - Time is in kernel: Run perf with kernel visibility
- I/O wait: CPU profiling misses blocking time
Debug: Compare wall-clock time vs CPU time for the function.
Pitfall 3: Profile Is Too Noisy
Symptom: Different runs show different hotspots.
Solutions:
- Increase sample count (longer duration)
- Run workload at steady state, skip startup
- Pin CPU and control for frequency scaling
- Average multiple profiles
Pitfall 4: Flamegraph SVG Won’t Open
Symptom: Browser shows blank page or error.
Causes:
- Empty collapsed stacks: Check intermediate files
- Invalid characters in function names: Sanitize C++ mangled names
- SVG too large: Reduce sample count or filter stacks
Extensions and Challenges
Extension 1: Off-CPU Profiling
Add off-CPU profiling to capture blocking time:
# Using bpftrace for off-CPU profiling
bpftrace -e '
kprobe:finish_task_switch {
    @[kstack] = count();
}'
Generate off-CPU flamegraph showing where time is spent waiting.
Extension 2: Differential Flamegraphs
Implement automatic regression detection:
- If a function’s sample percentage increases by >5%, flag as regression
- Color regressions red in differential flamegraph
- Send alert with function name and change magnitude
Extension 3: Memory Profiling
Extend to profile memory allocation patterns:
- Use
perf record -e malloc:*for allocation tracing - Generate allocation flamegraph
- Identify allocation hotspots
Challenge: Production Profiling
Design a low-overhead profiling system suitable for production:
- Continuous 1 Hz sampling with minimal impact
- Automatic hotspot detection and alerting
- Historical trend analysis
Real-World Connections
How This Applies in Production
-
Incident Response: When latency spikes, the first question is “what’s consuming CPU?” Flamegraphs answer this in seconds.
-
Optimization Prioritization: Flamegraph width tells you where to focus. Optimizing a 2% function is wasted effort.
-
Code Review: Attach flamegraphs to PRs for performance-sensitive changes.
-
Capacity Planning: CPU profiles reveal efficiency—more efficient code means fewer servers.
Industry Practices
- Netflix: Generates flamegraphs for every service continuously
- Uber: Uses differential flamegraphs in their CI/CD pipeline
- LinkedIn: Built “async-profiler” for low-overhead Java profiling
Self-Assessment Checklist
Before considering this project complete, verify:
- You can explain what sample rate means and how to choose it
- You understand why
[unknown]symbols appear and how to fix them - You can read a flamegraph and identify the primary bottleneck
- You know the difference between CPU time and wall-clock time
- You can generate a differential flamegraph showing optimization impact
- Your workflow can be automated and run in CI
- You can cross-validate findings with a second profiling tool
Resources
Essential Reading
- “Systems Performance” by Brendan Gregg, Chapter 6: CPUs
- Brendan Gregg’s Flamegraph documentation: https://www.brendangregg.com/flamegraphs.html
- “Performance Analysis and Tuning on Modern CPUs” by Denis Bakhvalov
Tools
- perf: Linux performance counters tool
- FlameGraph: https://github.com/brendangregg/FlameGraph
- async-profiler: Low-overhead Java profiler with flamegraph output
- speedscope: Web-based flamegraph viewer
Reference
- perf wiki: https://perf.wiki.kernel.org/
- Intel VTune (alternative commercial profiler)