Project 1: Performance Baseline Lab
Project Overview
| Attribute | Details |
|---|---|
| Difficulty | Beginner |
| Time Estimate | Weekend |
| Primary Language | C |
| Alternative Languages | Rust, Go, C++ |
| Knowledge Area | Benchmarking and Measurement |
| Tools Required | perf, time, taskset |
| Primary Reference | “Systems Performance” by Brendan Gregg |
Learning Objectives
By completing this project, you will be able to:
- Design repeatable benchmarks that produce consistent, comparable results
- Control measurement variance by eliminating CPU scaling, scheduler noise, and cache effects
- Calculate meaningful statistics including median, percentiles (p95, p99), and coefficient of variance
- Use hardware performance counters via perf_event_open to measure CPU cycles and cache misses
- Build regression detection workflows that compare current runs against historical baselines
- Explain why an optimization did or didn’t work with statistical evidence
Deep Theoretical Foundation
Why Measurement Comes First
Performance engineering begins with a paradox: you cannot optimize what you cannot measure, but measuring correctly is itself a performance problem. Every measurement introduces overhead, and every benchmark environment differs from production. The discipline of performance engineering starts with accepting this uncertainty and building systems that minimize and account for it.
The Anatomy of Benchmark Noise
When you run the same code twice, you get different results. Understanding why is fundamental:
CPU Frequency Scaling (Turbo Boost/Power States) Modern CPUs dynamically adjust their frequency based on thermal conditions, power budgets, and workload characteristics. Intel’s Turbo Boost can vary core frequency from 2.0 GHz to 5.0 GHz within milliseconds. If your first benchmark run happens during thermal throttling and your second during turbo boost, you’re measuring the CPU, not your code.
CPU Frequency Timeline During Benchmark:
Run 1: [2.8 GHz ───────────────────────] (thermal throttling)
Run 2: [4.2 GHz ───────────────────────] (turbo boost active)

Result: 33% "speedup" is actually measurement artifact
Solution: Lock CPU frequency using:
sudo cpupower frequency-set -g performance
echo 1 | sudo tee /sys/devices/system/cpu/intel_pstate/no_turbo
Scheduler Interference The Linux scheduler migrates processes between cores to balance load. Each migration invalidates the L1 and L2 caches of the destination core, causing 10-100 microseconds of cache refill time. With default scheduling, a 10ms benchmark might experience 5-10 migrations.
Solution: Pin process to a single core:
taskset -c 2 ./benchmark
Cache State (Cold vs Warm) The first access to data must fetch from DRAM (100+ cycles). Subsequent accesses hit cache (4-40 cycles). If you measure the first run, you’re measuring DRAM latency. If you measure after warmup, you’re measuring cache performance. Neither is wrong, but comparing them is meaningless.
Memory Access Timeline:
First Run:  [DRAM miss][DRAM miss][DRAM miss][L3 hit]...  Slow
Warmed Run: [L1 hit][L1 hit][L1 hit][L1 hit]...           Fast
Solution: Always include explicit warmup runs that don’t count toward measurement.
Statistical Foundations for Performance
Why Mean is Dangerous for Latency
Latency distributions are almost never normal. They typically have a long right tail where a few slow requests dominate the mean. Consider:
99 requests at 10ms + 1 request at 500ms
Mean: 14.9ms (misleading - suggests "about 15ms")
Median: 10ms (accurate - most requests are fast)
p99: 500ms (critical - 1% of users wait 50x longer)
Using the mean, you might conclude “performance is acceptable at 15ms” while 1% of your users experience 500ms latency.
Percentiles and Their Meaning
- p50 (Median): Half of requests are faster, half are slower. Represents the typical experience.
- p95: 95% of requests are faster. This is often the SLO target.
- p99: 99% of requests are faster. This is what your worst-case users experience.
- p99.9: 99.9% of requests are faster. At scale (millions of requests), this affects thousands of users.
Coefficient of Variance (CV)
CV = (Standard Deviation / Mean) × 100%
CV tells you how noisy your benchmark is:
- CV < 2%: Excellent stability, results are highly trustworthy
- CV 2-5%: Good stability, results are reliable
- CV 5-10%: Moderate noise, consider adding controls
- CV > 10%: High noise, results may not be meaningful
Statistical Significance
To claim a 5% improvement is real, you need evidence that the difference isn’t noise. The Mann-Whitney U test (non-parametric) or Welch’s t-test (parametric) provides a p-value:
- p < 0.05: Statistically significant (conventionally acceptable)
- p < 0.01: Highly significant
- p > 0.10: Cannot distinguish from noise
Hardware Performance Counters
Modern CPUs contain hundreds of performance monitoring units (PMUs) that count hardware events without software overhead. The most important counters:
CPU Cycles: Total clock cycles elapsed. Combined with time, reveals actual frequency.
Instructions: Instructions executed. Instructions/cycle (IPC) is a key efficiency metric:
- IPC > 2.0: Compute-bound, well-optimized
- IPC 1.0-2.0: Typical mixed workload
- IPC < 1.0: Memory-bound or stalling on dependencies
Cache References/Misses: L1, L2, L3 hits and misses. Cache miss rates reveal memory bottlenecks:
- L1 miss rate > 5%: Consider data layout optimization
- L3 miss rate > 1%: DRAM bandwidth may be limiting
Branch Misses: Mispredicted branches stall the pipeline for 15-20 cycles each. High misprediction rates (>5%) indicate unpredictable control flow.
Complete Project Specification
What You’re Building
A command-line benchmarking harness called perf_lab that:
- Runs configurable workloads with defined iteration counts and warmup phases
- Collects timing and hardware counter data for each run
- Calculates statistics including min, median, p95, p99, and CV
- Stores results in timestamped reports for historical comparison
- Detects regressions by comparing against baseline runs
Functional Requirements
perf_lab run --workload <name> --iters <n> [--warmup <n>] [--output <file>]
perf_lab compare --baseline <file> --current <file>
perf_lab report --latest
perf_lab list-workloads
Workload Types
- cpu_arithmetic: Integer arithmetic loop (L1-resident, tests raw CPU throughput)
- memory_sequential: Sequential array scan (tests memory bandwidth)
- memory_random: Random array access (tests cache miss penalty)
- mixed_compute: Combination workload for realistic scenarios
Output Format
Workload: memory_sequential
Configuration:
  Iterations: 100
  Warmup runs: 10
  Data size: 64 MB
  CPU pinned: core 2
  Frequency locked: yes

Results:
  Min:    12.14 ms
  Median: 12.42 ms
  p95:    12.89 ms
  p99:    13.21 ms
  Max:    14.03 ms
  CV:     2.3%

Hardware Counters:
  CPU cycles:       3.21e9
  Instructions:     2.14e9
  IPC:              0.67
  L1-dcache-misses: 4.2e6
  LLC-load-misses:  1.8e6

Saved: reports/memory_sequential_2025-01-15_143022.txt
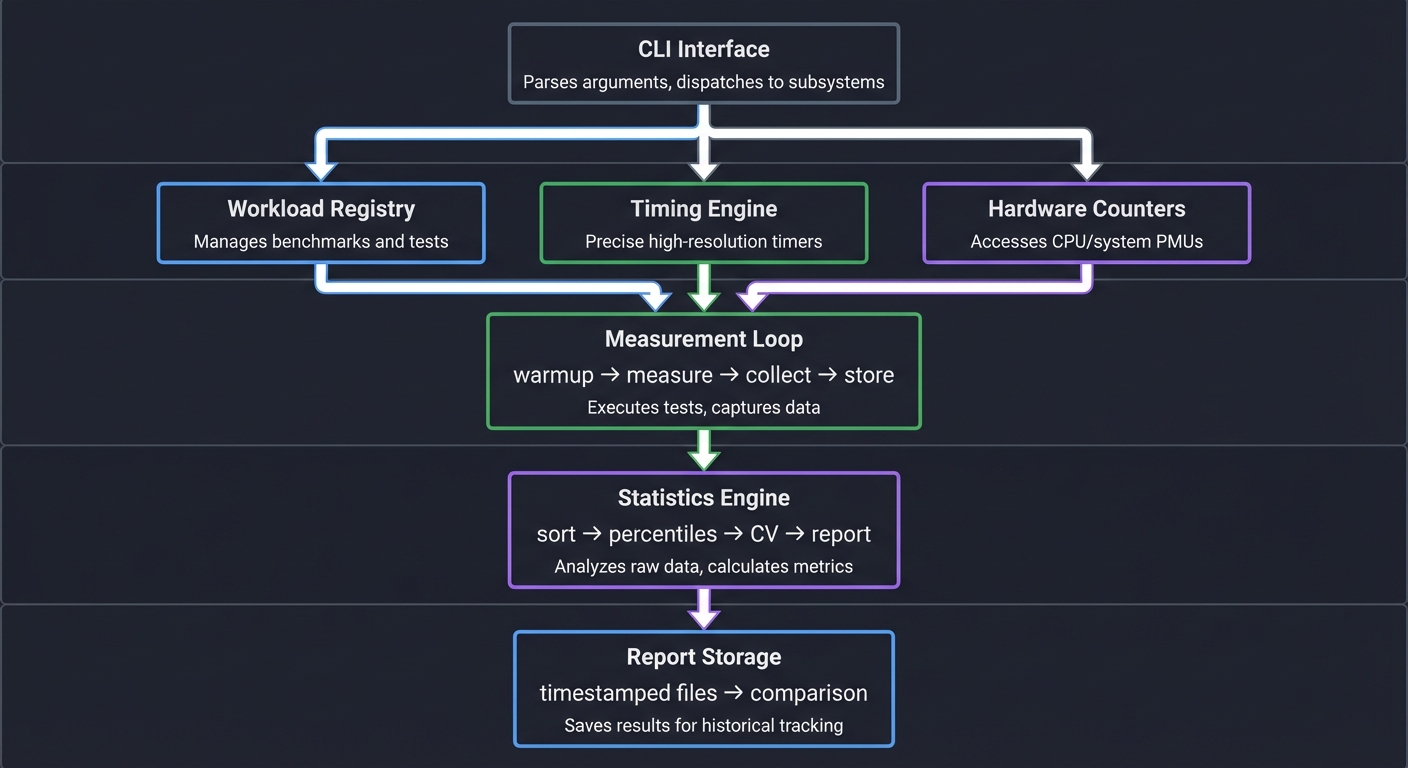
Solution Architecture
Component Design
┌─────────────────────────────────────────────────────┐
│                    CLI Interface                     │
│   Parses arguments, dispatches to subsystems         │
└──────────────────────┬──────────────────────────────┘
                       │
          ┌────────────┼────────────┐
          │            │            │
          ▼            ▼            ▼
    ┌──────────┐ ┌──────────┐ ┌──────────────┐
    │ Workload │ │ Timing   │ │ Hardware     │
    │ Registry │ │ Engine   │ │ Counters     │
    └────┬─────┘ └────┬─────┘ └───────┬──────┘
         │            │               │
         │            │               │
         ▼            ▼               ▼
    ┌─────────────────────────────────────────┐
    │           Measurement Loop              │
    │  warmup → measure → collect → store     │
    └─────────────────────────────────────────┘
                       │
                       ▼
    ┌─────────────────────────────────────────┐
    │          Statistics Engine              │
    │   sort → percentiles → CV → report      │
    └─────────────────────────────────────────┘
                       │
                       ▼
    ┌─────────────────────────────────────────┐
    │          Report Storage                 │
    │   timestamped files → comparison        │
    └─────────────────────────────────────────┘
Data Structures
// Workload function signature
typedef uint64_t (*workload_fn)(size_t param);

// Workload definition
typedef struct {
    const char *name;
    workload_fn fn;
    size_t default_param;
    const char *description;
} workload_t;

// Single measurement result
typedef struct {
    double wall_time_ns;
    uint64_t cpu_cycles;
    uint64_t instructions;
    uint64_t cache_misses;
    uint64_t branch_misses;
} measurement_t;

// Complete benchmark result
typedef struct {
    const char *workload_name;
    size_t iterations;
    size_t warmup;
    measurement_t *measurements;  // Array of size iterations
    // Computed statistics
    double min_ns, median_ns, p95_ns, p99_ns, max_ns;
    double cv_percent;
    double avg_ipc;
} benchmark_result_t;
Key Design Decisions
-
Volatile returns: Workload functions return
volatile uint64_tto prevent compiler optimization from eliminating the work. -
Pre-allocated measurement array: Allocate all storage before measurement to avoid malloc during timing.
-
Separate warmup phase: Warmup runs use identical code but discard results.
-
Nanosecond precision: Use
clock_gettime(CLOCK_MONOTONIC)for timing. -
perf_event_open for counters: Direct syscall access for lowest overhead.
Phased Implementation Guide
Phase 1: Basic Timing Harness (Day 1)
Goal: Run a workload N times and report min/median/max.
Steps:
- Implement
clock_gettimewrapper for nanosecond timing - Create a simple arithmetic workload function
- Write the measurement loop with warmup support
- Implement percentile calculation using qsort
Validation: Run 100 iterations, verify CV < 10% on a quiet machine.
Phase 2: Variance Control (Day 1-2)
Goal: Add CPU pinning and frequency control verification.
Steps:
- Add
sched_setaffinitycall to pin to specified core - Read
/proc/cpuinfoto verify CPU frequency - Add warning if frequency scaling is detected
- Implement ASLR detection and warning
Validation: Compare CV before and after controls. Should drop significantly.
Phase 3: Hardware Counters (Day 2)
Goal: Collect CPU cycles, instructions, and cache misses via perf_event_open.
Steps:
- Implement perf_event_open wrapper for single counter
- Extend to support counter groups (cycles + instructions simultaneously)
- Calculate IPC from collected data
- Add cache miss counters
Validation: Compare perf_event_open results with perf stat output.
Phase 4: Multiple Workloads (Day 2-3)
Goal: Support pluggable workload types.
Steps:
- Create workload registry with function pointers
- Implement memory_sequential workload
- Implement memory_random workload
- Add CLI workload selection
Validation: Each workload should show distinct cache behavior.
Phase 5: Reporting and Storage (Day 3)
Goal: Save results and compare against baselines.
Steps:
- Define report file format (plain text or JSON)
- Implement report writing with timestamps
- Implement baseline comparison logic
- Add regression detection with percentage thresholds
Validation: Run twice, save reports, compare shows ~0% difference.
Testing Strategy
Unit Tests
- Percentile calculation: Test with known distributions
- CV calculation: Test with distributions of known variance
- Timer accuracy: Verify nanosecond resolution is achievable
Integration Tests
- Workload isolation: CPU workload should show 0% cache misses
- Cache behavior: Sequential vs random should show 10x+ cache miss difference
- Reproducibility: Same workload should produce CV < 5%
Validation Experiments
- CPU frequency test: Run with and without frequency locking, measure CV change
- Core pinning test: Run with and without pinning, measure variance
- Warmup test: Compare first-run latency vs warmed-up latency
Common Pitfalls and Debugging
Pitfall 1: Compiler Optimizes Away the Workload
Symptom: Workload runs in nanoseconds regardless of iteration count.
Cause: Compiler recognizes the result is unused and eliminates the code.
Solution: Use volatile for accumulator and return value:
volatile uint64_t sum = 0;
for (...) {
    sum += computation;
}
return sum;  // Must use the result
Pitfall 2: Inconsistent Results Between Runs
Symptom: CV > 20%, results vary wildly.
Debugging Steps:
- Check CPU frequency:
watch -n 0.1 'cat /proc/cpuinfo | grep MHz' - Check for competing processes:
ps aux --sort=-%cpu | head - Check thermal throttling:
sensors | grep Core - Verify CPU pinning:
taskset -cp <pid>
Pitfall 3: Hardware Counters Return Zero
Symptom: perf_event_open succeeds but reads return 0.
Cause: Counter was never enabled, or running inside container/VM.
Solution:
// Must explicitly enable the counter
ioctl(fd, PERF_EVENT_IOC_RESET, 0);
ioctl(fd, PERF_EVENT_IOC_ENABLE, 0);  // Enable BEFORE workload
// ... run workload ...
ioctl(fd, PERF_EVENT_IOC_DISABLE, 0); // Disable AFTER workload
Pitfall 4: Cache Warmup Not Working
Symptom: First measured run still shows high cache misses.
Cause: Warmup data doesn’t match measurement data.
Solution: Warmup must touch the exact same memory:
// WRONG: Warmup uses different array
for (int i = 0; i < WARMUP; i++) {
    dummy_work(temp_array);  // Different memory!
}

// RIGHT: Warmup uses same array
for (int i = 0; i < WARMUP; i++) {
    actual_workload(real_array);  // Same memory
}
Extensions and Challenges
Extension 1: Multi-Core Scaling Test
Modify the harness to run on multiple cores simultaneously and measure scaling efficiency. Calculate speedup as (single-core time) / (N-core time / N).
Extension 2: Memory Bandwidth Saturation
Create a workload that intentionally saturates memory bandwidth. Measure when adding more threads stops improving throughput.
Extension 3: Statistical Significance Testing
Implement Mann-Whitney U test to determine if two runs are statistically different. Add confidence intervals to reports.
Challenge: Detect and Report Outliers
Implement outlier detection (e.g., Tukey’s fences) and report which runs were anomalous. Include root cause hints based on counter data.
Real-World Connections
How This Applies in Production
-
CI/CD Integration: This benchmarking harness becomes the foundation for automated performance regression testing.
-
Capacity Planning: Understanding workload characteristics (CPU-bound vs memory-bound) directly informs hardware purchasing decisions.
-
Optimization Prioritization: Baseline data tells you which workloads are worth optimizing. A 10% improvement on a rare path is less valuable than 2% on a hot path.
-
SLA Validation: p99 measurements from this harness translate directly to SLA commitments.
Industry Examples
- Google’s Continuous Profiling: Uses similar measurement infrastructure to detect 1% regressions across millions of microservices.
- Facebook’s Automatic Bisection: Automatically pinpoints which commit caused a regression by comparing baselines.
- Netflix’s Chaos Engineering: Uses baseline measurements to detect performance impact of failure injection.
Self-Assessment Checklist
Before considering this project complete, verify:
- You can explain why median is better than mean for latency
- Your CV is consistently < 5% on a quiet machine
- You can demonstrate the effect of CPU pinning on variance
- Hardware counters produce plausible values matching
perf stat - Reports are timestamped and comparable
- You can detect a 5% regression with statistical confidence
- You understand why warmup is necessary and how many runs to use
Resources
Essential Reading
- “Systems Performance” by Brendan Gregg, Chapter 2: Methodology
- “High Performance Python” by Gorelick and Ozsvald, Chapter 1: Benchmarking
Reference Documentation
- Linux perf_event_open man page
- Intel 64 and IA-32 Architectures Software Developer’s Manual, Volume 3B (Performance Monitoring)
Tools
perf stat: Validate your counter measurementsturbostat: Monitor CPU frequency and power statescpupower: Control CPU frequency governor