Modern Garbage Collection - Deep Dive Mastery
Goal: Deeply understand the engineering marvels behind modern, high-performance garbage collectors like ZGC, Shenandoah, and G1. You will transition from basic “stop-the-world” concepts to mastering concurrent compaction, colored pointers, and the complex barrier systems that enable sub-millisecond pauses on multi-terabyte heaps. By the end, you’ll be able to explain exactly how JVM threads interact with the GC at the assembly level and why certain architectures are chosen for specific workloads.
Why Modern Garbage Collection Matters
For decades, Garbage Collection (GC) was seen as a “necessary evil.” It provided memory safety and developer productivity but at the cost of unpredictable “Stop-the-World” (STW) pauses. These pauses could freeze a high-frequency trading system or a real-time multiplayer game for seconds, making managed languages like Java or Go “unsuitable” for low-latency tasks.
In the last decade, we’ve entered the era of Concurrent Compaction. Modern GCs like ZGC and Shenandoah can mark, move, and update references to objects while the application is still running.
Consider the scale:
- ZGC can manage a 16TB heap with pause times consistently under 1ms.
- The JVM handles trillions of allocations per second in massive distributed systems.
- CVEs and Security: Manual memory management errors (use-after-free, double-free) account for ~70% of security vulnerabilities. GC eliminates these classes of bugs entirely.
Understanding GC is not just about “tuning flags”; it’s about understanding how the hardware, the operating system, and the language runtime cooperate to simulate “infinite memory.”
The Memory Hierarchy: Where GC Lives
Garbage collection is fundamentally a cache-locality and memory-bandwidth problem. To understand why modern GCs are designed the way they are, you must understand where the data actually lives.
┌─────────────────────────────────────────────────────────────────┐
│                         CPU                                      │
│  ┌─────────┐                                                    │
│  │ Registers│  ← Fastest (1 cycle), smallest (64 bytes)         │
│  └────┬────┘                                                    │
│       │                                                          │
│  ┌────┴────┐                                                    │
│  │ L1 Cache│  ← Very fast (4 cycles), small (64 KB)             │
│  └────┬────┘                                                    │
│       │                                                          │
│  ┌────┴────┐                                                    │
│  │ L2 Cache│  ← Fast (10 cycles), medium (256 KB)               │
│  └────┬────┘                                                    │
│       │                                                          │
│  ┌────┴────┐                                                    │
│  │ L3 Cache│  ← Moderate (40 cycles), larger (8 MB)             │
│  └────┬────┘                                                    │
└───────┼─────────────────────────────────────────────────────────┘
        │
┌───────┴─────────────────────────────────────────────────────────┐
│       RAM        ← Slow (100+ cycles), large (16+ GB)           │
└───────┴─────────────────────────────────────────────────────────┘
When a GC “scans” the heap, it’s pulling data from RAM into the CPU caches. If the GC isn’t careful, it can “pollute” the cache, kicking out your application’s useful data and causing a massive performance drop. This is why “Concurrent” collectors are so revolutionary—they attempt to do this work while the CPU is otherwise idle or on spare cores.
Core Concept Analysis
1. The Search for Life: Tracing vs. Reference Counting
There are two primary ways to find “garbage.”
Reference Counting keeps a tally. When the count hits zero, the object is dead. Pros: Immediate reclamation. Cons: Cannot handle circular references and has high overhead on every pointer update.
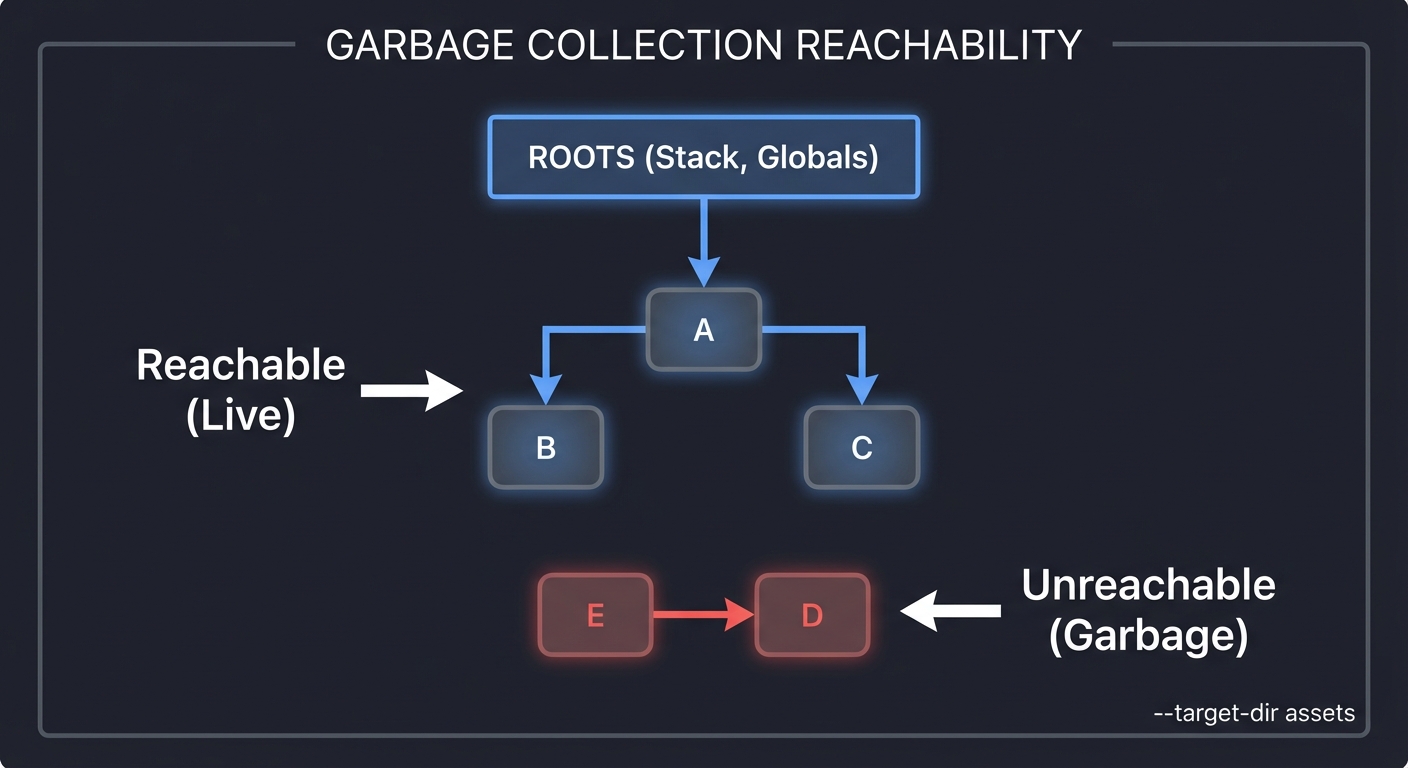
Tracing starts from “Roots” (Stack, Statics) and follows every pointer to find live objects. Anything not reached is garbage.
ROOTS (Stack, Globals)
  │
  ▼
[Object A] ───► [Object B]
  │               │
  ▼               ▼
[Object C]      [Object D] (Unreachable)
                  ▲
                  │
                [Object E] (Unreachable)

RESULT: D and E are collected, even if they point to each other.
2. The Tri-Color Marking Algorithm
To mark objects concurrently (while the app is running), we use a state machine.
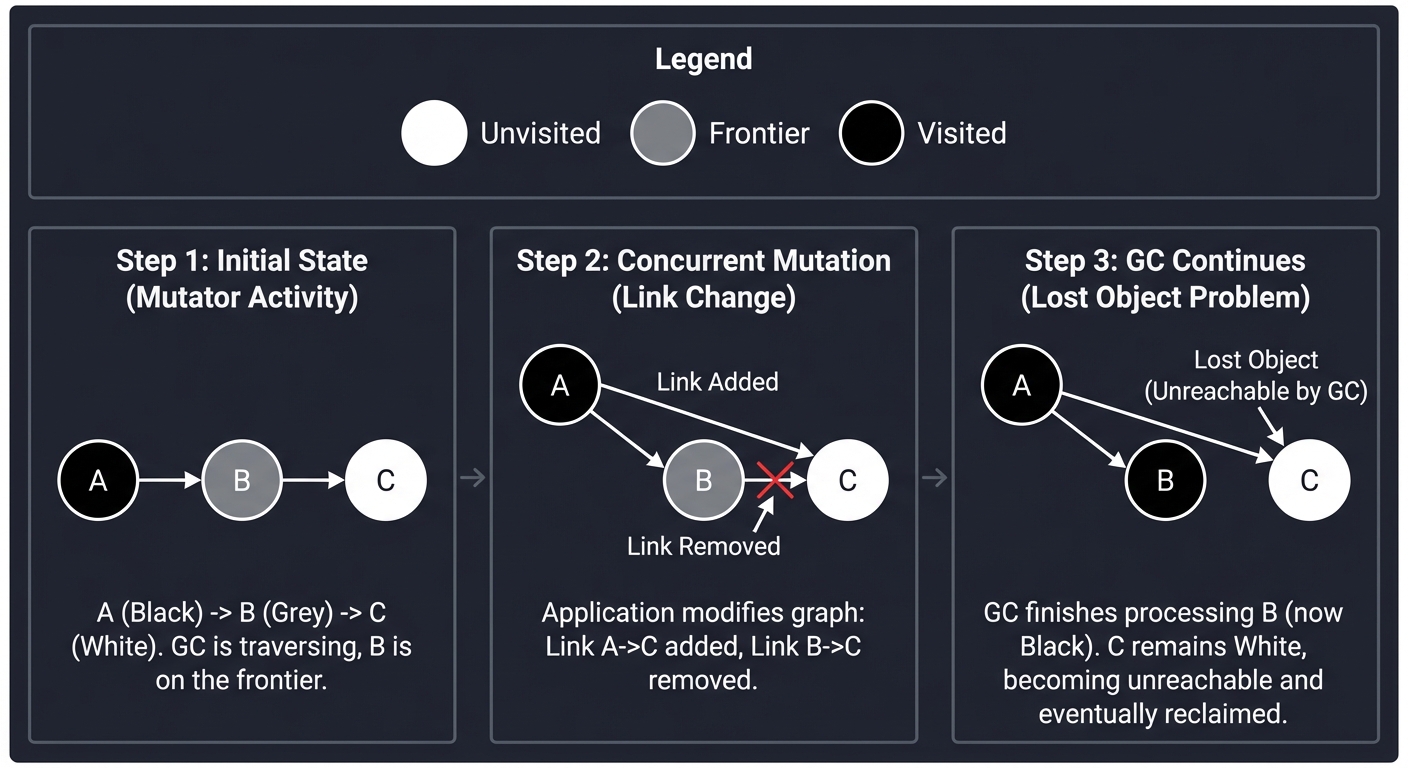
- ● WHITE: Unvisited. Potential garbage.
- ● GREY: Visited, but its children haven’t been scanned yet (the “Frontier”).
- ● BLACK: Visited, and all reachable children are also visited. Live.
The Concurrency Nightmare: If an application thread (the Mutator) moves a WHITE object from a GREY parent to a BLACK parent, the GC will never see that object again. It will stay WHITE and be deleted—even though it’s live!
Step 1: GC is at GREY Node A. Node C is WHITE.
[BLACK A] --- [GREY B] --- [WHITE C]

Step 2: Mutator moves C to point from A.
[BLACK A] --+ [GREY B]     [WHITE C]
            |                ^
            +----------------+

Step 3: GC finishes B, doesn't see C.
C is collected. SYSTEM CRASH.
3. Barriers: The Traffic Cops
To prevent the “Lost Object” problem, we use Barriers. These are tiny snippets of code injected by the JIT compiler into your application.
- Write Barrier (G1/Go): “I’m changing a reference! Let me tell the GC so it can re-scan this area.”
- Load Barrier (ZGC): “I’m reading a pointer! Let me check if the GC moved the object or if it needs marking.”
// Original C# / Java Code
myObj.field = otherObj;

// Compiled Assembly with Write Barrier (Simplified)
MOV [RAX+8], RBX      ; Perform the write
CALL gc_write_barrier ; Tell the GC: "Hey, something changed!"
4. Compaction and The “Moving” Problem
Marking is only half the battle. If you just delete objects, your memory becomes “Swiss Cheese” (Fragmentation). You eventually run out of space for large objects even if you have enough total memory.
Compaction moves objects together to create big blocks of free space.
[Obj A][Free][Obj B][Free][Obj C]  <-- Fragmented
      │        │        │
      ▼        ▼        ▼
[Obj A][Obj B][Obj C][  Free Space  ] <-- Compacted
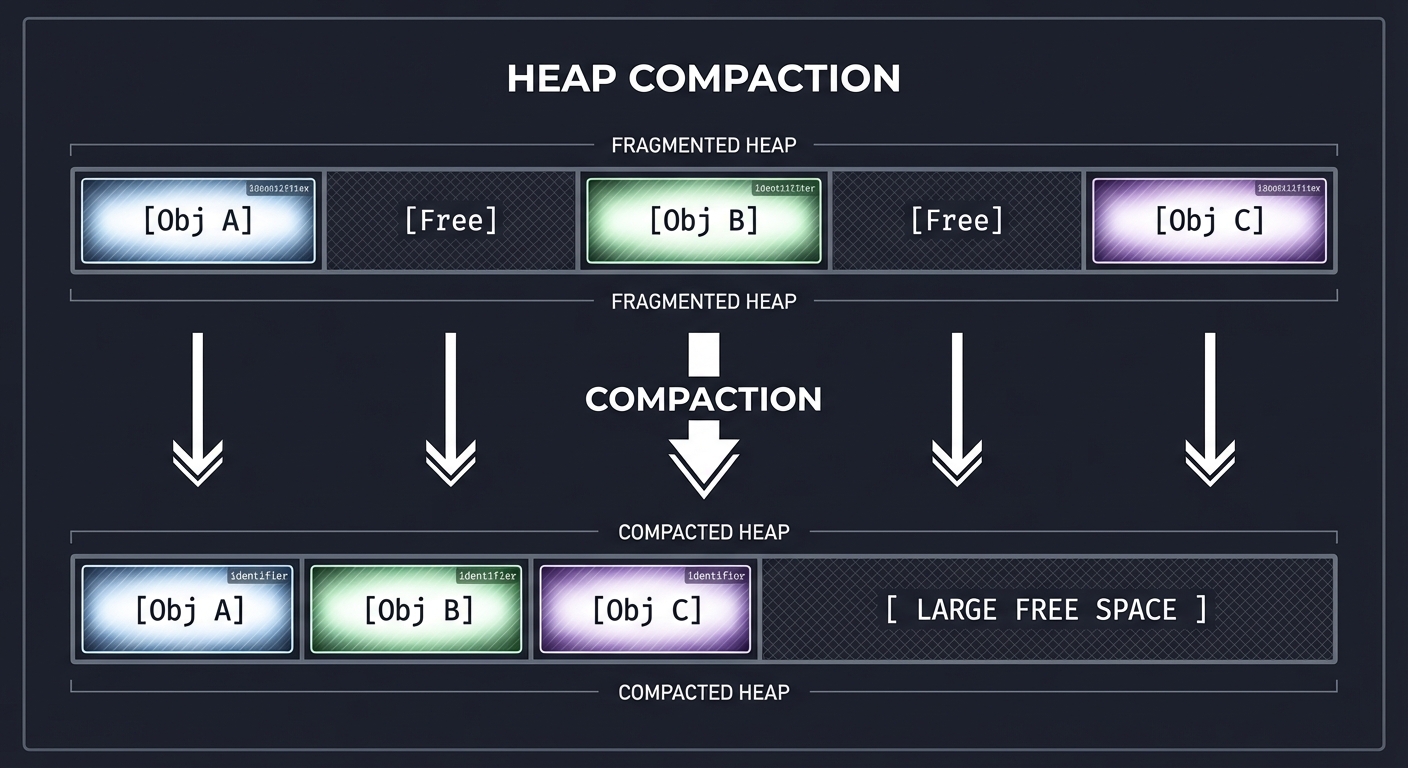
The Challenge: When you move Obj B, every pointer in the entire system that pointed to 0x1234 must now point to 0x5678.
5. Colored Pointers (ZGC’s Innovation)
Traditional GCs store metadata (like “is this object marked?”) in the Object Header. ZGC stores it in the Pointer itself.
64-bit Pointer Layout:
| 18 bits | 1 bit | 1 bit | 1 bit | 1 bit | 42 bits     |
| Unused  | Final | Remap | Mark1 | Mark0 | Address     |
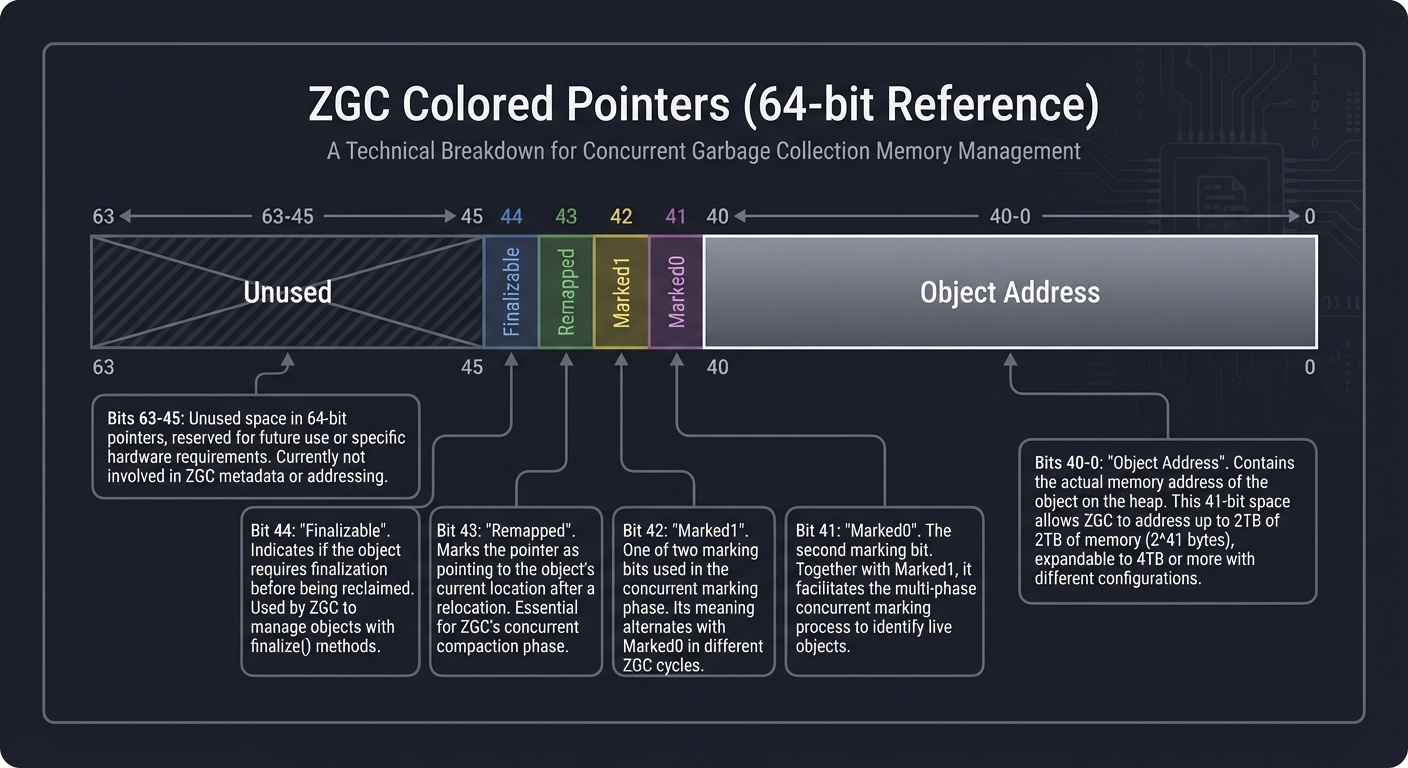
By looking at the pointer, the CPU can tell instantly via a Load Barrier if the address is stale without ever touching the actual memory of the object. This is what enables 1ms pauses on 16TB heaps.
Concept Summary Table
| Concept Cluster | What You Need to Internalize |
|---|---|
| Tracing Basics | Finding life from roots. The heap is a directed graph. |
| Tri-Color Marking | The formal logic for concurrent discovery. |
| Barriers | How the compiler helps the GC. The bridge between the app and the collector. |
| Compaction | Solving fragmentation by moving objects. The hardest part of GC. |
| Generational GC | The “Weak Generational Hypothesis”: most objects die young. |
| Region-based Heap | Breaking the heap into manageable chunks (G1, ZGC) instead of two giant pools. |
| Concurrency Invariants | SATB (Snapshot-at-the-Beginning) vs. Incremental Update. |
Deep Dive Reading by Concept
This section maps each concept to specific book chapters. Read these before or alongside the projects.
Foundations & Algorithms
| Concept | Book & Chapter |
|---|---|
| Basic Algorithms (Mark-Sweep, Copying) | “The Garbage Collection Handbook” (Jones et al.) — Ch. 2, 3, 4 |
| Reference Counting | “The Garbage Collection Handbook” — Ch. 5 |
| Allocation Strategies | “The Garbage Collection Handbook” — Ch. 7 |
Modern Collector Architectures
| Concept | Book & Chapter |
|---|---|
| Generational GC | “The Garbage Collection Handbook” — Ch. 9 |
| G1 (Garbage First) Internals | “Java Performance” (Scott Oaks) — Ch. 6 & “The Garbage Collection Handbook” — Ch. 16 |
| ZGC & Shenandoah (Concurrent) | “The Garbage Collection Handbook” — Ch. 17: “Concurrent and Real-time collection” |
| Barriers in Depth | “The Garbage Collection Handbook” — Ch. 11: “Barriers” |
Runtime & Hardware Interaction
| Concept | Book & Chapter |
|---|---|
| Stack Scanning & Safepoints | “The Garbage Collection Handbook” — Ch. 11.2 |
| Hardware Cache Effects | “The Garbage Collection Handbook” — Ch. 12 |
| JIT Compilation & Barriers | “Computer Systems: A Programmer’s Perspective” — Ch. 3 (Understanding the generated assembly) |
Project List
Projects are ordered from fundamental understanding to advanced implementations.
Project 1: The “Simpleton” Mark-Sweep (Tracing Basics)
- Main Programming Language: C
- Alternative Programming Languages: Rust, Zig
- Difficulty: Level 3: Advanced
- Knowledge Area: Memory Management
- Main Book: “The Garbage Collection Handbook” Ch. 2
What you’ll build: A minimal runtime where you allocate objects from a pre-allocated “Heap” array. When memory runs out, your gc() function triggers, pauses everything, marks reachable objects, and sweeps the rest.
Real World Outcome
You will build a custom memory management system from scratch. When your application runs out of memory, instead of crashing with a “Segmentation Fault” or “Out of Memory” error, you will see your GC wake up, scan the stack, identify live objects, and reclaim the “holes” in the heap.
Execution Trace:
$ gcc simple_gc.c -o simple_gc && ./simple_gc

[INIT] Virtual Heap initialized: 1024 bytes at 0x7fff5fbff000
[ALLOC] ObjA (64 bytes) -> Address: 0x7fff5fbff010
[ALLOC] ObjB (128 bytes) -> Address: 0x7fff5fbff050
[ALLOC] ObjC (512 bytes) -> Address: 0x7fff5fbff0d0
[ALLOC] ObjD (512 bytes) -> ERROR: Out of Memory!
[GC] --- PHASE: MARK ---
[GC] Scanning Root: stack_var_a (points to 0x7fff5fbff010) -> Marked ObjA
[GC] Scanning Root: stack_var_b (points to 0x7fff5fbff0d0) -> Marked ObjC
[GC] --- PHASE: SWEEP ---
[GC] Reclaiming unreachable object at 0x7fff5fbff050 (128 bytes)
[GC] COMPLETED. Reclaimed 128 bytes.
[ALLOC] Retrying ObjD (512 bytes) -> STILL ERROR: Not enough contiguous space.
# You've just discovered FRAGMENTATION!
The Core Question You’re Answering
“How do we identify ‘trash’ without knowing what trash is?”
Before you write any code, sit with this question. Most developers think GC searches for dead objects. It doesn’t. Dead objects are “invisible” to the GC. A GC searches for life. Anything it doesn’t find is, by definition, trash. This project teaches you the reachability algorithm that powers almost every modern language.
Concepts You Must Understand First
Stop and research these before coding:
- The Reachability Graph
- What is a “Root”? (Global variables, variables on the current stack).
- Why is the heap a Directed Graph?
- Book Reference: “The Garbage Collection Handbook” Ch. 2.1
- Finding the Stack Start/End
- How do you know where the C stack begins and where it currently is?
- Why do we need to scan the stack to find pointers to the heap?
- Book Reference: “Computer Systems: A Programmer’s Perspective” Ch. 3.7
- Object Headers (Metadata)
- Why does every object need a hidden “prefix” (header) to store its size and its “Mark Bit”?
- How do you jump from a pointer back to its header in memory?
- Book Reference: “The Garbage Collection Handbook” Ch. 11.2
- Padding & Alignment
- Why must objects be aligned (usually to 8 bytes) for the CPU to read them efficiently?
- Book Reference: “Write Great Code, Volume 1” Ch. 3
Questions to Guide Your Design
- Allocating Memory
- How will you manage a big block of memory (
char heap[1024])? - Will you use a “Free List” to keep track of available holes?
- How will you manage a big block of memory (
- Identifying Pointers
- If you see a random 64-bit number on the stack, how do you know if it’s a pointer to your heap or just a large integer? (This is why GCs are often “Conservative” or “Precise”).
- The Sweep Phase
- Once you’ve marked all live objects, how do you “sweep” the dead ones?
- Do you merge adjacent free blocks (Coalescing)?
Thinking Exercise
Trace a Reference Cycle
Before coding, trace this on paper:
struct Node {
    struct Node* next;
    int data;
};

void main() {
    struct Node* a = gc_alloc(sizeof(struct Node)); // Root A
    struct Node* b = gc_alloc(sizeof(struct Node)); // Not a root
    struct Node* c = gc_alloc(sizeof(struct Node)); // Not a root

    a->next = b;
    b->next = c;
    c->next = b; // CYCLE! B points to C, C points to B

    a = NULL; // Root A is now gone
    gc();
}
Questions while tracing:
- Even though B and C point to each other, are they reachable from the Roots?
- Why does simple Reference Counting fail here while Mark-Sweep succeeds?
- Draw the graph before and after
a = NULL.
The Interview Questions They’ll Ask
- “What is the difference between Mark-Sweep and Reference Counting?”
- “Why is a Mark-Sweep collector called ‘Stop-the-World’?”
- “What is a ‘Root’ in GC terms, and where do they typically live?”
- “How do you handle circular references in Mark-Sweep?”
- “What is fragmentation, and how does the Sweep phase contribute to it?”
Hints in Layers
Hint 1: The Virtual Heap
Don’t use malloc. Create a static char heap[1024*1024] and a char* next_free_ptr. This is called a “Bump Allocator.”
Hint 2: The Header struct Define a header that prefixes every object:
typedef struct {
    size_t size;
    int marked; // 0 = dead, 1 = live
} Header;
Hint 3: Marking from the Stack
To simulate roots, create a global array of pointers: void* roots[100]. In a real GC, you’d scan the assembly stack, but for Project 1, manually adding/removing pointers from roots is a great start.
Hint 4: Recursive Marking
Your mark(void* ptr) function should:
- Find the header (ptr - sizeof(Header)).
- If already marked, return (prevent infinite loops in cycles!).
- Mark it.
- Scan the object’s body for other pointers and call
mark()on them.
Books That Will Help
| Topic | Book | Chapter |
|---|---|---|
| Mark-Sweep Algorithm | “The Garbage Collection Handbook” | Ch. 2 |
| Heap Allocation Strategies | “The Garbage Collection Handbook” | Ch. 7 |
| Finding Roots on the Stack | “The Garbage Collection Handbook” | Ch. 11.2 |
| Stack Layout in C | “Computer Systems: A Programmer’s Perspective” | Ch. 3.7 |
Project 2: The “Nomad” Copying GC (Moving Objects)
- Main Programming Language: C
- Alternative Programming Languages: C++
- Difficulty: Level 3: Advanced
- Knowledge Area: Pointers & Relocation
- Main Book: “The Garbage Collection Handbook” Ch. 4
What you’ll build: A “Semi-Space” collector. You split your heap into two halves: FromSpace and ToSpace. When FromSpace is full, you copy all live objects into ToSpace and update every single pointer in your application to the new addresses.
Real World Outcome
You will create a memory manager that completely eliminates external fragmentation. Every time the GC runs, you will witness your objects being physically moved from one memory region to another and packed tightly. You’ll see that after collection, you have one giant, contiguous block of free space, allowing for incredibly fast “Bump Allocation.”
Execution Trace:
$ ./copying_gc

[ALLOC] ObjA (100 bytes) at 0x1000 (FromSpace)
[ALLOC] ObjB (100 bytes) at 0x1064 (FromSpace)
[DELETE] ObjA reference removed.
[ALLOC] ObjC (900 bytes) -> FromSpace Full!
[GC] --- PHASE: EVACUATE ---
[GC] ObjB is LIVE. Moving 0x1064 -> 0x2000 (ToSpace)
[GC] Writing Forwarding Address 0x2000 into old header at 0x1064
[GC] --- PHASE: PATCH ---
[GC] Root 'ptr_b' was 0x1064, now updated to 0x2000
[GC] --- PHASE: FLIP ---
[GC] ToSpace is now the active FromSpace.
[INFO] Recovered 100 bytes of fragmented space.
[ALLOC] ObjC (900 bytes) -> SUCCESS at 0x2064
The Core Question You’re Answering
“How do we move data while keeping the application from crashing?”
Moving objects is the most dangerous thing a GC can do. If you move an object but forget to update just one pointer that points to it, your program will access garbage memory and crash with a Segfault. This project teaches you the logic of Forwarding Pointers and the Cheney Scan algorithm.
Concepts You Must Understand First
- Semi-Space Layout
- Why do we only use 50% of the memory at any given time?
- What are the “FromSpace” and “ToSpace”?
- Book Reference: “The Garbage Collection Handbook” Ch. 4.1
- Forwarding Addresses
- When you move an object, how do you leave a “Forwarding Address” in the old location so other pointers can find it?
- Book Reference: “The Garbage Collection Handbook” Ch. 4.2
- Breadth-First vs. Depth-First Scanning
- What is the Cheney Scan, and why is it more memory-efficient than recursive marking?
- Book Reference: “The Garbage Collection Handbook” Ch. 4.3
Questions to Guide Your Design
- The Move Logic
- When you copy an object to
ToSpace, what happens to the internal pointers it contains? (They still point toFromSpace!). - How do you “fix” those pointers after the move?
- When you copy an object to
- Object Identification
- How can you tell if an object in
FromSpacehas already been moved? (Check for a “Forwarding Tag” in the header).
- How can you tell if an object in
- Allocation Performance
- Why is allocation in a Copying GC much faster than in a Mark-Sweep GC? (Hint: No free-list searching).
Thinking Exercise
The Relocation Race
Imagine you have a chain: Root -> Obj A -> Obj B.
- You copy
Obj Ato the new space. Rootnow points toNew A.New Astill points to theOld Bin the old space!- What happens if you delete the old space before you find
Old B?
Trace this process on paper:
- Draw the two spaces.
- Show the state of pointers after
Amoves but beforeBmoves. - Identify the “Scan Pointer” and “Free Pointer” in Cheney’s algorithm.
The Interview Questions They’ll Ask
- “Why does a Copying GC require twice as much memory as a Mark-Sweep GC?”
- “What is a ‘Forwarding Pointer’?”
- “Explain the Cheney Scan algorithm. Is it BFS or DFS?”
- “What is the primary advantage of a Copying GC over Mark-Sweep?”
- “How does a Copying GC improve CPU cache locality?”
Hints in Layers
Hint 1: Two Heaps
Define two global arrays: char space1[1024] and char space2[1024]. Use a pointer char* current_space to track which one is active.
Hint 2: The Forwarding Header Add a field to your header:
typedef struct {
    size_t size;
    void* forwarding_address; // NULL if not moved
} Header;
Hint 3: The Copy Function
The copy(void* old_ptr) function should:
- Check if
header->forwarding_addressis set. - If yes, return it.
- If no,
memcpythe object toToSpace, setforwarding_address, and return the new address.
Hint 4: The Cheney Scan
Maintain two pointers in ToSpace: scan and free.
freeis where you put new copies.scanis where you are currently looking for pointers to update.- When
scan == free, the GC is finished.
Books That Will Help
| Topic | Book | Chapter |
|---|---|---|
| Copying GC Fundamentals | “The Garbage Collection Handbook” | Ch. 4 |
| Allocation in Copying GCs | “The Garbage Collection Handbook” | Ch. 7.3 |
| The Cheney Algorithm | “The Garbage Collection Handbook” | Ch. 4.3 |
Project 3: The Generational Gap (Optimizing for Youth)
- Main Programming Language: C
- Alternative Programming Languages: Rust
- Difficulty: Level 4: Expert
- Knowledge Area: Generational Hypothesis
- Main Book: “The Garbage Collection Handbook” Ch. 9
What you’ll build: Enhance Project 1 by splitting the heap into a “Young Gen” and an “Old Gen.” You’ll implement a “promotion” policy: objects that survive 3 minor collections get moved (promoted) to the Old Gen.
Real World Outcome
You will implement the same optimization that makes the JVM and V8 (Chrome) so fast. You will observe how “Minor GCs” can reclaim huge amounts of memory in microseconds by ignoring the vast majority of the heap (the Old Generation). You’ll also implement a Write Barrier to handle the “Old-to-Young” pointer problem.
Execution Trace:
$ ./gen_gc

[ALLOC] 1000 short-lived objects in YoungGen (Nursery).
[ALLOC] 1 long-lived Cache object.
[GC] --- MINOR GC (YoungGen Only) ---
[GC] Scanned 1.2MB in 0.05ms.
[GC] 999 objects collected. 1 object promoted (Age 1).
[INFO] OldGen usage: 0.1%. No Major GC needed.
# Result: Your application continues with almost zero interruption.
The Core Question You’re Answering
“Why scan the whole desert if the water is only in the oasis?”
The Weak Generational Hypothesis states that “Most objects die young.” If you focus your energy on the “Nursery” (where new objects are born), you can reclaim most memory very quickly without looking at long-lived objects (like global configuration or caches).
Concepts You Must Understand First
- The Weak Generational Hypothesis
- Why do objects usually die quickly?
- Book Reference: “The Garbage Collection Handbook” Ch. 9.1
- Remembered Sets & Card Tables
- The “Old-to-Young” problem: If an object in the Old Gen points to an object in the Young Gen, how do you find it during a Minor GC without scanning the entire Old Gen?
- Book Reference: “The Garbage Collection Handbook” Ch. 9.4
- Promotion (Tenuring) Logic
- How do you track the “Age” of an object? (Usually a few bits in the header).
- Book Reference: “The Garbage Collection Handbook” Ch. 9.2
Questions to Guide Your Design
- Heap Partitioning
- How much of your total memory should be Young Gen vs. Old Gen? (Common ratio is 1:2 or 1:3).
- Promotion Threshold
- How many survival cycles are enough to prove an object is “Old”?
- The Write Barrier
- Every time an application thread writes a pointer, you must check: “Did an Old object just start pointing to a Young object?” If yes, you must record this in your Remembered Set.
Thinking Exercise
The Nursery Trap
Imagine your web server handles a request. It creates 1,000 small temporary objects (strings, JSON nodes).
- The request finishes. All 1,000 objects are now dead.
- A Minor GC runs.
- How many objects does the GC have to scan if it only looks at the Young Gen?
- How many would it have to scan if there was no Young Gen and it had to scan the whole 1GB heap?
Questions:
- Does the GC work harder when there is a lot of garbage or when there is a lot of live data?
The Interview Questions They’ll Ask
- “What is the Weak Generational Hypothesis?”
- “What is a ‘Minor GC’ vs. a ‘Major GC’ (or Full GC)?”
- “What is a ‘Remembered Set’ and why is it necessary?”
- “Explain ‘Card Table’ marking. How does it speed up Minor GCs?”
- “Why can’t we just use a Copying GC for everything?” (Hint: Memory overhead of 2x for large heaps).
Hints in Layers
Hint 1: Two Heaps (Again) Use your Copying GC (Project 2) for the Young Gen (it’s great for short-lived objects) and your Mark-Sweep (Project 1) for the Old Gen.
Hint 2: The Age Counter Update your header to include 2 bits for age:
typedef struct {
    unsigned int age : 2;
    unsigned int marked : 1;
    size_t size;
} Header;
Hint 3: The Promotion Trigger
When the Copying GC is about to move an object to ToSpace, check header->age. If age == 3, call move_to_old_gen(ptr) instead of moving it to ToSpace.
Hint 4: The Card Table
Create a byte array char card_table[HEAP_SIZE / 512].
Every time a pointer is written: card_table[address / 512] = 1.
During Minor GC, only scan the 512-byte blocks of the Old Gen that have a “dirty” card.
Books That Will Help
| Topic | Book | Chapter |
|---|---|---|
| Generational GC Theory | “The Garbage Collection Handbook” | Ch. 9 |
| Card Tables & Barriers | “The Garbage Collection Handbook” | Ch. 9.4 |
| Tenuring Strategies | “The Garbage Collection Handbook” | Ch. 9.2 |
| G1’s Generational approach | “Java Performance” | Ch. 6 |
Project 4: Tri-Color Visualizer (Concurrent Marking)
- Main Programming Language: JavaScript (React/SVG or D3.js)
- Alternative Programming Languages: Python (Pygame), Rust (Wasm + Leptos/Yew)
- Difficulty: Level 2: Intermediate
- Knowledge Area: Algorithm Visualization
- Main Book: “The Garbage Collection Handbook” Ch. 13
What you’ll build: An interactive web app where users can create “Object Nodes” and “Reference Edges.” You can then step through the Tri-Color Marking algorithm (White, Grey, Black) and simulate a “Mutator” (application thread) changing pointers while the GC is running.
Real World Outcome
You will create a tool that makes the abstract concept of concurrent marking visible and intuitive. You will be able to play with the algorithm, intentionally trying to “break” the GC by moving pointers during the marking phase, and then seeing how a Write Barrier catches and fixes your attempt.
Visual Outcome:
- Canvas Interface: A drag-and-drop graph editor.
- Color Coding: Nodes flash different colors as the GC “Frontier” (Grey) moves through the graph.
- Violation Alert: If you successfully move a White node to a Black parent while the GC isn’t looking, the screen flashes Red with an “OBJECT LEAK DETECTED” warning.
- Barrier Toggle: A switch to enable/disable the “Incremental Update” barrier.
Interaction Flow:
- The Setup: Create Node A (Root), B, and C. A points to B. B points to C.
- The Run: Start the GC. A turns Black. B turns Grey. C is White.
- The Sabotage: The user (Mutator) moves the pointer: A now points to C, and B points to NULL.
- The Result: The GC finishes B (now points to nothing). Since A is already Black, it’s not scanned again.
- The Bug: C stays White and the visualizer flashes “ERROR: LIVE OBJECT COLLECTED!”
- The Fix: Enable “Write Barrier” mode. Watch C turn Grey automatically when the pointer is moved.
The Core Question You’re Answering
“How do we mark objects while they are still being moved around by the application?”
This is the central challenge of Concurrent Marking. If the world doesn’t stop, the graph you are scanning is constantly changing. You are essentially painting a moving car. This project teaches you the Tri-Color Invariants that keep the car from crashing.
Concepts You Must Understand First
- Tri-Color Marking States
- White: Unvisited.
- Grey: Frontier (visited, but children are not).
- Black: Safe (visited and children are visited).
- Book Reference: “The Garbage Collection Handbook” Ch. 13.1
- The Lost Object Problem
- Under what conditions can a live object be missed? (Pointer from Black to White + No path from Grey to White).
- Book Reference: “The Garbage Collection Handbook” Ch. 13.2
- Write Barrier Strategies
- Incremental Update (G1): If you store a pointer, turn the destination Grey.
- SATB (Snapshot-At-The-Beginning): If you overwrite a pointer, turn the old value Grey.
- Book Reference: “The Garbage Collection Handbook” Ch. 13.3
Questions to Guide Your Design
- The State Machine
- How will you manage the transition of nodes between colors?
- Mutator Interference
- How will you allow the user to modify the graph while the “GC process” is stepping through?
- Invariant Checking
- Can you write a function that detects a violation of the “No Black-to-White pointers” rule in real-time?
Thinking Exercise
The Stealth Move
Draw this graph: A (Black) -> B (Grey) -> C (White).
- If you move the link from
B -> CtoA -> C, and then deleteB -> C. - At this exact moment, is C reachable from the roots? (Yes, through A).
- Does the GC know about the path through A? (No, A is already finished).
- What must the “Write Barrier” do to save C?
The Interview Questions They’ll Ask
- “What are the three colors in Tri-Color marking, and what does each represent?”
- “Explain the ‘White-to-Black’ violation.”
- “What is the difference between an ‘Incremental Update’ barrier and a ‘Snapshot-at-the-Beginning’ barrier?”
- “Why is concurrent marking harder than Stop-the-World marking?”
Hints in Layers
Hint 1: Graph Representation
Use a simple adjacency list or an array of objects: { id: 1, color: 'white', refs: [2, 3] }.
Hint 2: The Step-by-Step Loop Implement the GC as a loop that:
- Picks a ‘Grey’ node.
- Turns all its ‘White’ children to ‘Grey’.
- Turns the node itself to ‘Black’.
Hint 3: Simulating the Mutator Add a button “Break Link and Reconnect.” When clicked, it should perform the “Stealth Move” described in the thinking exercise.
Hint 4: Visualizing the Barrier
When the barrier is ON, any operation that changes node.refs should immediately check if it’s creating a Black-to-White link and change the destination node to Grey.
Books That Will Help
| Topic | Book | Chapter |
|---|---|---|
| Tri-Color Marking Logic | “The Garbage Collection Handbook” | Ch. 13.1 |
| Barrier Mechanics | “The Garbage Collection Handbook” | Ch. 13.3 |
| G1 SATB Logic | “Java Performance” | Ch. 6 |
Project 5: The Barrier Benchmarker (JIT & Assembly)
- Main Programming Language: C++ / Inline Assembly
- Alternative Programming Languages: Zig, Rust
- Difficulty: Level 4: Expert
- Knowledge Area: Systems Performance
- Main Book: “The Garbage Collection Handbook” Ch. 15
What you’ll build: A performance suite that measures the nanosecond overhead of different GC barriers. You’ll use inline assembly to simulate exactly what a JIT compiler (like HotSpot) does.
Real World Outcome
You will produce a benchmark report that quantifies the “GC Tax.” You’ll see exactly how many CPU cycles are wasted on memory safety, which explains why C++ can sometimes be faster than Java/Go even if the GC is “perfect.”
Example Benchmark Output:
$ ./barrier_bench --iterations=100000000

Testing: Pointer Assignment (obj.field = val)
--------------------------------------------------
1. RAW (No GC):       0.42 ns/op
2. G1 Barrier (Write): 0.85 ns/op  (+102% overhead)
3. ZGC Barrier (Load):  1.12 ns/op  (+166% overhead)

[ANALYSIS]
- The G1 Write Barrier adds ~3 x86 instructions (CMP, JNE, STR).
- The ZGC Load Barrier adds ~5 x86 instructions including a bitwise AND.
- Conclusion: High-frequency trading apps should avoid pointer-heavy structures in managed languages.
The Core Question You’re Answering
“What is the true price of low-latency memory management?”
You pay for sub-millisecond pauses by making every pointer operation in your program slightly slower. This project quantifies that price at the assembly level. You’ll learn why ZGC uses a “fast path” and a “slow path.”
Concepts You Must Understand First
- CPU Pipelines & Branch Prediction
- Why is a conditional branch (
if (gc_is_active)) nearly free if it’s usually false?
- Why is a conditional branch (
- Inline Assembly
- How do you write
asmblocks in C++/Rust to ensure the compiler doesn’t optimize away your barrier?
- How do you write
- Load vs. Write Barriers
- Why are Load Barriers (ZGC) typically more expensive than Write Barriers (G1)? (Hint: Apps usually read pointers 10x more than they write them).
Questions to Guide Your Design
- The Benchmark Loop
- How do you ensure you are measuring the barrier and not just the overhead of the loop itself?
- Simulating the GC State
- How will you toggle the “GC is active” flag so you can measure both the “Fast Path” (GC idle) and “Slow Path” (GC marking/relocating)?
- Instruction Counting
- Can you use a tool like
objdumpto verify exactly what instructions your barrier is adding?
- Can you use a tool like
Thinking Exercise
The Hidden Tax
Consider this simple loop:
for (int i = 0; i < 1000000; i++) {
    node = node->next; // READ pointer
    node->value = i;   // WRITE value
}
If you are using ZGC, there is a Load Barrier on node->next.
If you are using G1, there is a Write Barrier on node->value (if value was a pointer).
- Which one is executed in every iteration?
- If the barrier takes 2 nanoseconds, how much longer does the loop take in total?
The Interview Questions They’ll Ask
- “What is a ‘Fast Path’ in a GC barrier?”
- “How does the CPU’s branch predictor help minimize GC overhead?”
- “Why did ZGC choose a Load Barrier instead of a Write Barrier?”
- “What is the performance impact of ‘Dirtying a Card’ in G1?”
Hints in Layers
Hint 1: Simple Barrier Implementation A G1 Write Barrier looks something like:
void write_barrier(void** slot, void* new_val) {
    *slot = new_val;
    if (global_gc_phase == MARKING) {
        record_dirty_card(slot);
    }
}
Hint 2: Using __builtin_expect
Use __builtin_expect (in GCC/Clang) to tell the compiler that the GC is usually NOT active. This helps the branch predictor.
Hint 3: High-Resolution Timers
Use std::chrono::high_resolution_clock or the RDTSC instruction (x86) for nanosecond precision.
Hint 4: Assembly Verification
Compile with -S and look at the assembly. Ensure your barrier hasn’t been “hoisted” out of the loop by the optimizer.
Books That Will Help
| Topic | Book | Chapter |
|---|---|---|
| Barrier Implementation | “The Garbage Collection Handbook” | Ch. 11.4 |
| Performance of Barriers | “The Garbage Collection Handbook” | Ch. 15 |
| Assembly & CPU Pipelines | “Computer Systems: A Programmer’s Perspective” | Ch. 3 & 5 |
| JIT Compiler Optimization | “Java Performance” | Ch. 4 |
Project 6: G1 Region Simulator (Garbage-First Logic)
- Main Programming Language: Java
- Alternative Programming Languages: Python, Go
- Difficulty: Level 3: Advanced
- Knowledge Area: Heuristics & Scheduling
- Main Book: “The Garbage Collection Handbook” Ch. 16
What you’ll build: A simulation of G1’s region-based heap. Instead of one giant heap, you have 100 small “Regions.” You’ll implement the logic that selects which regions to collect based on their Garbage Density and the user’s Pause Time Goal.
Real World Outcome
You will understand why G1 is called “Garbage First.” You will build a simulator that demonstrates the “mixed collection” strategy. You’ll see how the algorithm balances reclaiming space with meeting a strict pause-time target by dynamically choosing which “Regions” to clean.
Simulator Output:
$ java G1Simulator --pause-goal=10ms --heap-size=1GB

[STATS] Heap Usage: 75%
[ANALYSIS] Calculating 'Garbage Density' per Region...
- Region #12: 95% Garbage (Score: 0.95)
- Region #45: 88% Garbage (Score: 0.88)
- Region #08: 12% Garbage (Score: 0.12)
- Region #99: 100% Garbage (Score: 1.00)

[PLANNING] Build Collection Set (CSet):
1. Adding 3 Young Regions (Mandatory). Est Pause: 4.5ms
2. Adding Region #99. Est Pause: 1.2ms (Cumulative: 5.7ms)
3. Adding Region #12. Est Pause: 1.8ms (Cumulative: 7.5ms)
4. Adding Region #45. Est Pause: 2.1ms (Cumulative: 9.6ms)
5. Pause Goal (10ms) reached. Stopping CSet construction.

[GC] PHASE: EVACUATION
[GC] Done. Pause Time: 9.82ms. Reclaimed 142MB.
# Result: You just successfully traded completeness for latency!
The Core Question You’re Answering
“How do we collect enough memory to stay alive without stopping the world for too long?”
GC is an optimization problem. G1’s breakthrough was realizing that you don’t have to collect the whole Old Generation at once. You can pick and choose the regions that are mostly garbage and leave the others for later. This project teaches you the Garbage-First Heuristic.
Concepts You Must Understand First
- Region-based Heap Layout
- What are Young, Old, and Humongous regions?
- Book Reference: “The Garbage Collection Handbook” Ch. 16.1
- The CSet (Collection Set)
- How does G1 build the list of regions to be collected in the next cycle?
- Book Reference: “The Garbage Collection Handbook” Ch. 16.3
- Pause Time Prediction
- How does G1 use historical data to guess how long it will take to evacuate a region?
- Book Reference: “Java Performance” Ch. 6
Questions to Guide Your Design
- Measuring Density
- How will you track how much “Live Data” is in each region without doing a full GC? (Hint: Remembered Sets).
- Scheduling
- If your pause goal is 5ms, and scanning the Young regions takes 4ms, how many Old regions can you afford to add to the CSet?
- Mixed Collections
- When should G1 start collecting Old regions? (The
InitiatingHeapOccupancyPercentlogic).
- When should G1 start collecting Old regions? (The
Thinking Exercise
The High-Value Target
Imagine you have two regions:
- Region A: 1MB of data, 90% is garbage. (100KB live).
- Region B: 1MB of data, 10% is garbage. (900KB live). If the cost of collecting 100KB is 1ms:
- How long does Region A take to collect?
- How long does Region B take to collect?
- Which one gives you more free space for the same “pause time cost”?
The Interview Questions They’ll Ask
- “Why is G1 called ‘Garbage-First’?”
- “What is a ‘Mixed Collection’ in G1?”
- “How does G1 handle objects that are larger than a single region? (Humongous Objects).”
- “What happens if G1 cannot reclaim memory fast enough to meet allocation demand? (Full GC).”
Hints in Layers
Hint 1: The Region Object
Define a class Region that tracks totalSize, liveDataSize, and type (EDEN, SURVIVOR, OLD).
Hint 2: The Simulator Loop Every “tick” of your simulator, allocate some objects into EDEN regions. When all EDEN regions are full, trigger a “Young GC.”
Hint 3: Calculating Value
The “Value” of a region is (totalSize - liveDataSize) / estimatedCollectionTime. Sort your regions by this value and pick from the top.
Hint 4: Historical Averages Keep an array of the last 5 collection times. Use the average to predict the next one. This is exactly how the real G1 works.
Books That Will Help
| Topic | Book | Chapter |
|---|---|---|
| G1 Architecture | “The Garbage Collection Handbook” | Ch. 16 |
| G1 Tuning & Heuristics | “Java Performance” | Ch. 6 |
| Pause Time Goals | “The Garbage Collection Handbook” | Ch. 16.2 |
Project 7: Colored Pointer Sandbox (ZGC Style)
- Main Programming Language: C
- Alternative Programming Languages: C++
- Difficulty: Level 5: Master
- Knowledge Area: Virtual Memory & Bit Manipulation
- Main Book: OpenJDK ZGC Wiki (Main - ZGC)
What you’ll build: A memory manager that uses Colored Pointers. You will use the upper bits of a 64-bit address (Marked0, Marked1, Remapped) to store object state. You’ll implement a load_barrier() that checks these bits and “heals” the pointer if it’s in the wrong state.
Real World Outcome
You will implement the “Secret Sauce” of ZGC. You’ll have a system where you can mark 1 million objects as “stale” simply by changing a single global variable, and the application will “self-heal” those pointers one-by-one as it accesses them. You will use mmap to create the “Multi-Mapping” trick required for colored pointers to work.
Execution Trace:
$ ./zgc_sandbox

[INIT] Heap mapped at 3 virtual locations:
- Marked0: 0x000100000000
- Marked1: 0x000200000000
- Remap:   0x000400000000

[GC] Transitioning to MARKED0 phase.
[APP] Reading pointer P1 (Value: 0x0001000000005000)
[BARRIER] Pointer color matches global mask. Fast path (0.2ns).

[GC] Transitioning to REMAPPED phase (Compaction started).
[APP] Reading pointer P1 (Value: 0x0001000000005000)
[BARRIER] STALE DETECTED! (Expected REMAPPED bit).
[BARRIER] Entering SLOW PATH...
[BARRIER] Relocation check for 0x5000: Object moved to 0x9000.
[BARRIER] HEALING pointer...
[APP] P1 updated to 0x0004000000009000. Read successful.
# Result: The app never pauses for compaction; it fixes its own memory as it goes!
The Core Question You’re Answering
“Can we know an object’s state without ever looking at the object?”
In traditional GCs, to see if an object is “Marked,” you have to load the object’s header from RAM into the CPU cache. If you have millions of objects, this causes massive cache misses. ZGC stores the state in the Pointer. This project teaches you how to use the “Metadata Bits” of a 64-bit address.
Concepts You Must Understand First
- Virtual Address Space
- On a 64-bit system, we only use ~48 bits for actual addresses. What can we do with the other 16 bits?
- Multi-Mapping (The trick)
- How can we make
0x0001....5000and0x0004....5000point to the same physical memory? (Usingmmapto map the same file multiple times). - Book Reference: “The Linux Programming Interface” Ch. 49 (Memory Mapping)
- How can we make
- Load Barriers
- Why must the barrier check the pointer before the application uses it?
Questions to Guide Your Design
- The Bitmask
- Which bits will you use for
Marked0,Marked1, andRemapped?
- Which bits will you use for
- The Global Color
- How will the
load_barrierfunction know which bit is the “correct” one for the current GC phase?
- How will the
- The Slow Path
- What does the barrier do when it detects a “Bad Color”? (It must check if the object has been moved and find the new address).
Thinking Exercise
The Magic Mirror
Imagine you have a physical book. You put three different mirrors in front of it.
- Mirror 1 shows the book in Red.
- Mirror 2 shows the book in Blue.
- Mirror 3 shows the book in Green. No matter which mirror you look through, you see the same book. In ZGC:
- Address
0x0001...is the “Marked0” mirror. - Address
0x0002...is the “Marked1” mirror. - Address
0x0004...is the “Remapped” mirror. Why does this make bit-toggling fast?
The Interview Questions They’ll Ask
- “What are Colored Pointers, and what problem do they solve?”
- “Explain ‘Multi-mapping’ in ZGC. Why is it necessary?”
- “Why does ZGC only work on 64-bit architectures?”
- “What is the ‘Self-Healing’ property of ZGC pointers?”
Hints in Layers
Hint 1: The Address Layout
Use bits 42, 43, and 44 for your colors.
#define ZGC_METADATA_MASK 0x0007000000000000
Hint 2: mmap Multi-mapping
On Linux, you can use memfd_create to create a file in RAM, then mmap it three times into different virtual address ranges.
Hint 3: The Barrier Macro
#define LOAD_BARRIER(ptr) \
    (((ptr) & global_good_mask) ? (ptr) : slow_path_heal(ptr))
Hint 4: The Relocation Table
When you “move” an object in your sandbox, store the mapping in a hash map: old_addr -> new_addr. The slow_path_heal function uses this to update the stale pointer.
Books That Will Help
| Topic | Book | Chapter |
|---|---|---|
| ZGC Principles | OpenJDK Wiki | “Main - ZGC” |
| Memory Mapping (mmap) | “The Linux Programming Interface” | Ch. 49 |
| Bit Manipulation | “Hacker’s Delight” | Ch. 2 |
| Load Barriers | “The Garbage Collection Handbook” | Ch. 11.4 |
Project 8: The Forwarding Table (Shenandoah-style)
- Main Programming Language: C
- Alternative Programming Languages: Rust
- Difficulty: Level 4: Expert
- Knowledge Area: Concurrency & Atomic Operations
- Main Book: “The Garbage Collection Handbook” Ch. 17
What you’ll build: A simulator for Shenandoah’s Concurrent Evacuation. When an object is moved, instead of updating all pointers immediately, you store the new address in a “Forwarding Pointer” (Brooks Pointer) located right before the object’s header.
Real World Outcome
You will implement a system that can move objects while multiple application threads are reading and writing to them. You will see how Brooks Pointers and Atomic CAS operations ensure that every thread always sees the most up-to-date version of an object, even in the middle of a relocation.
Thread Simulation Log:
$ ./shenandoah_sim --threads=4

[GC] START Relocation: ObjA (0x1000) -> Target (0x2000)
[MUTATOR-T1] READ ObjA (0x1000)...
[BARRIER] Indirection: 0x1000.brooks_ptr -> 0x1000. Self-access.
[GC] COPYING DATA: [0x1000...0x1040] -> [0x2000...0x2040]
[MUTATOR-T2] WRITE ObjA (0x1000).val = 42...
[BARRIER] Indirection: 0x1000.brooks_ptr -> 0x1000. Writing to Old Copy.
[GC] ATOMIC SWAP: 0x1000.brooks_ptr = 0x2000. (SUCCESS)
[MUTATOR-T3] READ ObjA (0x1000)...
[BARRIER] Indirection: 0x1000.brooks_ptr -> 0x2000. Redirecting to New Copy.
[MUTATOR-T4] WRITE ObjA (0x1000).val = 99...
[BARRIER] Indirection: 0x1000.brooks_ptr -> 0x2000. Redirecting to New Copy.
# Result: Consistency maintained across all threads during physical data movement.
The Core Question You’re Answering
“How do we handle the split-second when an object exists in two places at once?”
During concurrent evacuation, an object is copied from the “From” space to the “To” space. For a brief moment, both copies exist. If Thread A writes to the old copy and Thread B reads from the new copy, your data is corrupted. This project teaches you how Atomic Compare-And-Swap (CAS) operations and Brooks Pointers ensure consistency.
Concepts You Must Understand First
- Brooks Pointers
- Why put the forwarding address inside the object (or just before it) instead of in a separate table?
- Book Reference: “The Garbage Collection Handbook” Ch. 17.6
- Atomic CAS (Compare-And-Swap)
- How do you move an object and update its forwarding pointer in a way that no other thread can “sneak in” a write to the old version?
- Book Reference: “Computer Systems: A Programmer’s Perspective” Ch. 12.7
- Read and Write Barriers in Shenandoah
- Why does Shenandoah need a barrier for every access, not just marking?
Questions to Guide Your Design
- The Object Layout
- How will you structure your memory so that every object has a 64-bit “Forwarding Pointer” prefixed to it?
- The “To-Space” Invariant
- How do you guarantee that once an object is moved, all future writes go to the new copy?
- Race Conditions
- What happens if two GC threads try to evacuate the same object at the same time?
Thinking Exercise
The Double-Write Trap
- GC thread starts copying
Obj AtoNew A. - Mutator thread writes
x = 10toObj A. - GC thread finishes copying and sets the Brooks Pointer.
- What happened to the value
x = 10? Was it copied? (No, the write happened after the copy started).- How does the “Write Barrier” prevent this data loss?
The Interview Questions They’ll Ask
- “What is a Brooks Pointer, and how does it differ from a standard forwarding pointer?”
- “Explain the ‘Load Reference Barrier’ in Shenandoah.”
- “How does Shenandoah use CAS to win the race against Mutator threads?”
- “Compare ZGC’s Colored Pointers to Shenandoah’s Forwarding Pointers. Which one has more memory overhead?”
Hints in Layers
Hint 1: The Indirection Header
Every object should look like this in memory:
[ Forwarding Pointer (8 bytes) ][ Header ][ Object Data ]
By default, the Forwarding Pointer points to itself.
Hint 2: The Read Barrier
Any time you access an object obj, you should actually access obj->forwarding_pointer.
Hint 3: The Atomic Evacuation When moving:
- Copy the object to the new space.
- Use
atomic_compare_exchangeto update the old copy’s forwarding pointer fromselftonew_address. - If it fails, another thread already moved it! Abandon your copy and use the other one.
Hint 4: Thread Simulation
Use pthreads (C) or std::thread (C++) to simulate concurrent access. Use a sleep or yield to increase the chance of race conditions.
Books That Will Help
| Topic | Book | Chapter |
|---|---|---|
| Shenandoah & Concurrent Compaction | “The Garbage Collection Handbook” | Ch. 17.6 |
| Atomic Operations | “Computer Systems: A Programmer’s Perspective” | Ch. 12 |
| Lock-free Algorithms | “The Art of Multiprocessor Programming” | Ch. 3 |
Project 9: The “Mutator” Stress Test (Race Conditions)
- Main Programming Language: Go
- Alternative Programming Languages: Java, C++
- Difficulty: Level 3: Advanced
- Knowledge Area: Concurrency Testing
- Main Book: “The Garbage Collection Handbook” Ch. 13
What you’ll build: A program that creates a massive, complex object graph (e.g., a multi-dimensional linked list) and then spawns multiple threads that do nothing but randomly swap references. You’ll run your custom GCs against this “Mutator” and identify data corruption bugs.
Real World Outcome
You will develop a “Chaos Monkey” for memory managers. It will prove whether your GC is actually “Thread Safe” or if it contains subtle race conditions that only appear under high load. You will learn how to build “Shadow Maps” to verify heap integrity after a concurrent run.
Stress Test Output:
$ ./mutator_stress --threads=16 --gc=my_concurrent_gc

[MUTATOR] Spawning 16 threads...
[MUTATOR] Performing 1,000,000 reference swaps per second.
[GC] Triggering concurrent marking cycle...
[GC] Triggering concurrent relocation cycle...
[VALIDATOR] Scanning heap for dangling pointers...
[VALIDATOR] ERROR: Found dangling pointer at 0x8804.
[VALIDATOR] Pointer at 0x8804 expected ObjX, but found 0xDEADBEEF (Garbage).
[SUMMARY] GC Bug Found! Race condition between Barrier and Relocator.
# You've just found a bug that would have taken 6 months to find in production.
The Core Question You’re Answering
“How do we prove that a concurrent algorithm is correct?”
Concurrency is famously difficult to reason about. A “Mutator Stress Test” is the industry standard for verifying that a GC’s barriers and invariants actually work in the “real world” of multi-core processors.
Concepts You Must Understand First
- Race Conditions
- What happens when a GC scan and a Mutator write happen at the exact same nanosecond?
- Graph Validation
- How can you verify that every object that should be live is still in the heap? (Usually by keeping a “Shadow Map” or doing a slow STW scan for comparison).
- Thread Synchronization
- Using Mutexes vs. Lock-free code in the Mutator.
Questions to Guide Your Design
- The Graph Structure
- How can you build a graph that is complex enough to trigger bugs but simple enough to validate?
- Workload Simulation
- Should the Mutators swap pointers quickly (test barriers) or allocate/deallocate quickly (test fragmentation)?
- Bug Localization
- When a bug is found, how can you “replay” the sequence of events to find the cause?
Thinking Exercise
The Vanishing Node
Imagine a thread is moving Node X from Parent A to Parent B.
- GC marks Parent A (Black).
- GC hasn’t reached Parent B yet (White).
- Thread moves X to Parent B.
- Thread removes X from Parent A.
- Is there any point where X is not pointed to by either A or B? (No).
- Will the GC find X? (Not unless there’s a barrier!).
The Interview Questions They’ll Ask
- “What is a ‘Mutator’ in GC terminology?”
- “How do you test for race conditions in a non-deterministic system?”
- “What is the ‘Lost Object’ problem, and how can a stress test find it?”
- “Why is it important to test GC with multiple threads even if the GC itself is single-threaded?”
Project 10: SATB (Snapshot-At-The-Beginning)
- Main Programming Language: Java
- Alternative Programming Languages: C#, C++
- Difficulty: Level 4: Expert
- Knowledge Area: Consistency Models
- Main Book: “The Garbage Collection Handbook” Ch. 16
What you’ll build: Implement a marking algorithm that uses SATB. When marking starts, you “logically” snapshot the entire object graph. Any references deleted after that point are still considered live for this cycle.
Real World Outcome
You will implement the marking logic used by G1 and Shenandoah. You’ll see how SATB simplifies concurrent marking by treating any object that was live at the start of the cycle as “untouchable” until the cycle ends. You will observe how “Floating Garbage” is created as a trade-off for algorithm simplicity and correctness.
Execution Trace:
$ ./satb_demo

[GC] Cycle 12 START. Snapshot taken.
[MUTATOR] Operation: objA.field = NULL (Old value was ObjB).
[BARRIER] SATB PRE-WRITE BARRIER: Catching 'ObjB'.
[BARRIER] ObjB added to Marking Stack.
[GC] PHASE: CONCURRENT MARKING
[GC] Scanning Marking Stack... Found ObjB. Marking LIVE.
[GC] Cycle FINISHED.
[INFO] ObjB is marked LIVE even though nothing points to it.
# You've just seen 'Floating Garbage'—memory that will be reclaimed in the NEXT cycle.
The Core Question You’re Answering
“How do we create a consistent view of a world that is constantly changing?”
SATB is like taking a photo of a crowd. Even if people move after the photo is taken, the photo remains the same. This project teaches you the trade-off between GC Precision (reclaiming memory immediately) and GC Complexity (making the marking process easier to reason about).
Concepts You Must Understand First
- SATB Invariant
- If an object was reachable at the start of GC, it stays reachable until the end of GC.
- Book Reference: “The Garbage Collection Handbook” Ch. 13.3
- The “Deletion” Barrier
- Why do we only care when a pointer is overwritten or deleted?
- Floating Garbage
- Why does SATB result in some dead objects being kept alive longer than necessary?
Questions to Guide Your Design
- The Write Barrier
- How will you intercept the “Old Value” of a pointer before it is replaced?
- The Marking Stack
- How do you store the objects caught by the SATB barrier so the GC can scan them later?
- Cycle Initialization
- How do you “mark” the start of a cycle so the barriers know when to activate?
Thinking Exercise
The Ghost in the Machine
If you have a pointer A -> B.
- GC starts.
- Thread changes it to
A -> C. - In SATB,
Bis “caught” by the barrier and marked live. - Is
Bactually dead? (Yes, nothing points to it). - Why is it better to keep
Balive (Floating Garbage) than to risk accidentally deleting a live object?
The Interview Questions They’ll Ask
- “What does SATB stand for?”
- “What is ‘Floating Garbage’ and why is it an acceptable trade-off?”
- “How does a SATB write barrier differ from an Incremental Update barrier?”
- “Why does G1 use SATB during its concurrent marking phase?”
Books That Will Help
| Topic | Book | Chapter |
|---|---|---|
| SATB Theory | “The Garbage Collection Handbook” | Ch. 13.3 |
| G1 SATB Implementation | “Java Performance” | Ch. 6 |
| Snapshot consistency | “Principles of Concurrent Programming” | Ch. 4 |
Project 11: Epsilon GC (The “No-Op” Reference)
- Main Programming Language: Java / JVM Flags
- Alternative Programming Languages: Any GC-based language (e.g., Go with
GOGC=off) - Difficulty: Level 1: Beginner
- Knowledge Area: Benchmarking & Performance Baselines
- Main Book: OpenJDK JEP 318
What you’ll build: A suite of performance tests using the Epsilon GC (the GC that handles allocation but never reclaims memory). You’ll use this to find the “Baseline Performance” of your application and calculate the exact “GC Tax” paid by G1 or ZGC.
Real World Outcome
You will determine if your application’s performance problems are caused by the GC or by your own code. You’ll also learn to calculate the “Memory Leak Rate” of a system by watching how fast an Epsilon-backed JVM crashes with an OutOfMemoryError (OOM).
Benchmark Output:
$ java -XX:+UnlockExperimentalVMOptions -XX:+UseEpsilonGC -Xmx128m -jar my-app.jar

[ALLOC] Total bytes allocated: 0 MB
[ALLOC] Total bytes allocated: 50 MB
[ALLOC] Total bytes allocated: 100 MB
[ERROR] java.lang.OutOfMemoryError: Java heap space
[ANALYSIS]
- Time to crash: 42 seconds.
- Total throughput: 15,000 req/sec.
- Comparison: G1 GC gives 12,000 req/sec.
- Result: You are paying a 20% "GC Tax" for memory safety.
The Core Question You’re Answering
“What would my app look like if memory were infinite?”
Epsilon GC is the control group in your experiments. It answers: “How fast can my code run if it never has to wait for a GC barrier or a pause?” It’s also a powerful tool for short-lived tasks (like a CLI tool that runs for 1 second) where you don’t care about collecting memory.
Concepts You Must Understand First
- GC Overhead vs. Application Latency
- How much CPU time is spent on your business logic vs. managing memory?
- Short-lived Runtimes
- Why would you ever want a GC that doesn’t collect? (Hint: Serverless/Lambda functions).
- Allocation Baselines
- How many gigabytes of memory does your app allocate per minute?
The Interview Questions They’ll Ask
- “What is Epsilon GC and what is its purpose?”
- “Why is Epsilon useful for performance benchmarking?”
- “Can you use Epsilon in production? If so, when?”
- “How does Epsilon help you identify memory leaks?”
Hints in Layers
Hint 1: Setup
Use -XX:+UnlockExperimentalVMOptions -XX:+UseEpsilonGC on any OpenJDK 11+ JVM.
Hint 2: The Benchmark Run a CPU-intensive task with G1, then with ZGC, then with Epsilon. Compare the throughput (ops/sec).
Hint 3: Calculating the Tax
GC Tax = (Epsilon Throughput - G1 Throughput) / Epsilon Throughput.
Project 12: The “Oracle” GC Log Parser
- Main Programming Language: Python
- Alternative Programming Languages: Go, Rust
- Difficulty: Level 2: Intermediate
- Knowledge Area: Log Analysis & Observability
- Main Book: “Java Performance” by Charlie Hunt (Ch. 6: Garbage Collection)
What you’ll build: A tool that parses raw -Xlog:gc* output and produces a visual report showing the “Pause Timeline,” “Allocation Rate,” and “Promotion Rate.”
Real World Outcome
You will be able to debug production performance issues by reading the “heartbeat” of the JVM. You’ll identify why a system is slowing down (e.g., “Premature Promotion”) and which GC flags need tuning. You’ll build a CLI tool that turns cryptic logs into actionable architectural advice.
Tool Output:
$ python gc_oracle.py --file=gc.log

--------------------------------------------------
JVM GC ANALYSIS REPORT
--------------------------------------------------
Total Runtime: 2h 14m
Max Pause: 145ms (G1 Evacuation Pause)
Avg Pause: 12ms

DIAGNOSTIC ALERTS:
[WARNING] High Promotion Rate (15MB/s).
          => Survivor space is too small. Objects are moving to OldGen too early.
          => Suggestion: Increase SurvivorRatio or increase YoungGen size.

[CRITICAL] System.gc() called 4 times.
           => Manual GC calls are killing your performance.
           => Suggestion: Run with -XX:+DisableExplicitGC.

[INFO] Allocation Rate: 250MB/s.
       => This is a very "chatty" application. Check for object pooling opportunities.
--------------------------------------------------
The Core Question You’re Answering
“What is actually happening inside the black box?”
Modern GCs produce incredibly detailed logs, but they are hard for humans to read. This project teaches you the lifecycle of a GC cycle (Marking, Evacuation, Cleanup) and how to identify the “Critical Failures” (Full GC, Humongous Allocation).
Concepts You Must Understand First
- GC Log Formats
- What is Unified Logging (
-Xlog:gc)?
- What is Unified Logging (
- Phases of Collection
- What is the difference between a “Concurrent Mark” phase (doesn’t stop the app) and a “Pause Young” phase (stops the app)?
- Survivor Spaces & Aging
- How can you tell from the logs if objects are being promoted to the Old Gen too quickly?
Questions to Guide Your Design
- The Regex Challenge
- How will you parse timestamps and memory sizes (e.g.,
1024K -> 512K(2048K))?
- How will you parse timestamps and memory sizes (e.g.,
- Timeline Visualization
- How can you plot pauses on a timeline to see if they correlate with application latency?
- Automatic Diagnostics
- Can you write rules that detect common problems like “Allocation Failure” or “Metadata GC Threshold”?
The Interview Questions They’ll Ask
- “How do you identify a memory leak from a GC log?”
- “What is the difference between a ‘Pause Young (Normal)’ and a ‘Pause Young (Prepare for Mixed)’ in G1 logs?”
- “How can you tell if the heap is too small by looking at GC logs?”
- “What is a ‘Full GC’ and why is it bad in G1/ZGC?”
Hints in Layers
Hint 1: Sample Logs
Generate logs by running a simple Java program with -Xlog:gc:file=gc.log.
Hint 2: Parsing Memory
Use a regular expression to capture the before/after/total heap sizes: (\d+)[KMG]->(\d+)[KMG]\((\d+)[KMG]\).
Hint 3: Calculating Allocation Rate The difference between the “End” of one GC and the “Start” of the next GC is the amount of memory allocated by the application during that interval.
Books That Will Help
| Topic | Book | Chapter |
|---|---|---|
| GC Logging & Tuning | “Java Performance” | Ch. 6 |
| Unified Logging Format | OpenJDK Documentation | “JEP 158” |
| Troubleshooting GC | “The Well-Grounded Java Developer” | Ch. 5 |
Final Overall Project: The “Eternal Runtime” (Masterpiece)
What you’ll build: A custom Virtual Machine (VM) that combines everything you’ve learned. It will support a Region-based Heap with Concurrent Marking, ZGC-style Colored Pointers, and Concurrent Compaction.
Real World Outcome
This is the ultimate proof of mastery. You will have built a memory manager from scratch that rivals the core logic of modern high-performance runtimes. You will be able to run a simple bytecode language in your VM with sub-millisecond pauses on a heap that you are constantly compacting concurrently.
Final System Output:
$ ./eternal_vm --script=benchmark.evm --heap=4GB

[VM] Initializing Region-based Heap...
[VM] Loading Bytecode...
[VM] --- RUNTIME ACTIVE ---
[GC] Concurrent Mark Phase Started...
[GC] Concurrent Evacuation Started...
[VM] [T1] Executing Op: LOAD_PTR (Address: 0x000400000100)
[BARRIER] Healing stale pointer! New Address: 0x000400000900
[GC] Cycle Completed. Total Pause: 0.45ms.
[VM] benchmark.evm finished in 12.4s.
[STATS] Total Memory Reclaimed: 14.2 GB.
# CONGRATULATIONS: You have mastered Modern Garbage Collection.
The Interview Questions They’ll Ask
- “If you had to design a GC for a 100TB heap today, which architecture would you choose and why?”
- “What is the single most difficult part of implementing a concurrent GC?”
- “How do you balance the trade-off between throughput and latency in a memory manager?”
Books for Final Mastery
| Topic | Book | Chapter |
|---|---|---|
| Complete GC Implementation | “The Garbage Collection Handbook” | Ch. 1-17 (The whole thing) |
| VM Architecture | “Crafting Interpreters” | Ch. 26: Garbage Collection |
| High-Performance Systems | “Systems Performance” (Brendan Gregg) | Ch. 2 & 12 |