Learn Linux System Tools: From Zero to Systems Detective
Goal: Deeply understand the Linux process model, memory architecture, and kernel communication by mastering the essential debugging and monitoring tools that every systems programmer and DevOps engineer relies on daily. You’ll learn to see processes the way the kernel sees them, understand what memory really means, trace system calls to debug mysterious failures, and read the kernel’s own diary to solve hardware and driver issues. These tools transform you from someone who “uses Linux” to someone who truly understands it.
Why These Tools Matter
In 1969, Ken Thompson and Dennis Ritchie created Unix with a radical philosophy: everything is a file, and the kernel is a service provider. Every program you run is a process—a running instance with its own memory space, file descriptors, and state. The kernel manages these processes, allocates memory, handles I/O, and logs everything important.
The tools in this learning path are your windows into this hidden world:
┌─────────────────────────────────────────────────────────────────────────┐
│                         YOUR APPLICATION                                │
│                    (thinks it owns the machine)                         │
└─────────────────────────────────────────────────────────────────────────┘
                                   │
                                   │ System Calls (open, read, write, fork, exec...)
                                   ▼
┌─────────────────────────────────────────────────────────────────────────┐
│                            KERNEL SPACE                                 │
│  ┌──────────────┐ ┌──────────────┐ ┌──────────────┐ ┌──────────────┐   │
│  │   Process    │ │    Memory    │ │  Filesystem  │ │   Network    │   │
│  │  Scheduler   │ │   Manager    │ │    Layer     │ │    Stack     │   │
│  └──────────────┘ └──────────────┘ └──────────────┘ └──────────────┘   │
│                                                                         │
│  ┌──────────────────────────────────────────────────────────────────┐  │
│  │                    Kernel Ring Buffer (dmesg)                     │  │
│  │         Hardware events, driver messages, boot logs               │  │
│  └──────────────────────────────────────────────────────────────────┘  │
└─────────────────────────────────────────────────────────────────────────┘
                                   │
                                   ▼
┌─────────────────────────────────────────────────────────────────────────┐
│                             HARDWARE                                    │
│              CPU cores, RAM, Disk, Network interfaces                   │
└─────────────────────────────────────────────────────────────────────────┘
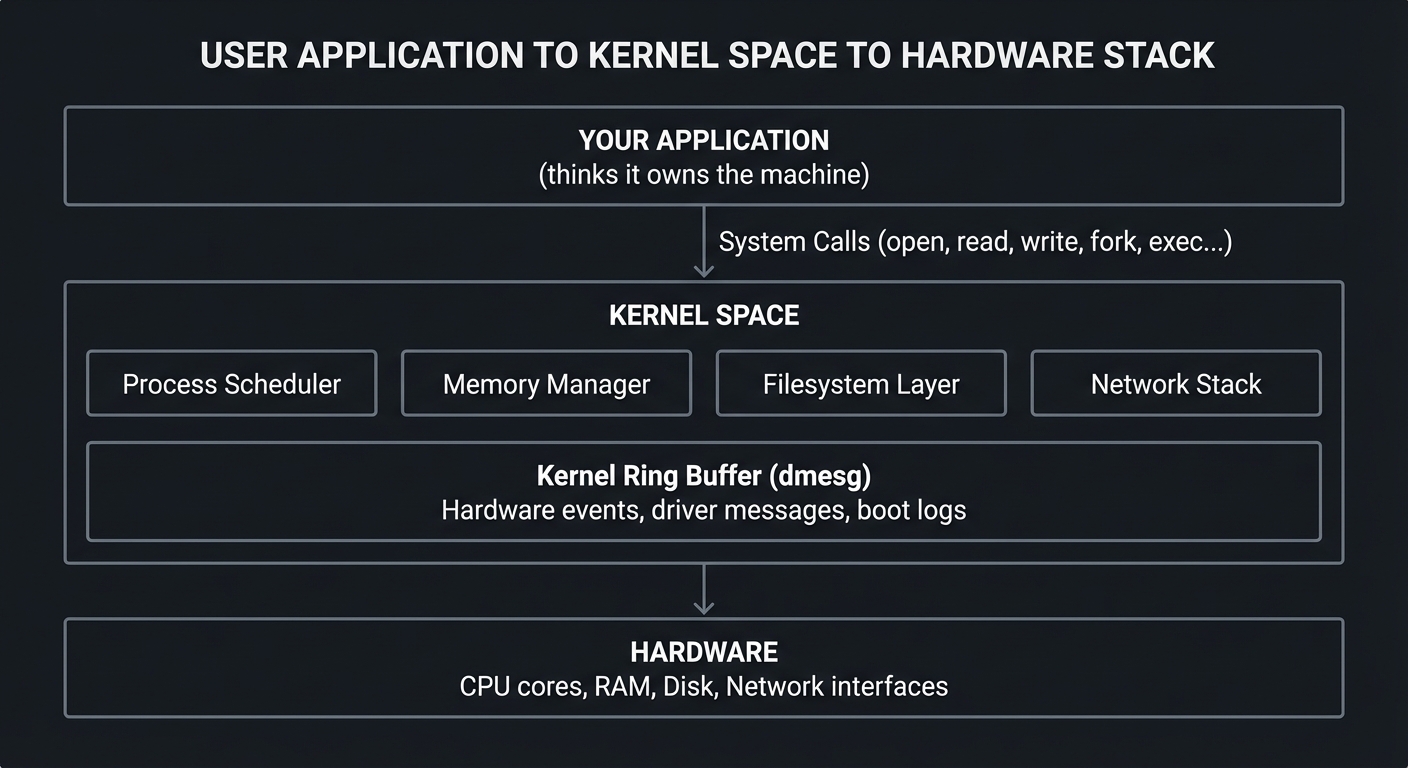
The Tools and What They Reveal
| Tool | What It Shows You | Why You Need It |
|---|---|---|
| strace | Every system call a process makes | Debug “why isn’t this working?” mysteries |
| top | Real-time process and system overview | Identify resource hogs instantly |
| ps | Snapshot of all processes | Script process management |
| free | Memory and swap usage | Understand memory pressure |
| uptime | Load averages and uptime | Quick system health check |
| watch | Repeat any command periodically | Monitor changes over time |
| kill | Send signals to processes | Control process lifecycle |
| killall | Kill processes by name | Manage multiple instances |
| pmap | Process memory map details | Debug memory issues |
| vmstat | Virtual memory statistics | Understand system behavior |
| dmesg | Kernel ring buffer messages | Debug hardware/driver issues |
| journalctl | Systemd journal logs | Comprehensive log analysis |
Real-World Impact
- Netflix uses these tools to debug latency issues in their streaming infrastructure
- Google SREs rely on strace to understand why services fail
- Linux kernel developers use dmesg to debug driver issues
- Every production incident eventually involves one of these tools
When a server is slow, when a process mysteriously dies, when hardware fails—these are the tools that find the answer.
Core Concept Analysis
The Process Model: What IS a Process?
A process is not just “a running program.” It’s a complete execution environment:
┌─────────────────────────────────────────────────────────────────┐
│                    PROCESS (PID: 1234)                          │
├─────────────────────────────────────────────────────────────────┤
│  ┌─────────────────────────────────────────────────────────┐   │
│  │                   VIRTUAL ADDRESS SPACE                  │   │
│  │  ┌─────────────┐                                        │   │
│  │  │    Stack    │ ← Local variables, return addresses    │   │
│  │  │      ↓      │   (grows DOWN)                         │   │
│  │  ├─────────────┤                                        │   │
│  │  │             │                                        │   │
│  │  │   (free)    │ ← Unmapped space                       │   │
│  │  │             │                                        │   │
│  │  ├─────────────┤                                        │   │
│  │  │      ↑      │                                        │   │
│  │  │    Heap     │ ← malloc'd memory (grows UP)           │   │
│  │  ├─────────────┤                                        │   │
│  │  │    BSS     │ ← Uninitialized globals                 │   │
│  │  ├─────────────┤                                        │   │
│  │  │    Data     │ ← Initialized globals                  │   │
│  │  ├─────────────┤                                        │   │
│  │  │    Text     │ ← Executable code (read-only)          │   │
│  │  └─────────────┘                                        │   │
│  └─────────────────────────────────────────────────────────┘   │
│                                                                 │
│  ┌──────────────────┐  ┌──────────────────┐                    │
│  │ File Descriptors │  │  Signal Handlers │                    │
│  │ 0: stdin         │  │ SIGTERM: handler │                    │
│  │ 1: stdout        │  │ SIGINT: handler  │                    │
│  │ 2: stderr        │  │ SIGKILL: (none)  │                    │
│  │ 3: /var/log/app  │  └──────────────────┘                    │
│  └──────────────────┘                                          │
│                                                                 │
│  ┌──────────────────┐  ┌──────────────────┐                    │
│  │  Process State   │  │   Credentials    │                    │
│  │ R: Running       │  │ UID: 1000        │                    │
│  │ S: Sleeping      │  │ GID: 1000        │                    │
│  │ D: Disk sleep    │  │ EUID: 1000       │                    │
│  │ Z: Zombie        │  └──────────────────┘                    │
│  │ T: Stopped       │                                          │
│  └──────────────────┘                                          │
└─────────────────────────────────────────────────────────────────┘
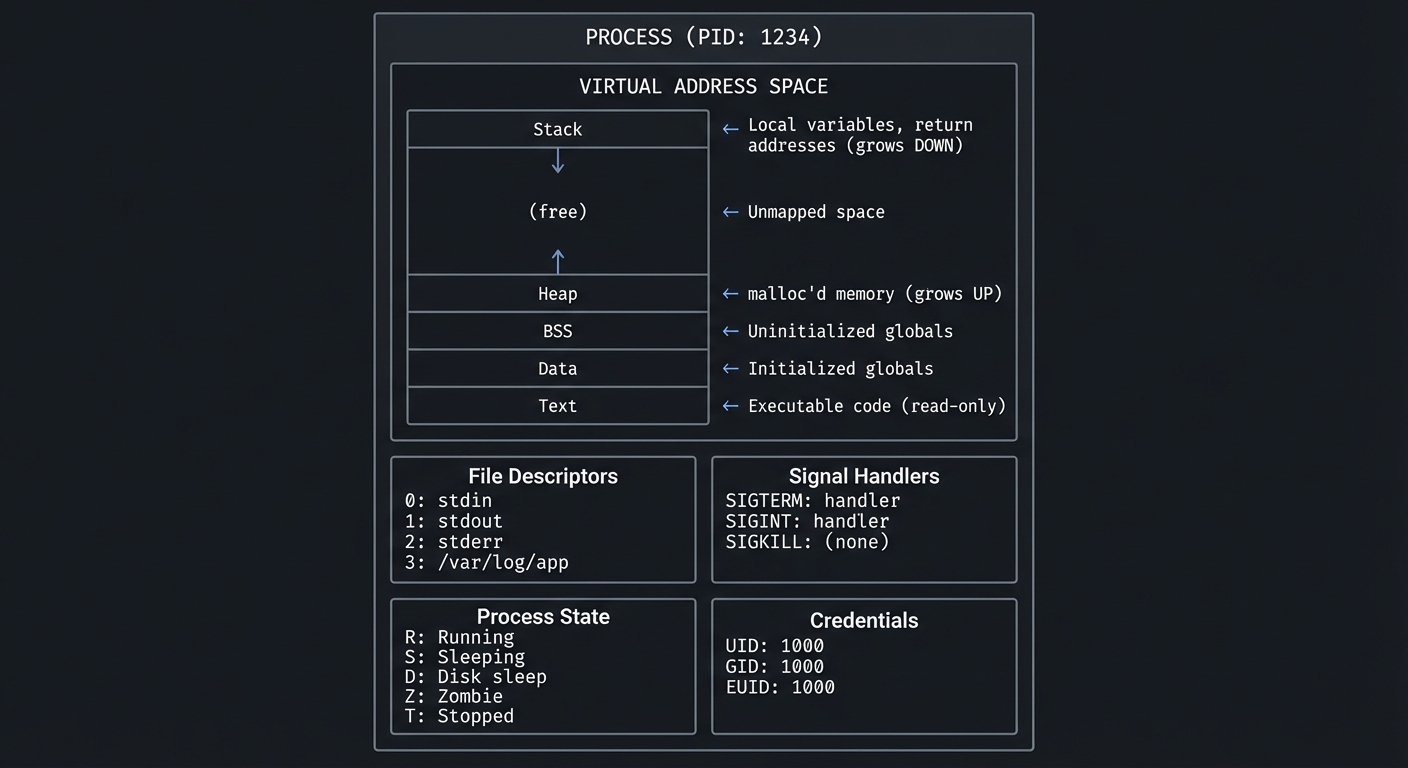
Key insight: The kernel maintains a data structure called task_struct for each process. The tools we’re learning read from /proc/<pid>/ which exposes this structure.
Process States: The Lifecycle
                              ┌─────────────────┐
                              │   fork()/exec() │
                              └────────┬────────┘
                                       │
                                       ▼
┌──────────┐    schedule()     ┌──────────────┐
│ RUNNABLE │◄─────────────────►│   RUNNING    │
│   (R)    │                   │     (R)      │
└────┬─────┘                   └──────┬───────┘
     │                                │
     │ wait for I/O                   │ wait for I/O
     │ or event                       │ or event
     │                                │
     ▼                                ▼
┌──────────────────────────────────────────────┐
│              SLEEPING (S or D)               │
│                                              │
│  S = Interruptible (can receive signals)    │
│  D = Uninterruptible (waiting for disk I/O) │
│                                              │
│  ⚠️  D state cannot be killed!               │
└──────────────────────────────────────────────┘
     │
     │ SIGSTOP / SIGTSTP
     │
     ▼
┌──────────┐                   ┌──────────────┐
│ STOPPED  │                   │    ZOMBIE    │
│   (T)    │                   │     (Z)      │
└──────────┘                   └──────────────┘
     │                                ▲
     │ SIGCONT                        │
     │                                │ exit() but parent
     └────────────────────────────────┤ hasn't called wait()
                                      │
                              ┌───────┴───────┐
                              │ Parent calls  │
                              │    wait()     │
                              └───────┬───────┘
                                      │
                                      ▼
                              ┌──────────────┐
                              │  TERMINATED  │
                              │   (removed)  │
                              └──────────────┘
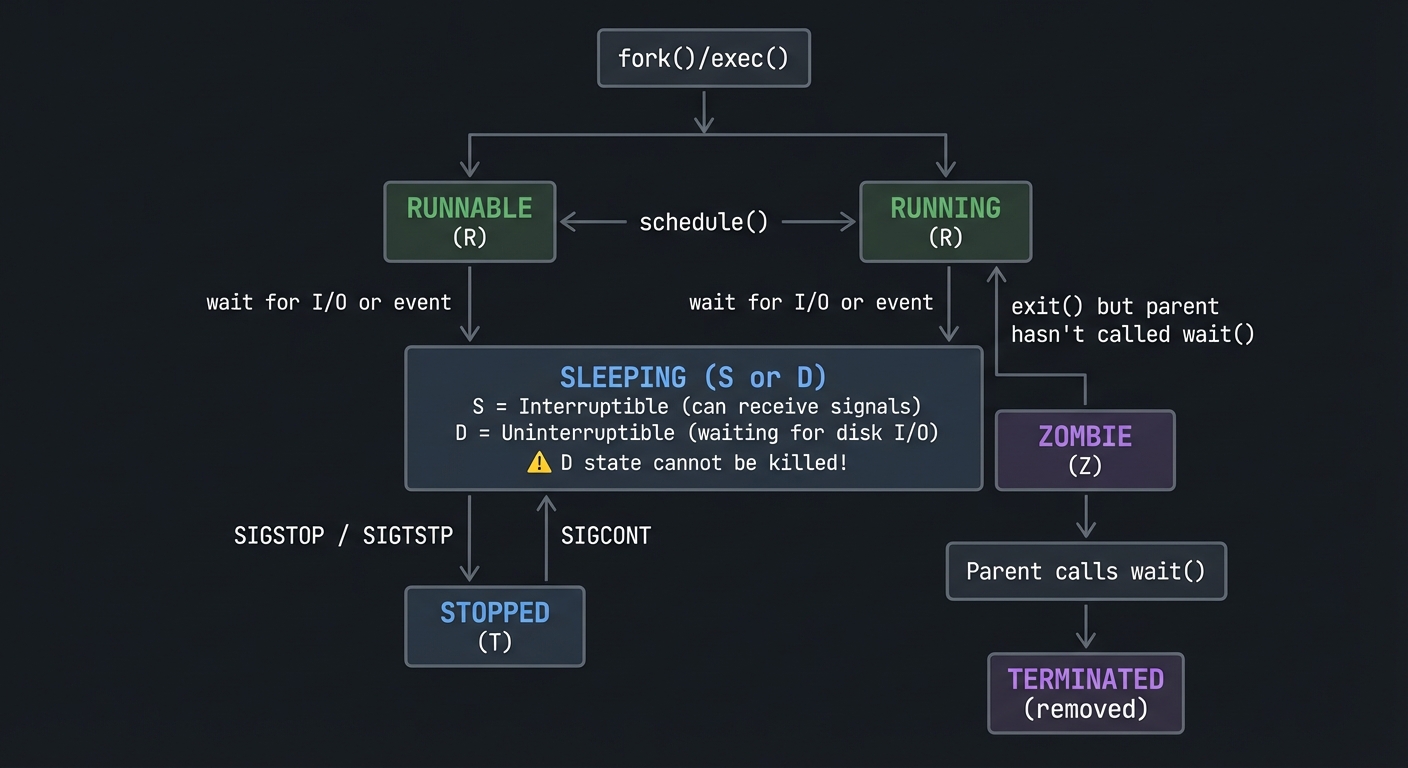
Why this matters: When you see a process in D state, you CANNOT kill it—even with kill -9. It’s waiting for hardware (usually disk I/O). This is why “frozen” processes sometimes require a reboot.
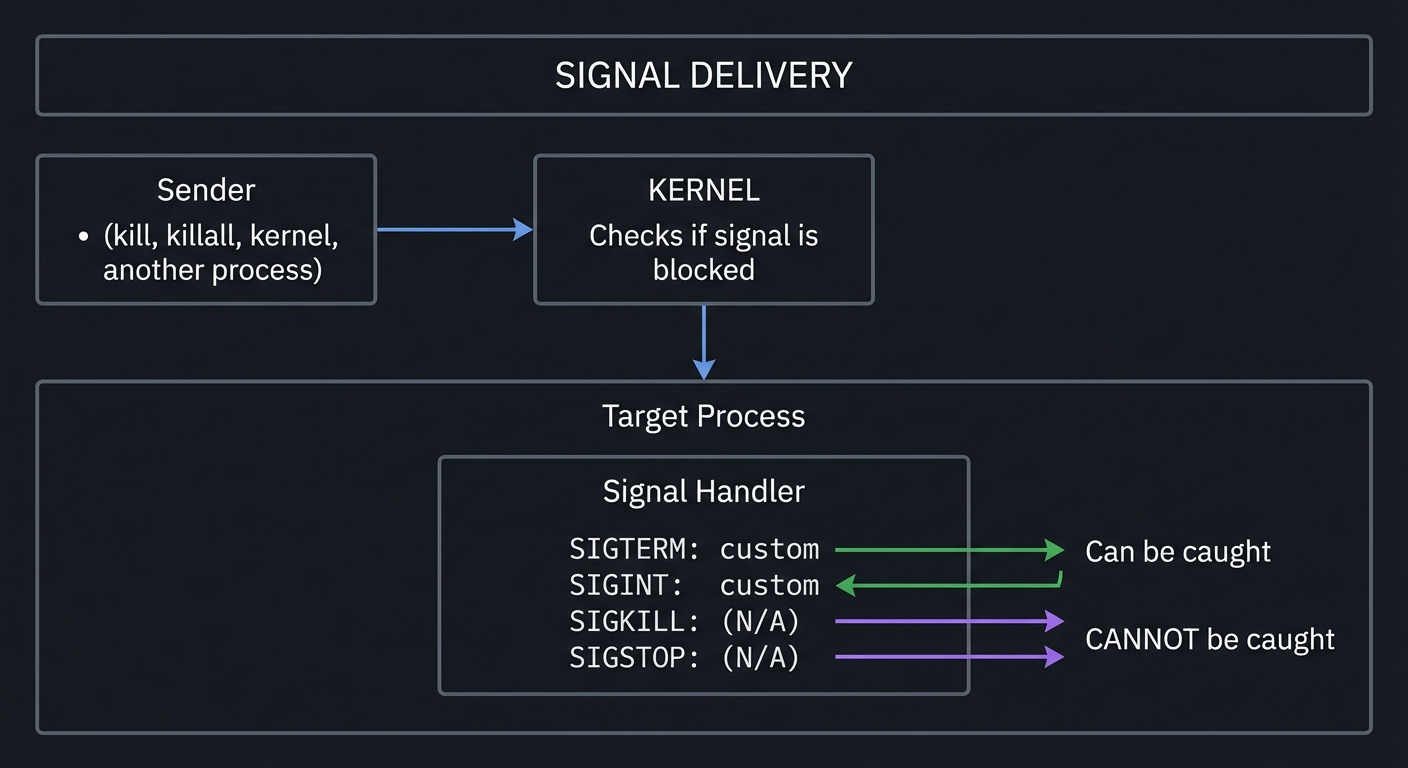
Signals: The Language of Process Control
Signals are software interrupts. When a process receives a signal, it stops what it’s doing and handles it.
┌────────────────────────────────────────────────────────────────────────┐
│                         SIGNAL DELIVERY                                │
├────────────────────────────────────────────────────────────────────────┤
│                                                                        │
│   Sender                                                               │
│   (kill, killall,          ┌─────────────┐                            │
│    kernel, another    ────►│   KERNEL    │                            │
│    process)                │             │                            │
│                            │ Checks if   │                            │
│                            │ signal is   │                            │
│                            │ blocked     │                            │
│                            └──────┬──────┘                            │
│                                   │                                    │
│                                   ▼                                    │
│                      ┌────────────────────────┐                       │
│                      │    Target Process      │                       │
│                      │                        │                       │
│                      │  ┌──────────────────┐  │                       │
│                      │  │  Signal Handler  │  │                       │
│                      │  │                  │  │                       │
│                      │  │  SIGTERM: custom │  │ ◄── Can be caught    │
│                      │  │  SIGINT:  custom │  │                       │
│                      │  │  SIGKILL: (N/A)  │  │ ◄── CANNOT be caught │
│                      │  │  SIGSTOP: (N/A)  │  │ ◄── CANNOT be caught │
│                      │  └──────────────────┘  │                       │
│                      └────────────────────────┘                       │
└────────────────────────────────────────────────────────────────────────┘
Common signals you’ll use:
| Signal | Number | Default Action | Can Catch? | Use Case |
|---|---|---|---|---|
| SIGHUP | 1 | Terminate | Yes | Reload config |
| SIGINT | 2 | Terminate | Yes | Ctrl+C |
| SIGQUIT | 3 | Core dump | Yes | Ctrl+\ |
| SIGKILL | 9 | Terminate | NO | Force kill |
| SIGTERM | 15 | Terminate | Yes | Graceful shutdown |
| SIGSTOP | 19 | Stop | NO | Pause process |
| SIGCONT | 18 | Continue | Yes | Resume paused |
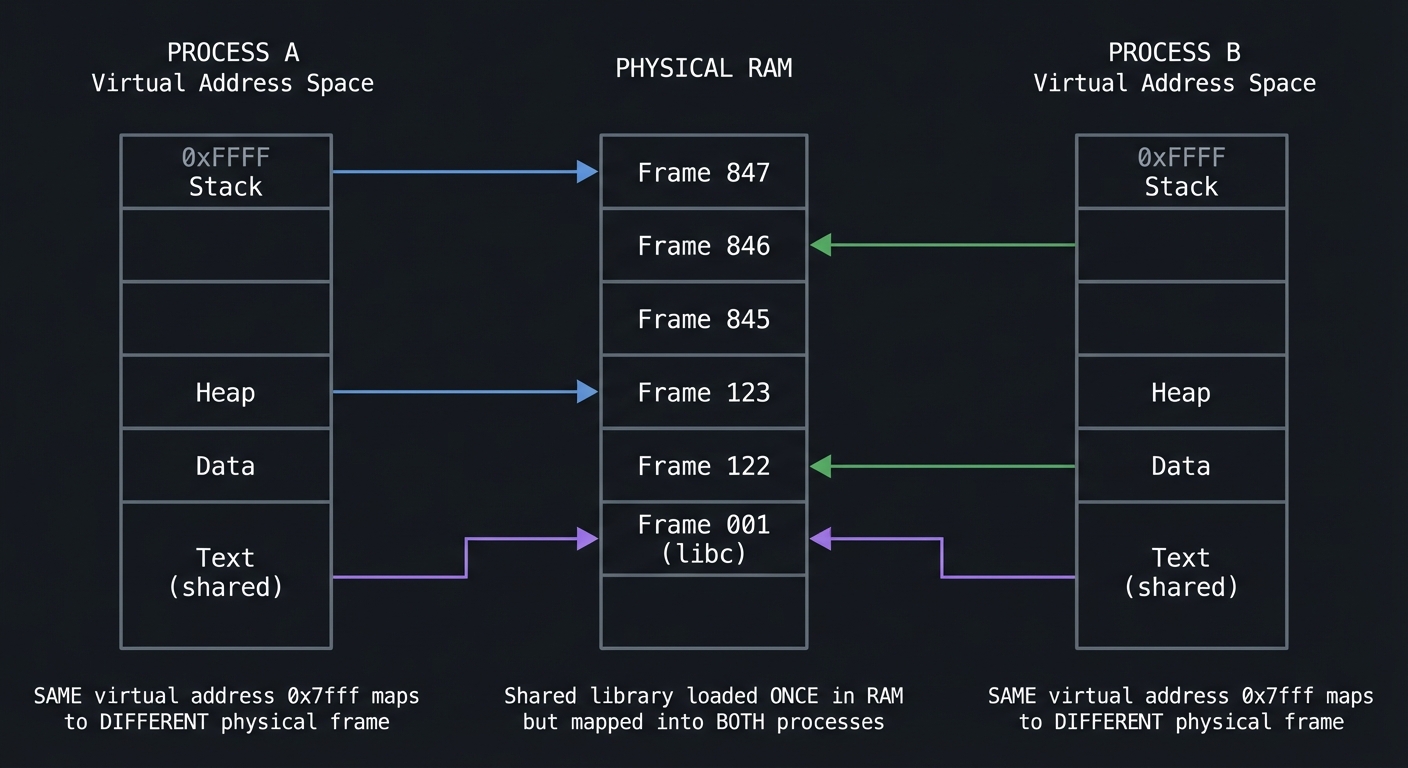
Memory: Virtual vs Physical
Every process thinks it has the entire address space to itself. This is the virtual memory illusion.
     PROCESS A                    PHYSICAL RAM                 PROCESS B
     Virtual                                                   Virtual
     Address                                                   Address
     Space                                                     Space

   ┌──────────┐                 ┌──────────────┐             ┌──────────┐
   │ 0xFFFF   │                 │              │             │ 0xFFFF   │
   │  Stack   │────────────────►│  Frame 847   │◄────────────│  Stack   │
   ├──────────┤                 ├──────────────┤             ├──────────┤
   │          │                 │  Frame 846   │             │          │
   │          │                 ├──────────────┤             │          │
   │          │                 │  Frame 845   │             │          │
   ├──────────┤                 ├──────────────┤             ├──────────┤
   │   Heap   │────────────────►│  Frame 123   │             │   Heap   │
   ├──────────┤                 ├──────────────┤             ├──────────┤
   │   Data   │                 │  Frame 122   │◄────────────│   Data   │
   ├──────────┤                 ├──────────────┤             ├──────────┤
   │   Text   │────┐            │  Frame 001   │         ┌───│   Text   │
   │ (shared) │    │            │   (libc)     │◄────────┘   │ (shared) │
   └──────────┘    └───────────►│              │             └──────────┘
                                └──────────────┘

   SAME virtual                  Shared library               SAME virtual
   address 0x7fff               loaded ONCE in RAM            address 0x7fff
   maps to DIFFERENT            but mapped into BOTH          maps to DIFFERENT
   physical frame               processes                     physical frame
Key memory terms:
| Term | Meaning | Tool to See It |
|---|---|---|
| VSZ (Virtual Size) | Total virtual memory allocated | ps, top |
| RSS (Resident Set Size) | Physical RAM actually used | ps, top, pmap |
| Shared | Memory shared with other processes | pmap -x |
| Private | Memory used only by this process | pmap -x |
| Swap | Memory paged out to disk | free, vmstat |
Critical insight: VSZ can be huge (gigabytes) while RSS is small (megabytes). VSZ includes mapped files that haven’t been loaded yet. RSS is what actually matters for memory pressure.
System Calls: The Kernel API
When your program needs to do anything real (read a file, open a network connection, allocate memory), it must ask the kernel. This request is called a system call.
┌─────────────────────────────────────────────────────────────────────────┐
│                         USER SPACE                                      │
│                                                                         │
│   Your Program              C Library (glibc)                          │
│   ┌──────────┐              ┌──────────────────┐                       │
│   │  fopen() │─────────────►│  fopen() wrapper │                       │
│   └──────────┘              │        │         │                       │
│                             │        ▼         │                       │
│                             │   open() syscall │                       │
│                             │   wrapper        │                       │
│                             └────────┬─────────┘                       │
│                                      │                                  │
└──────────────────────────────────────┼──────────────────────────────────┘
                                       │
                          ═════════════╧═════════════  SYSCALL BOUNDARY
                                       │               (mode switch)
                                       ▼
┌─────────────────────────────────────────────────────────────────────────┐
│                         KERNEL SPACE                                    │
│                                                                         │
│   Syscall Table                                                         │
│   ┌────────────────────────────────────────────────────────────────┐   │
│   │  0: read()                                                      │   │
│   │  1: write()                                                     │   │
│   │  2: open()   ◄─── Called for our fopen()                       │   │
│   │  3: close()                                                     │   │
│   │  ...                                                            │   │
│   │  435: clone3() (newest syscalls)                               │   │
│   └────────────────────────────────────────────────────────────────┘   │
│                                                                         │
│   Each syscall:                                                         │
│   - Validates arguments                                                 │
│   - Checks permissions                                                  │
│   - Performs the operation                                              │
│   - Returns result (or error number)                                    │
│                                                                         │
└─────────────────────────────────────────────────────────────────────────┘
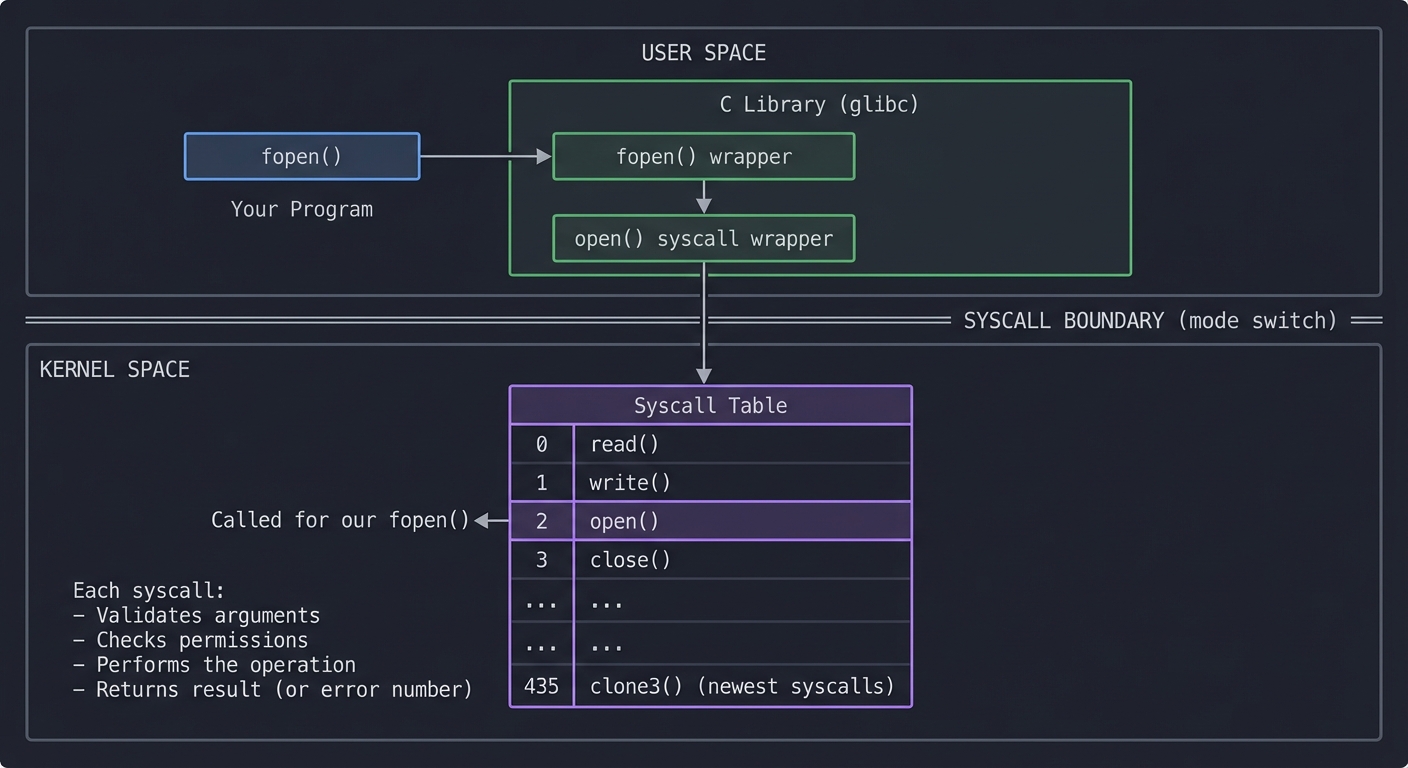
strace intercepts RIGHT HERE—at the syscall boundary. It shows you every request your program makes to the kernel.
Most common syscalls you’ll see in strace output:
| Syscall | Purpose | What Problems It Reveals |
|---|---|---|
open() / openat() |
Open files | Missing files, permission denied |
read() / write() |
I/O operations | Slow I/O, blocking reads |
mmap() |
Map memory | Memory allocation patterns |
fork() / clone() |
Create processes | Process creation overhead |
execve() |
Run new program | Command not found, path issues |
connect() |
Network connection | Network failures, DNS issues |
poll() / select() |
Wait for events | Why process is “stuck” |
The Kernel Ring Buffer: dmesg
The kernel maintains a circular buffer of messages—boot information, hardware events, driver messages, and errors. This is the kernel’s diary.
┌─────────────────────────────────────────────────────────────────────────┐
│                    KERNEL RING BUFFER                                   │
│                                                                         │
│   ┌─────────────────────────────────────────────────────────────────┐  │
│   │ [0.000000] Linux version 6.1.0 ...                              │  │
│   │ [0.000001] Command line: BOOT_IMAGE=/vmlinuz ...                │  │
│   │ [0.123456] Memory: 16384MB available                            │  │
│   │ [1.234567] ACPI: Added _OSI(Linux)                              │  │
│   │ [2.345678] PCI: Using configuration type 1                      │  │
│   │ [3.456789] usb 1-1: new high-speed USB device                   │  │
│   │ ...                                                             │  │
│   │ [86400.123] Out of memory: Killed process 1234 (myapp)         │◄─┼── PROBLEM!
│   │ [86401.456] ata1.00: exception Emask 0x0 SAct 0x0              │◄─┼── Disk failing!
│   │ [86402.789] EXT4-fs error (device sda1): ...                   │◄─┼── Filesystem error!
│   └─────────────────────────────────────────────────────────────────┘  │
│                                        ▲                                │
│                    Circular buffer ────┘                                │
│                    (old messages overwritten)                           │
│                                                                         │
│   Access via:  dmesg  or  /dev/kmsg  or  journalctl -k                 │
└─────────────────────────────────────────────────────────────────────────┘

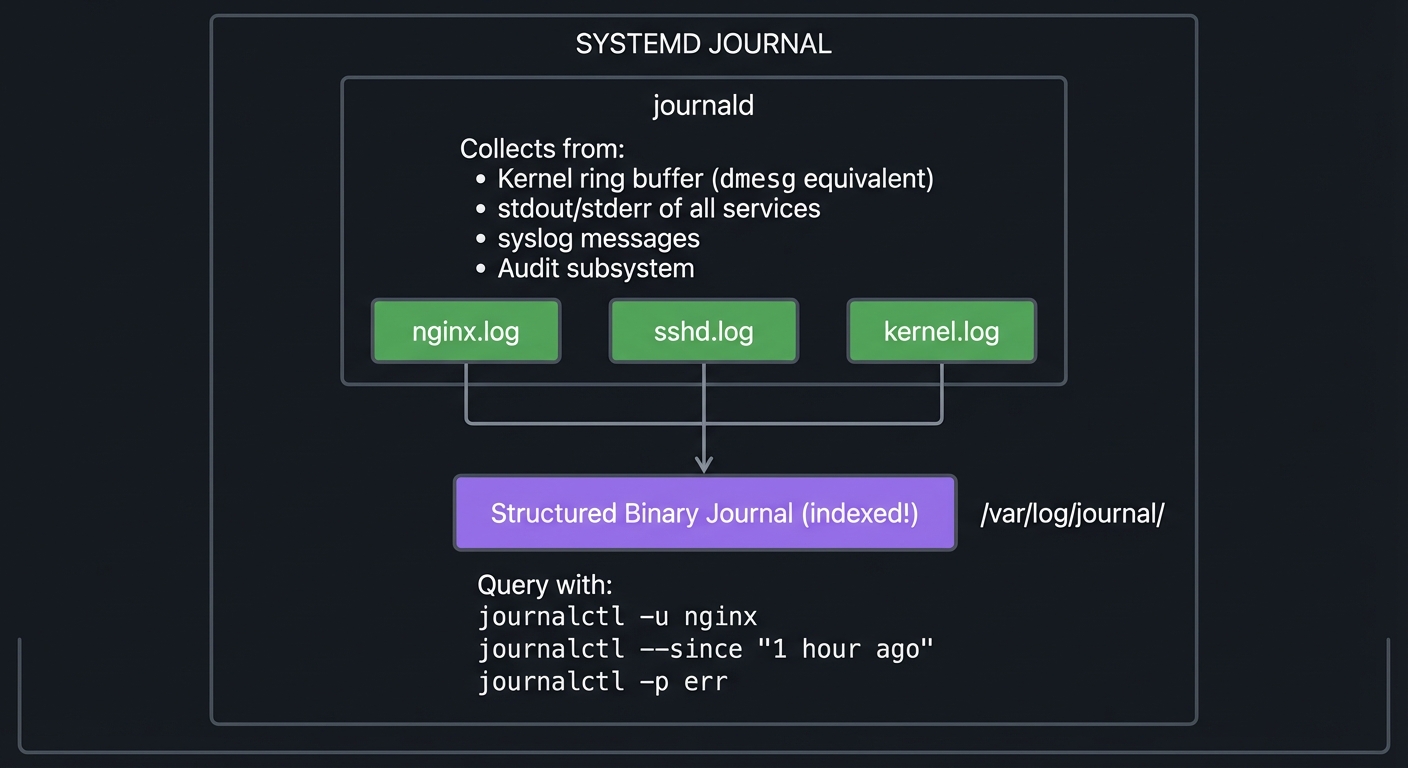
Systemd Journal: The Complete Picture
Modern Linux uses systemd, which maintains a structured, indexed log of EVERYTHING:
┌─────────────────────────────────────────────────────────────────────────┐
│                     SYSTEMD JOURNAL                                     │
│                                                                         │
│   ┌─────────────────────────────────────────────────────────────────┐  │
│   │                     journald                                    │  │
│   │                                                                 │  │
│   │   Collects from:                                                │  │
│   │   • Kernel ring buffer (dmesg equivalent)                       │  │
│   │   • stdout/stderr of all services                               │  │
│   │   • syslog messages                                             │  │
│   │   • Audit subsystem                                             │  │
│   │                                                                 │  │
│   │   ┌────────────┐  ┌────────────┐  ┌────────────┐               │  │
│   │   │  nginx.log │  │  sshd.log  │  │ kernel.log │               │  │
│   │   └─────┬──────┘  └─────┬──────┘  └─────┬──────┘               │  │
│   │         │               │               │                       │  │
│   │         └───────────────┼───────────────┘                       │  │
│   │                         ▼                                       │  │
│   │              ┌──────────────────┐                               │  │
│   │              │  Structured      │                               │  │
│   │              │  Binary Journal  │  /var/log/journal/            │  │
│   │              │  (indexed!)      │                               │  │
│   │              └──────────────────┘                               │  │
│   │                                                                 │  │
│   │   Query with:  journalctl -u nginx                              │  │
│   │                journalctl --since "1 hour ago"                  │  │
│   │                journalctl -p err                                │  │
│   └─────────────────────────────────────────────────────────────────┘  │
└─────────────────────────────────────────────────────────────────────────┘
Load Average: What Does It Actually Mean?
$ uptime
 14:32:01 up 7 days, 3:42, 2 users, load average: 2.50, 1.75, 0.80
                                                   ────  ────  ────
                                                    │     │     │
                                                    │     │     └─ 15-min avg
                                                    │     └─────── 5-min avg
                                                    └───────────── 1-min avg
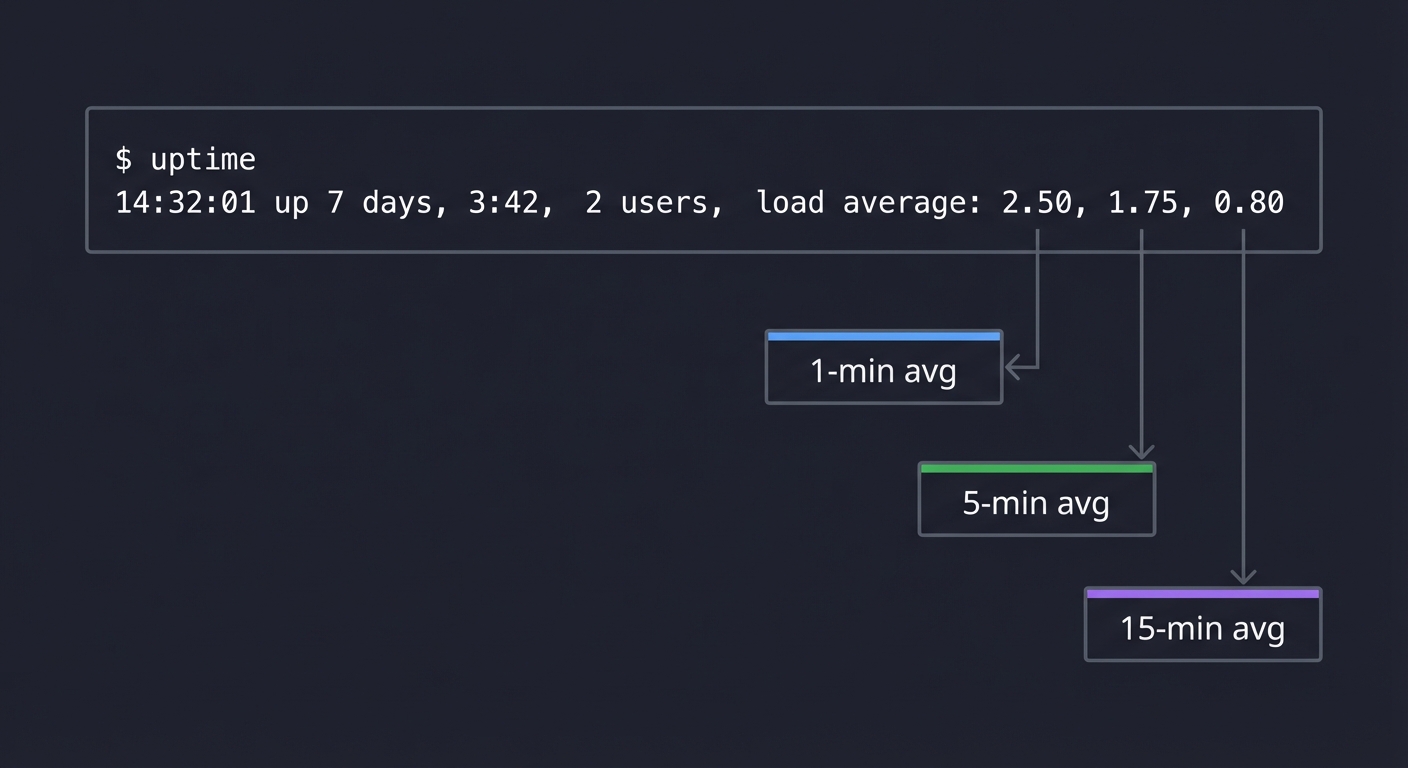
What these numbers mean:
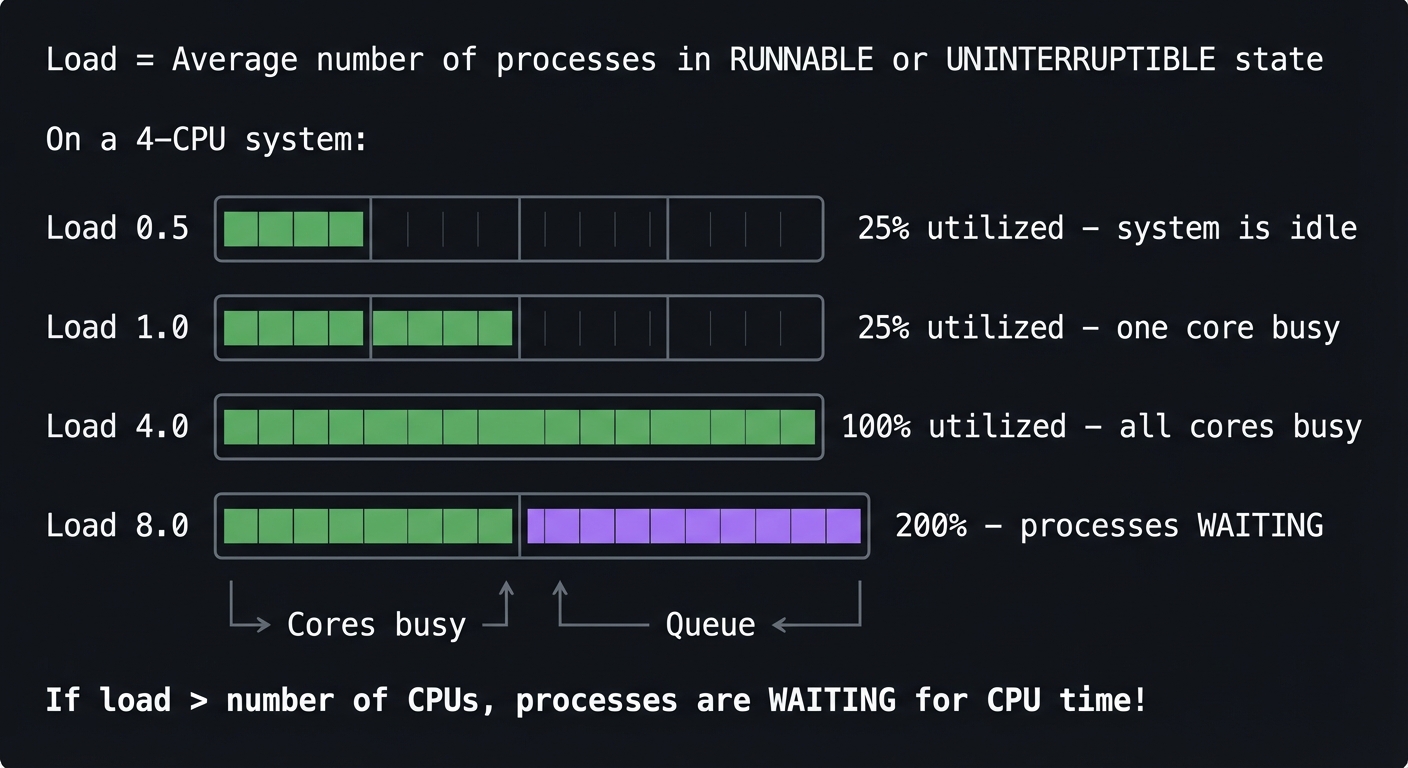
   Load = Average number of processes in RUNNABLE or UNINTERRUPTIBLE state

   On a 4-CPU system:

   Load 0.5  │████░░░░░░░░░░░░│  25% utilized - system is idle
   Load 1.0  │████████░░░░░░░░│  25% utilized - one core busy
   Load 4.0  │████████████████│ 100% utilized - all cores busy
   Load 8.0  │████████████████│████████████████│  200% - processes WAITING
              └── Cores busy ──┘└── Queue ──────┘

   If load > number of CPUs, processes are WAITING for CPU time!
Reading the trend:
2.50, 1.75, 0.80→ Load is INCREASING (investigate now!)0.80, 1.75, 2.50→ Load is DECREASING (was busy, improving)2.00, 2.00, 2.00→ Sustained load (normal for this workload?)
Concept Summary Table
| Concept Cluster | What You Need to Internalize |
|---|---|
| Process Model | A process is a kernel-managed container with its own address space, file descriptors, and state. Everything you can observe comes from /proc/<pid>/. |
| Process States | R=Running, S=Sleeping (interruptible), D=Disk sleep (unkillable!), Z=Zombie, T=Stopped. Understanding states explains “why won’t this die?” |
| Signals | Software interrupts for process control. SIGTERM asks nicely, SIGKILL forces. Only SIGKILL and SIGSTOP cannot be caught. |
| Virtual Memory | Processes see virtual addresses; kernel maps to physical RAM. VSZ is allocated, RSS is actually used. Swap is emergency overflow. |
| System Calls | Every real operation (I/O, network, memory) requires asking the kernel. strace shows this conversation. |
| Kernel Ring Buffer | Circular log of hardware/driver events. Essential for debugging hardware, boot, and low-level issues. |
| Systemd Journal | Structured logs from everything—services, kernel, syslog. Persistent across reboots if configured. |
| Load Average | Average processes wanting CPU. Compare to CPU count. Trend tells the story. |
Deep Dive Reading by Concept
This section maps each concept to specific book chapters for deeper understanding.
Processes and Process States
| Concept | Book & Chapter |
|---|---|
| Process creation (fork/exec) | “The Linux Programming Interface” by Michael Kerrisk — Ch. 24-28 |
| Process states and scheduling | “Operating Systems: Three Easy Pieces” — Ch. 4-7 (CPU Scheduling) |
| /proc filesystem | “The Linux Programming Interface” — Ch. 12 |
Signals
| Concept | Book & Chapter |
|---|---|
| Signal fundamentals | “The Linux Programming Interface” — Ch. 20-22 |
| Signal handlers in C | “Advanced Programming in the UNIX Environment” by Stevens — Ch. 10 |
Memory Management
| Concept | Book & Chapter |
|---|---|
| Virtual memory concepts | “Operating Systems: Three Easy Pieces” — Ch. 13-23 (Memory Virtualization) |
| Process memory layout | “Computer Systems: A Programmer’s Perspective” — Ch. 9 |
| Memory mapping | “The Linux Programming Interface” — Ch. 49-50 |
System Calls and Tracing
| Concept | Book & Chapter |
|---|---|
| System call mechanism | “The Linux Programming Interface” — Ch. 3 |
| strace usage | “Linux System Programming” by Robert Love — Ch. 1 |
Kernel and Logs
| Concept | Book & Chapter |
|---|---|
| Kernel internals | “Linux Kernel Development” by Robert Love — Ch. 1-5 |
| Systemd and journald | “How Linux Works” by Brian Ward — Ch. 6 |
Essential Reading Order
For maximum comprehension, read in this order:
- Foundation (Week 1-2):
- OSTEP Ch. 4-7 (process concepts)
- TLPI Ch. 3 (system calls overview)
- Processes Deep (Week 3-4):
- TLPI Ch. 24-28 (processes)
- TLPI Ch. 20-22 (signals)
- Memory (Week 5-6):
- OSTEP Ch. 13-23 (memory virtualization)
- CS:APP Ch. 9 (virtual memory)
- Advanced (Week 7-8):
- TLPI Ch. 49-50 (memory mapping)
- How Linux Works Ch. 6 (systemd)
Project List
Projects are ordered from fundamental understanding to advanced debugging scenarios. Each project forces you to USE the tools in realistic situations.
Project 1: Process Explorer Dashboard
- File: LINUX_SYSTEM_TOOLS_MASTERY.md
- Main Programming Language: Bash
- Alternative Programming Languages: Python, Go, Rust
- Coolness Level: Level 3: Genuinely Clever
- Business Potential: 2. The “Micro-SaaS / Pro Tool”
- Difficulty: Level 1: Beginner
- Knowledge Area: Process Management / System Monitoring
- Software or Tool: ps, top, /proc filesystem
- Main Book: “The Linux Programming Interface” by Michael Kerrisk
What you’ll build: A terminal dashboard that displays real-time process information—CPU usage, memory, state, parent-child relationships—by reading directly from /proc and using ps creatively.
Why it teaches process fundamentals: Building this forces you to understand what information the kernel exposes about processes and WHERE that information comes from. You’ll discover that ps and top are just reading files from /proc.
Core challenges you’ll face:
- Reading
/proc/<pid>/statand parsing it → maps to understanding process state fields - Calculating CPU percentage from jiffies → maps to how the kernel tracks CPU time
- Building a process tree from PPID → maps to parent-child process relationships
- Handling processes that disappear → maps to race conditions in /proc
Key Concepts:
- Process States: “The Linux Programming Interface” Ch. 26 — Michael Kerrisk
- /proc filesystem: “How Linux Works” Ch. 8 — Brian Ward
- CPU accounting: “Linux System Programming” Ch. 5 — Robert Love
Difficulty: Beginner Time estimate: Weekend Prerequisites: Basic shell scripting, understanding of file I/O
Real World Outcome
You’ll have a terminal tool that shows you what’s happening on your system RIGHT NOW:
Example Output:
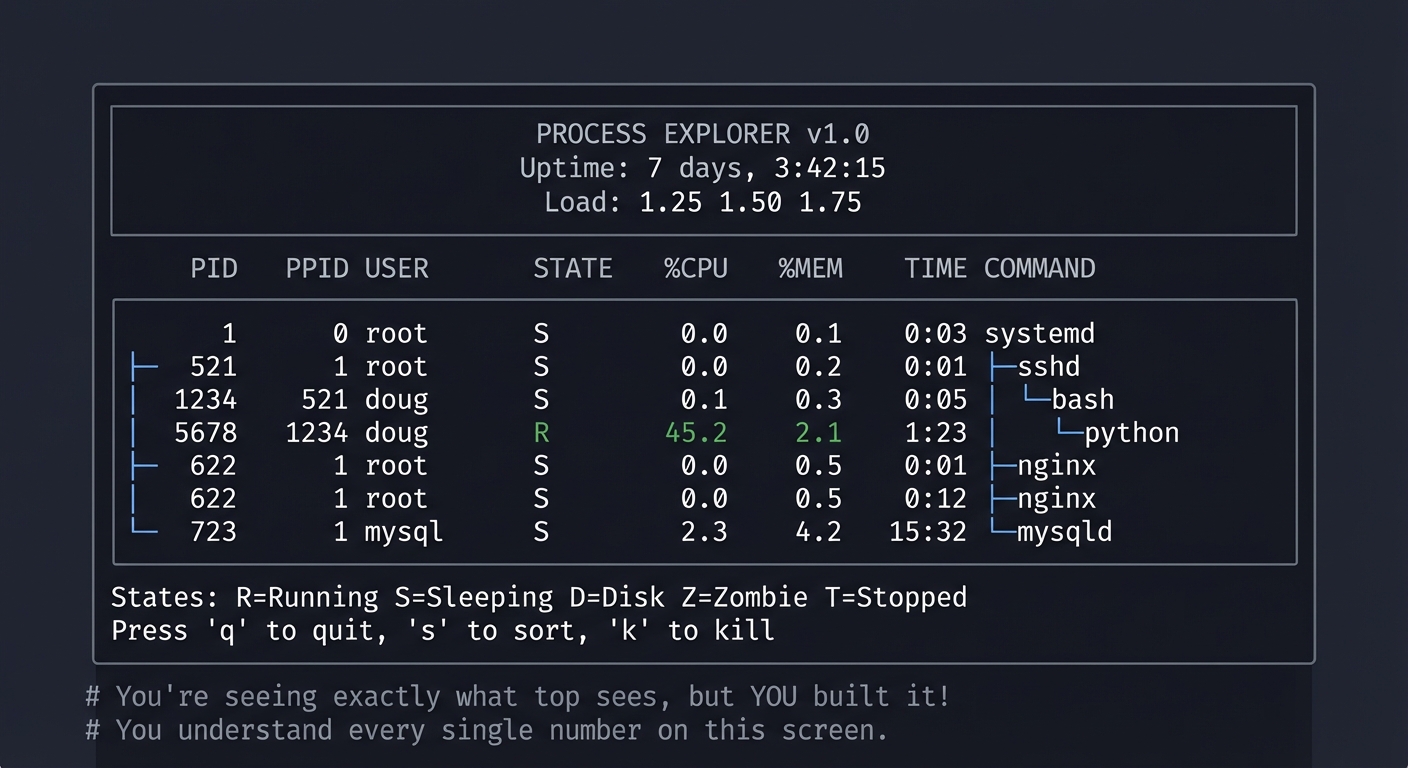
$ ./procexplorer

╔════════════════════════════════════════════════════════════════════════╗
║                     PROCESS EXPLORER v1.0                              ║
║                     Uptime: 7 days, 3:42:15                            ║
║                     Load: 1.25 1.50 1.75                               ║
╠════════════════════════════════════════════════════════════════════════╣
║  PID   PPID  USER     STATE  %CPU  %MEM  TIME      COMMAND             ║
╠════════════════════════════════════════════════════════════════════════╣
║  1     0     root     S      0.0   0.1   0:03      systemd             ║
║  ├─521 1     root     S      0.0   0.2   0:01      ├─sshd              ║
║  │ └─1234    521      doug   S      0.1   0.3   0:05      │ └─bash     ║
║  │   └─5678  1234     doug   R      45.2  2.1   1:23      │   └─python ║
║  ├─622 1     root     S      0.0   0.5   0:12      ├─nginx            ║
║  └─723 1     mysql    S      2.3   4.2   15:32     └─mysqld           ║
╠════════════════════════════════════════════════════════════════════════╣
║  States: R=Running S=Sleeping D=Disk Z=Zombie T=Stopped               ║
║  Press 'q' to quit, 's' to sort, 'k' to kill                          ║
╚════════════════════════════════════════════════════════════════════════╝

# You're seeing exactly what top sees, but YOU built it!
# You understand every single number on this screen.
The Core Question You’re Answering
“Where does
psget its information, and what do all those columns actually mean?”
Before you write any code, sit with this question. Most developers use ps aux and top without understanding that they’re just parsing text files in /proc. The kernel exposes EVERYTHING about every process as files you can read.
Concepts You Must Understand First
Stop and research these before coding:
- The /proc Filesystem
- What IS
/proc? Is it stored on disk? - What’s in
/proc/<pid>/stat? How many fields? - What’s the difference between
/proc/<pid>/statusand/proc/<pid>/stat? - Book Reference: “The Linux Programming Interface” Ch. 12 — Kerrisk
- What IS
- Process States
- What does each state letter mean (R, S, D, Z, T)?
- Why can’t you kill a process in D state?
- What creates a zombie process?
- Book Reference: “Operating Systems: Three Easy Pieces” Ch. 4 — OSTEP
- CPU Time Calculation
- What are “jiffies”?
- How do you calculate CPU percentage from utime and stime?
- What’s in
/proc/statvs/proc/<pid>/stat? - Book Reference: “Linux System Programming” Ch. 5 — Robert Love
Questions to Guide Your Design
Before implementing, think through these:
- Data Source
- Will you use
psoutput or read/procdirectly? - What’s the tradeoff of each approach?
- How will you handle permission errors for processes you can’t read?
- Will you use
- Refresh Strategy
- How often should you refresh? Every second?
- How will you detect processes that died between refreshes?
- How will you track CPU usage over time (need two samples)?
- Display
- How will you build the tree structure?
- What happens when the terminal is too narrow?
- How will you handle many processes (scrolling)?
Thinking Exercise
Trace the Data Flow
Before coding, open a terminal and explore:
# Pick any process
$ ps aux | head -5
USER       PID %CPU %MEM    VSZ   RSS TTY      STAT START   TIME COMMAND

# Now find where that data comes from
$ cat /proc/1/stat
1 (systemd) S 0 1 1 0 -1 4194560 12345 67890 ...

# What are all those numbers?
$ cat /proc/1/status
Name:   systemd
State:  S (sleeping)
Pid:    1
PPid:   0
...
Questions while exploring:
- Can you match the
psoutput columns to/procfields? - What’s the 3rd field in
/proc/<pid>/stat? (Hint: it’s the state) - How would you calculate %CPU from what you see?
The Interview Questions They’ll Ask
Prepare to answer these:
- “How would you find the process using the most CPU on a Linux system?”
- “What’s the difference between VSZ and RSS?”
- “Why might a process show 0% CPU but still be using CPU time?”
- “How do you find all child processes of a given PID?”
- “What’s a zombie process and how do you get rid of it?”
Hints in Layers
Hint 1: Starting Point
Start by just reading and parsing /proc/<pid>/stat for ONE process. Print the fields with labels.
Hint 2: Building the Loop
Use /proc itself to list all processes—every numeric directory is a PID. Loop through them.
Hint 3: Calculating CPU You need two samples to calculate CPU percentage. Store the previous utime+stime, wait 1 second, read again, calculate the difference.
Hint 4: Debugging with strace
Run strace ps aux 2>&1 | grep open to see exactly which files ps opens. Learn from the master!
Books That Will Help
| Topic | Book | Chapter |
|---|---|---|
| /proc filesystem | “The Linux Programming Interface” by Kerrisk | Ch. 12 |
| Process states | “Operating Systems: Three Easy Pieces” | Ch. 4-6 |
| CPU time accounting | “Linux System Programming” by Love | Ch. 5 |
| Terminal control | “Advanced Programming in the UNIX Environment” | Ch. 18 |
Implementation Hints
The /proc filesystem is a window into kernel data structures. Every process has a directory /proc/<pid>/ containing:
/proc/<pid>/
├── stat        # One-line summary (space-separated, tricky to parse!)
├── status      # Human-readable key-value pairs
├── cmdline     # Command line (null-separated)
├── fd/         # Directory of file descriptors
├── maps        # Memory mappings
├── mem         # Process memory (dangerous!)
└── ...
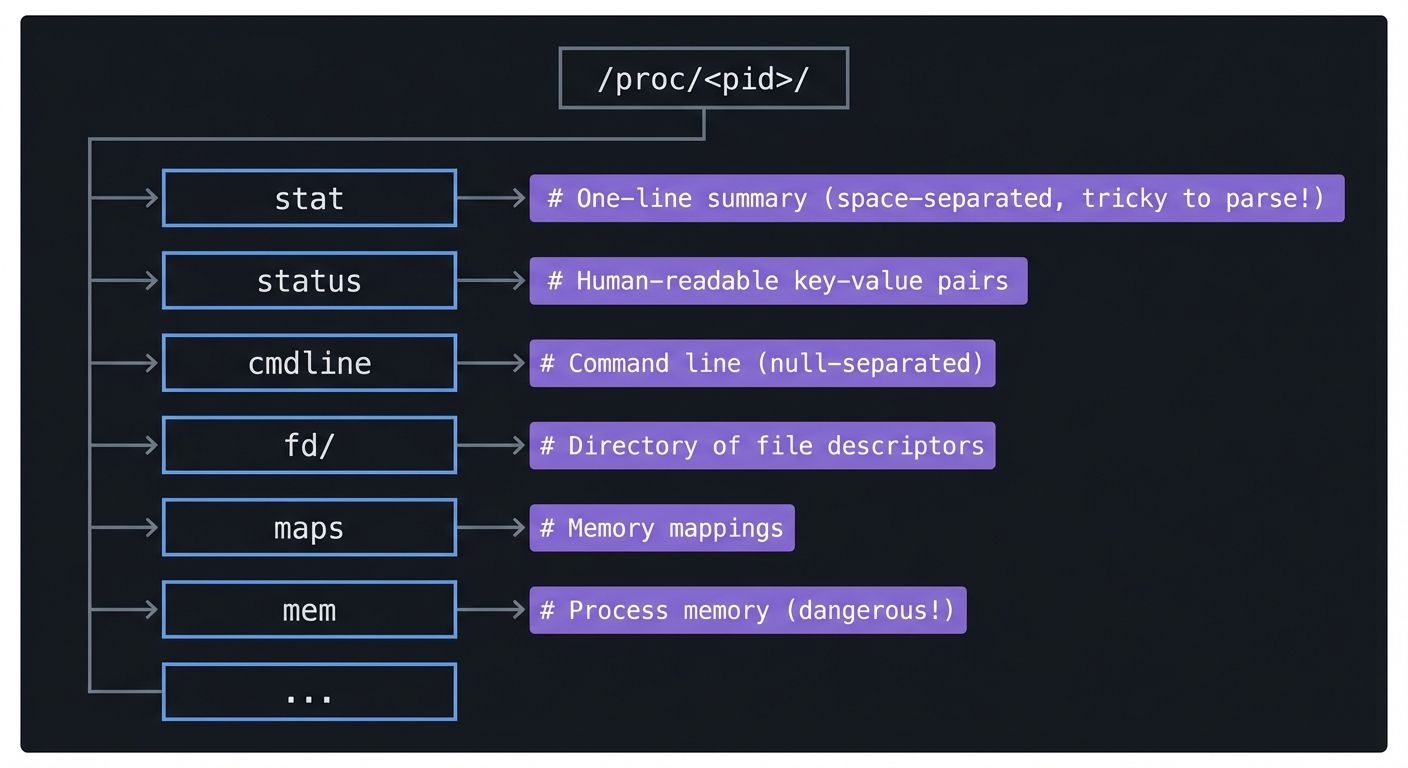
The stat file has 52 fields. Field 3 is the state. Fields 14-17 are CPU times (utime, stime, cutime, cstime) in clock ticks.
To calculate CPU%: ((current_utime + current_stime) - (prev_utime + prev_stime)) / time_elapsed / num_cpus * 100
Learning Milestones:
- You can parse /proc/*/stat → You understand process metadata
- You can build a process tree → You understand PPID relationships
- You can calculate CPU% → You understand kernel time accounting
Project 2: Memory Leak Detective
- File: LINUX_SYSTEM_TOOLS_MASTERY.md
- Main Programming Language: C
- Alternative Programming Languages: Rust, Python, Go
- Coolness Level: Level 4: Hardcore Tech Flex
- Business Potential: 1. The “Resume Gold”
- Difficulty: Level 3: Advanced
- Knowledge Area: Memory Management / Debugging
- Software or Tool: pmap, free, vmstat, /proc/meminfo
- Main Book: “Computer Systems: A Programmer’s Perspective” by Bryant & O’Hallaron
What you’ll build: A tool that monitors a process’s memory over time, detects potential memory leaks by tracking heap growth, and visualizes memory regions using pmap data.
Why it teaches memory concepts: You’ll understand the difference between VSZ and RSS, see how malloc actually allocates memory, understand shared vs private memory, and learn to read memory maps like a debugger does.
Core challenges you’ll face:
- Parsing pmap output → maps to understanding memory region types
- Tracking heap growth over time → maps to identifying leak patterns
- Understanding anonymous vs file-backed mappings → maps to how memory is allocated
- Calculating actual memory footprint → maps to shared memory complexity
Key Concepts:
- Virtual Memory: “Computer Systems: A Programmer’s Perspective” Ch. 9 — Bryant & O’Hallaron
- Memory Mapping: “The Linux Programming Interface” Ch. 49 — Kerrisk
- Process Memory Layout: “Operating Systems: Three Easy Pieces” Ch. 13-15 — OSTEP
Difficulty: Advanced Time estimate: 1-2 weeks Prerequisites: Project 1 completed, understanding of pointers and memory allocation, basic C knowledge
Real World Outcome
You’ll have a tool that watches a process and alerts you to memory leaks:
Example Output:
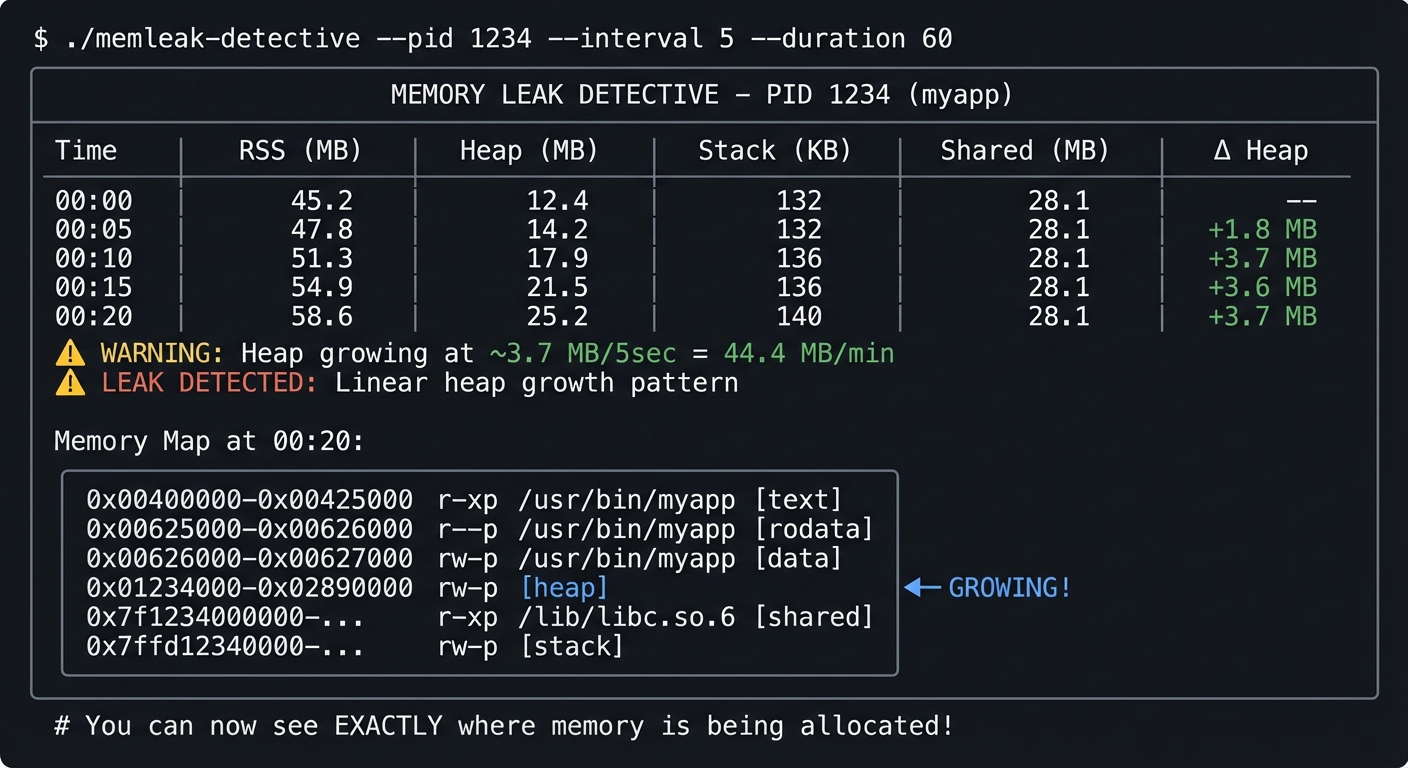
$ ./memleak-detective --pid 1234 --interval 5 --duration 60

╔═══════════════════════════════════════════════════════════════════════════╗
║              MEMORY LEAK DETECTIVE - PID 1234 (myapp)                     ║
╠═══════════════════════════════════════════════════════════════════════════╣
║  Time    │ RSS (MB) │ Heap (MB) │ Stack (KB) │ Shared (MB) │ Δ Heap     ║
╠═══════════════════════════════════════════════════════════════════════════╣
║  00:00   │   45.2   │   12.4    │    132     │    28.1     │    --      ║
║  00:05   │   47.8   │   14.2    │    132     │    28.1     │  +1.8 MB   ║
║  00:10   │   51.3   │   17.9    │    136     │    28.1     │  +3.7 MB   ║
║  00:15   │   54.9   │   21.5    │    136     │    28.1     │  +3.6 MB   ║
║  00:20   │   58.6   │   25.2    │    140     │    28.1     │  +3.7 MB   ║
╠═══════════════════════════════════════════════════════════════════════════╣
║  ⚠️  WARNING: Heap growing at ~3.7 MB/5sec = 44.4 MB/min                  ║
║  ⚠️  LEAK DETECTED: Linear heap growth pattern                            ║
║                                                                           ║
║  Memory Map at 00:20:                                                     ║
║  ┌────────────────────────────────────────────────────────────────────┐  ║
║  │ 0x00400000-0x00425000   r-xp  /usr/bin/myapp         [text]       │  ║
║  │ 0x00625000-0x00626000   r--p  /usr/bin/myapp         [rodata]     │  ║
║  │ 0x00626000-0x00627000   rw-p  /usr/bin/myapp         [data]       │  ║
║  │ 0x01234000-0x02890000   rw-p  [heap]                 ◀─ GROWING!  │  ║
║  │ 0x7f1234000000-...      r-xp  /lib/libc.so.6         [shared]     │  ║
║  │ 0x7ffd12340000-...      rw-p  [stack]                             │  ║
║  └────────────────────────────────────────────────────────────────────┘  ║
╚═══════════════════════════════════════════════════════════════════════════╝

# You can now see EXACTLY where memory is being allocated!
The Core Question You’re Answering
“What’s the difference between a process using 500MB VSZ and one using 500MB RSS? Which one is actually consuming my RAM?”
Before you write any code, sit with this question. Many developers panic when they see high VSZ numbers, not realizing it includes memory that’s been allocated but never touched, mapped files that haven’t been loaded, and shared libraries.
Concepts You Must Understand First
Stop and research these before coding:
- Virtual vs Physical Memory
- What happens when you malloc(1GB) but only touch 1 byte?
- What is “demand paging”?
- Why can the sum of all processes’ RSS exceed physical RAM?
- Book Reference: “Computer Systems: A Programmer’s Perspective” Ch. 9
- Memory Regions
- What’s [heap]? What’s [anon]? What’s [stack]?
- What does r-xp vs rw-p mean in the permissions?
- What’s a memory-mapped file?
- Book Reference: “The Linux Programming Interface” Ch. 49
- pmap and /proc/maps
- What’s the difference between pmap -x and pmap -X?
- What does the “Dirty” column mean?
- How do you identify the heap in /proc/
/maps? - Book Reference: pmap(1) man page, /proc(5) man page
Questions to Guide Your Design
Before implementing, think through these:
- Detection Algorithm
- What pattern indicates a leak vs normal growth?
- How do you distinguish between allocating a large buffer once vs continuous leaking?
- Should you alert on RSS growth or heap growth specifically?
- Data Collection
- How often should you sample? Every second might miss patterns.
- How long should you monitor before declaring a leak?
- Should you store historical data or just track deltas?
- Visualization
- How will you display the memory map meaningfully?
- How will you highlight the growing regions?
- Can you show a timeline graph in the terminal?
Thinking Exercise
Create a Memory Leak and Watch It
Before coding your tool, create a leaky program and observe it:
// leaky.c - compile with: gcc -o leaky leaky.c
#include <stdlib.h>
#include <unistd.h>

int main() {
    while(1) {
        char *leak = malloc(1024 * 1024);  // 1MB
        leak[0] = 'x';  // Touch it so it becomes resident
        sleep(1);
        // Never free!
    }
}
Run these commands in separate terminals:
# Terminal 1
$ ./leaky

# Terminal 2 - watch with pmap
$ watch -n 1 'pmap -x $(pgrep leaky) | tail -5'

# Terminal 3 - watch with ps
$ watch -n 1 'ps -o pid,vsz,rss,comm -p $(pgrep leaky)'
Questions while observing:
- How fast does RSS grow?
- What about VSZ?
- Can you identify the heap region in pmap output?
The Interview Questions They’ll Ask
Prepare to answer these:
- “How would you debug a memory leak in production without restarting the service?”
- “A process shows 2GB VSZ but only 200MB RSS. Is this a problem?”
- “What’s the difference between anonymous and file-backed memory?”
- “Why might a process’s RSS decrease even though it hasn’t freed any memory?”
- “How would you find which library a process is loading into memory?”
Hints in Layers
Hint 1: Starting Point
Start by running pmap -x <pid> and understanding what each column means. Parse just the total line first.
Hint 2: Tracking Changes
Store the heap size at intervals. Look at /proc/
Hint 3: Calculating Growth Rate Fit a linear regression to your samples. If R² is high and slope is positive, you likely have a leak.
Hint 4: Using vmstat for Context
Run vmstat 1 alongside your monitoring to see system-wide memory pressure. This provides context for per-process observations.
Books That Will Help
| Topic | Book | Chapter |
|---|---|---|
| Virtual memory | “CS:APP” by Bryant & O’Hallaron | Ch. 9 |
| Memory mapping | “TLPI” by Kerrisk | Ch. 49-50 |
| Heap internals | “Computer Systems” by Bryant | Ch. 9.9 |
| pmap internals | “How Linux Works” by Ward | Ch. 8 |
Implementation Hints
The key files are:
/proc/<pid>/maps- All memory mappings with addresses and permissions/proc/<pid>/smaps- Detailed stats per mapping (RSS, Shared, Private, Dirty)/proc/<pid>/status- Summary including VmRSS, VmSize, VmData
The heap is the region marked [heap] in maps. Its size is: end_address - start_address.
For detecting leaks, track VmRSS and the heap size over time. A true leak shows linear growth in the heap region specifically.
Learning Milestones:
- You can read and explain pmap output → You understand memory regions
- You can distinguish heap from stack from shared libs → You understand process memory layout
- You can detect and quantify a leak → You can debug real memory problems
Project 3: Syscall Profiler
- File: LINUX_SYSTEM_TOOLS_MASTERY.md
- Main Programming Language: Python
- Alternative Programming Languages: Go, Rust, C
- Coolness Level: Level 4: Hardcore Tech Flex
- Business Potential: 1. The “Resume Gold”
- Difficulty: Level 2: Intermediate
- Knowledge Area: System Calls / Performance Analysis
- Software or Tool: strace
- Main Book: “The Linux Programming Interface” by Michael Kerrisk
What you’ll build: A tool that wraps strace, parses its output, and produces a beautiful report showing which syscalls a program makes, how long they take, and where it spends its time.
Why it teaches syscall concepts: You’ll understand the kernel API, see the conversation between user space and kernel, identify I/O bottlenecks, and learn to diagnose “why is this slow?”
Core challenges you’ll face:
- Parsing strace output format → maps to understanding syscall syntax
- Calculating time spent in each syscall → maps to performance profiling
- Correlating syscalls to file/network operations → maps to I/O behavior
- Handling multi-threaded programs → maps to understanding -f flag
Key Concepts:
- System Calls: “The Linux Programming Interface” Ch. 3 — Kerrisk
- I/O Operations: “Linux System Programming” Ch. 2-4 — Robert Love
- Performance Analysis: “Systems Performance” Ch. 5 — Brendan Gregg
Difficulty: Intermediate Time estimate: 1 week Prerequisites: Basic understanding of system calls, Python scripting
Real World Outcome
You’ll have a tool that shows you EXACTLY what a program is doing at the kernel level:
Example Output:
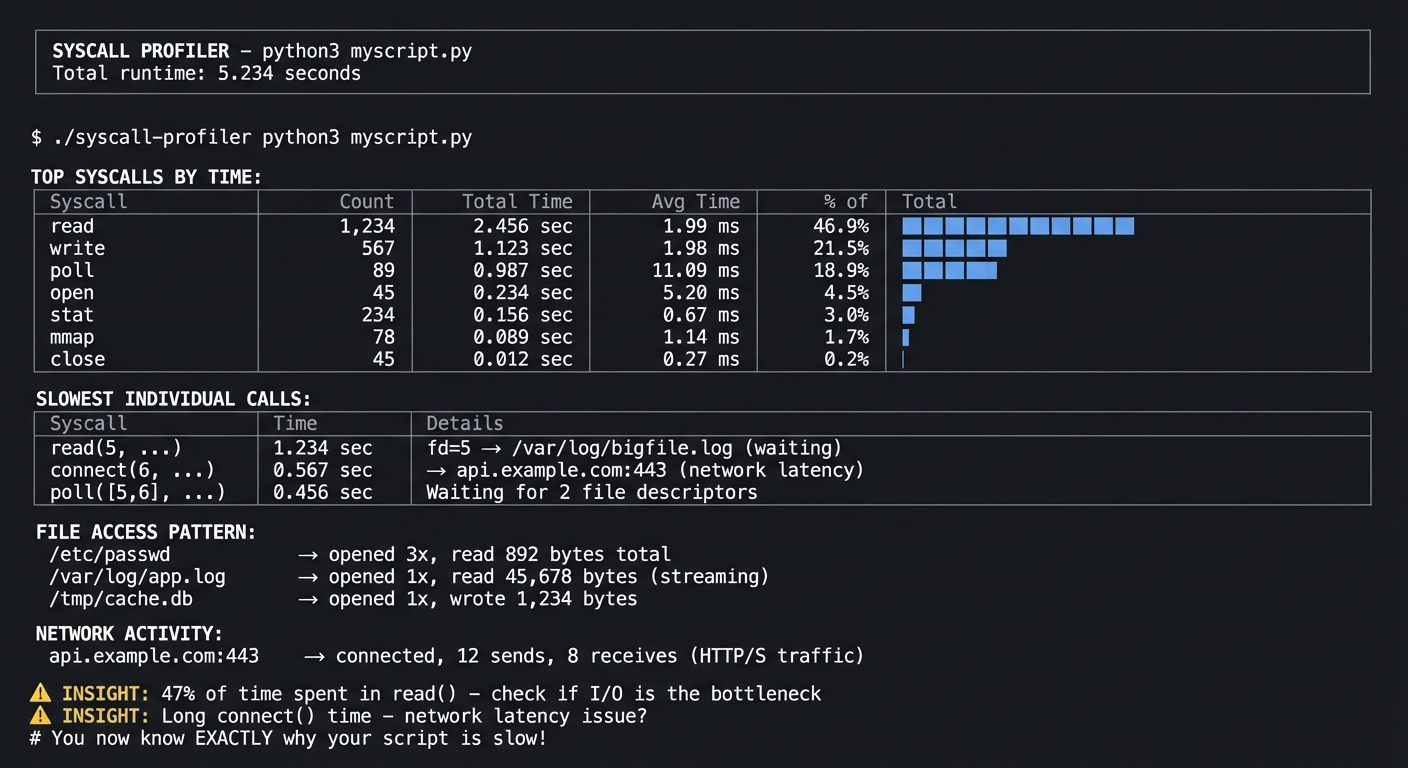
$ ./syscall-profiler python3 myscript.py

═══════════════════════════════════════════════════════════════════════════════
                    SYSCALL PROFILER - python3 myscript.py
                    Total runtime: 5.234 seconds
═══════════════════════════════════════════════════════════════════════════════

TOP SYSCALLS BY TIME:
┌─────────────────┬──────────┬──────────────┬──────────────┬─────────────────┐
│ Syscall         │ Count    │ Total Time   │ Avg Time     │ % of Total      │
├─────────────────┼──────────┼──────────────┼──────────────┼─────────────────┤
│ read            │ 1,234    │ 2.456 sec    │ 1.99 ms      │ 46.9% ████████  │
│ write           │ 567      │ 1.123 sec    │ 1.98 ms      │ 21.5% ████      │
│ poll            │ 89       │ 0.987 sec    │ 11.09 ms     │ 18.9% ███       │
│ open            │ 45       │ 0.234 sec    │ 5.20 ms      │ 4.5% █          │
│ stat            │ 234      │ 0.156 sec    │ 0.67 ms      │ 3.0%            │
│ mmap            │ 78       │ 0.089 sec    │ 1.14 ms      │ 1.7%            │
│ close           │ 45       │ 0.012 sec    │ 0.27 ms      │ 0.2%            │
└─────────────────┴──────────┴──────────────┴──────────────┴─────────────────┘

SLOWEST INDIVIDUAL CALLS:
┌─────────────────┬──────────────┬────────────────────────────────────────────┐
│ Syscall         │ Time         │ Details                                    │
├─────────────────┼──────────────┼────────────────────────────────────────────┤
│ read(5, ...)    │ 1.234 sec    │ fd=5 → /var/log/bigfile.log (waiting)     │
│ connect(6, ...) │ 0.567 sec    │ → api.example.com:443 (network latency)   │
│ poll([5,6], ...)│ 0.456 sec    │ Waiting for 2 file descriptors            │
└─────────────────┴──────────────┴────────────────────────────────────────────┘

FILE ACCESS PATTERN:
/etc/passwd        → opened 3x, read 892 bytes total
/var/log/app.log   → opened 1x, read 45,678 bytes (streaming)
/tmp/cache.db      → opened 1x, wrote 1,234 bytes

NETWORK ACTIVITY:
api.example.com:443 → connected, 12 sends, 8 receives (HTTP/S traffic)

⚠️  INSIGHT: 47% of time spent in read() - check if I/O is the bottleneck
⚠️  INSIGHT: Long connect() time - network latency issue?

# You now know EXACTLY why your script is slow!
The Core Question You’re Answering
“My program is slow, but I don’t know if it’s CPU-bound, I/O-bound, or waiting on something. How do I find out?”
Before you write any code, sit with this question. strace shows you the kernel’s perspective—every file opened, every byte read, every network connection. The timing reveals where time actually goes.
Concepts You Must Understand First
Stop and research these before coding:
- System Call Basics
- What happens when a program calls
open()? - What’s the difference between user mode and kernel mode?
- Why are syscalls “expensive”?
- Book Reference: “The Linux Programming Interface” Ch. 3
- What happens when a program calls
- strace Output Format
- What does
read(3, "hello", 5) = 5mean? - What does
read(3, 0x7fff..., 1024) = -1 EAGAINmean? - How do you interpret timestamps with
-Tand-t? - Book Reference: strace(1) man page
- What does
- File Descriptors
- What are fd 0, 1, 2?
- How do you map a file descriptor to a filename?
- What’s in
/proc/<pid>/fd/? - Book Reference: “Linux System Programming” Ch. 2
Questions to Guide Your Design
Before implementing, think through these:
- strace Options
- Which flags do you need? (-f for children? -T for timing?)
- How will you handle programs that run for a long time?
- Should you attach to a running process or start a new one?
- Parsing Strategy
- strace output is messy—how will you handle multi-line output?
- How will you extract the syscall name, arguments, return value, and time?
- What about failed syscalls?
- Insight Generation
- What patterns indicate a slow program?
- How do you categorize syscalls (I/O, network, memory)?
- What actionable advice can you give?
Thinking Exercise
Trace a Simple Command
Before coding, explore strace manually:
# Basic trace
$ strace ls 2>&1 | head -20

# With timing
$ strace -T ls 2>&1 | head -20

# With summary
$ strace -c ls 2>&1

# For a running process
$ strace -p $(pgrep nginx) -T 2>&1 | head -20
Questions while exploring:
- What’s the first syscall ls makes?
- How many files does ls open just to list a directory?
- Can you find where it reads the directory entries?
The Interview Questions They’ll Ask
Prepare to answer these:
- “How would you figure out why a process is hanging?”
- “A program works in development but fails in production. How do you debug it?”
- “What’s the difference between strace and ltrace?”
- “Why might strace slow down a program significantly?”
- “How would you use strace to find what config file a program is looking for?”
Hints in Layers
Hint 1: Starting Point
Run strace -c your_command first. This built-in summary is what you’re trying to build (but better).
Hint 2: Parsing
Use strace -T -o output.txt your_command to get timing and save to a file. Parse the file with regex.
Hint 3: File Descriptor Resolution
For each fd you see, check /proc/<pid>/fd/<n> to find the actual filename. You need to do this while the process runs.
Hint 4: Handling Noise Many syscalls are “noise” (mprotect, brk, arch_prctl). Focus on read, write, open, close, connect, poll for practical analysis.
Books That Will Help
| Topic | Book | Chapter |
|---|---|---|
| System calls | “TLPI” by Kerrisk | Ch. 3 |
| File I/O syscalls | “Linux System Programming” by Love | Ch. 2-4 |
| Performance analysis | “Systems Performance” by Gregg | Ch. 5, 13 |
| Network syscalls | “TLPI” by Kerrisk | Ch. 56-61 |
Implementation Hints
Key strace flags:
-f— Follow child processes (essential for multi-process programs)-T— Show time spent in each syscall (the key to profiling!)-t— Timestamp each call-e trace=open,read,write,close— Filter syscalls-o file— Write to file instead of stderr-p PID— Attach to running process
The output format is: syscall(args) = return_value <time>
For file descriptor resolution, read the symlink at /proc/<pid>/fd/<fd> while the process is running.
Learning Milestones:
- You can read raw strace output → You understand syscall semantics
- You can identify slow syscalls → You can profile I/O
- You can map fds to files → You can trace data flow
Project 4: Signal Laboratory
- File: LINUX_SYSTEM_TOOLS_MASTERY.md
- Main Programming Language: C
- Alternative Programming Languages: Rust, Go, Python
- Coolness Level: Level 3: Genuinely Clever
- Business Potential: 1. The “Resume Gold”
- Difficulty: Level 2: Intermediate
- Knowledge Area: Process Control / Signal Handling
- Software or Tool: kill, killall, ps, strace
- Main Book: “The Linux Programming Interface” by Michael Kerrisk
What you’ll build: A set of programs that demonstrate signal handling—a signal sender, a signal receiver with custom handlers, and a process manager that gracefully handles shutdown.
Why it teaches signals: You’ll understand how processes communicate, why Ctrl+C works, how to write programs that clean up properly on termination, and what makes SIGKILL different from SIGTERM.
Core challenges you’ll face:
- Installing signal handlers → maps to understanding signal disposition
- Handling SIGTERM vs SIGKILL → maps to catchable vs uncatchable signals
- Avoiding race conditions in handlers → maps to async-signal safety
- Implementing graceful shutdown → maps to real-world daemon patterns
Key Concepts:
- Signal Fundamentals: “The Linux Programming Interface” Ch. 20-22 — Kerrisk
- Process Control: “Advanced Programming in the UNIX Environment” Ch. 10 — Stevens
- Daemon Patterns: “Linux System Programming” Ch. 6 — Robert Love
Difficulty: Intermediate Time estimate: Weekend Prerequisites: Basic C programming, understanding of process states
Real World Outcome
You’ll have a complete understanding of how signals work, demonstrated through working programs:
Example Output:
# Terminal 1: Run the signal receiver
$ ./signal-receiver
[PID 1234] Signal receiver started. Listening for signals...
[PID 1234] My handlers:
  SIGTERM (15): custom handler (graceful shutdown)
  SIGINT (2): custom handler (interrupt)
  SIGHUP (1): custom handler (reload config)
  SIGKILL (9): CANNOT be caught!
  SIGSTOP (19): CANNOT be caught!

# Terminal 2: Send signals
$ kill -SIGTERM 1234

# Terminal 1 shows:
[PID 1234] Received SIGTERM! Starting graceful shutdown...
[PID 1234] Closing database connections...
[PID 1234] Flushing write buffers...
[PID 1234] Saving state to /tmp/state.json...
[PID 1234] Cleanup complete. Exiting with code 0.

# Process manager demo:
$ ./process-manager
Starting 5 worker processes...
  Worker 1 (PID 2001): Running
  Worker 2 (PID 2002): Running
  Worker 3 (PID 2003): Running
  Worker 4 (PID 2004): Running
  Worker 5 (PID 2005): Running

Press Ctrl+C to initiate graceful shutdown...

^C
[MANAGER] Received SIGINT! Shutting down workers gracefully...
[MANAGER] Sending SIGTERM to all workers...
  Worker 1 (PID 2001): Shutting down... Done.
  Worker 2 (PID 2002): Shutting down... Done.
  Worker 3 (PID 2003): Shutting down... Done.
  Worker 4 (PID 2004): Shutting down... Done.
  Worker 5 (PID 2005): Shutting down... Done.
[MANAGER] All workers stopped. Exiting.

# You now understand exactly how Kubernetes sends SIGTERM before SIGKILL!
The Core Question You’re Answering
“Why can’t I kill this process? What’s the difference between
killandkill -9?”
Before you write any code, sit with this question. Understanding signals is understanding process control—how operating systems manage the lifecycle of programs, how daemons handle restart commands, and why some processes become “unkillable.”
Concepts You Must Understand First
Stop and research these before coding:
- Signal Basics
- What IS a signal? How does it differ from a function call?
- What’s the default action for each signal?
- Which signals can’t be caught or ignored?
- Book Reference: “The Linux Programming Interface” Ch. 20
- Signal Handlers
- What functions are “async-signal-safe”?
- Why is printf() dangerous in a signal handler?
- What’s the difference between signal() and sigaction()?
- Book Reference: “The Linux Programming Interface” Ch. 21
- Signal Delivery
- What happens if a signal arrives while handling another signal?
- What’s signal blocking? What’s the signal mask?
- How do you wait for signals properly?
- Book Reference: “Advanced Programming in the UNIX Environment” Ch. 10
Questions to Guide Your Design
Before implementing, think through these:
- Signal Receiver
- Which signals will you handle?
- What will your handler do? (Remember: must be async-signal-safe!)
- How will you demonstrate the difference between caught and uncaught signals?
- Graceful Shutdown
- What state needs to be saved on shutdown?
- How long should you wait before giving up?
- Should you re-send signals to child processes?
- Process Manager
- How will you track child PIDs?
- What if a child doesn’t respond to SIGTERM?
- How will you avoid zombie processes?
Thinking Exercise
Explore Signal Behavior
Before coding, experiment in the terminal:
# Start a process that ignores SIGTERM
$ python3 -c "import signal, time; signal.signal(signal.SIGTERM, signal.SIG_IGN); print('Ignoring SIGTERM, PID:', __import__('os').getpid()); time.sleep(3600)"

# In another terminal, try to kill it
$ kill <pid>        # Nothing happens!
$ kill -9 <pid>     # Dies immediately

# Trace signals
$ strace -e signal kill -SIGTERM $$
Questions while exploring:
- What syscall does
killuse? - What happens when a signal is blocked vs ignored?
- Can you catch SIGKILL if you try hard enough? (Spoiler: NO)
The Interview Questions They’ll Ask
Prepare to answer these:
- “How would you implement graceful shutdown in a daemon?”
- “Why shouldn’t you call printf() in a signal handler?”
- “A process is stuck and
killdoesn’t work. What do you try next?” - “What’s a zombie process and how do you prevent them?”
- “How does Kubernetes handle container shutdown?”
Hints in Layers
Hint 1: Starting Point Write a simple program that catches SIGINT (Ctrl+C) and prints a message instead of exiting.
Hint 2: Using sigaction
Use sigaction() instead of signal(). It’s more portable and gives you more control.
Hint 3: Async-Signal Safety In your handler, just set a global volatile flag. Do the actual work in main() when you check the flag.
Hint 4: Process Management
Use waitpid() with WNOHANG in a loop after sending signals to collect child exits and avoid zombies.
Books That Will Help
| Topic | Book | Chapter |
|---|---|---|
| Signal fundamentals | “TLPI” by Kerrisk | Ch. 20-22 |
| sigaction details | “APUE” by Stevens | Ch. 10 |
| Process management | “Linux System Programming” by Love | Ch. 5 |
| Daemon patterns | “TLPI” by Kerrisk | Ch. 37 |
Implementation Hints
Async-signal-safe pattern:
volatile sig_atomic_t shutdown_requested = 0;

void handler(int sig) {
    shutdown_requested = 1;  // Safe!
}

int main() {
    // Set up handler with sigaction...
    while (!shutdown_requested) {
        // Do work...
    }
    // Now do cleanup outside the handler
}
For process manager, track children in an array, send SIGTERM, wait with timeout, then SIGKILL stragglers.
Learning Milestones:
- You can catch and handle signals → You understand signal disposition
- You can implement graceful shutdown → You understand real-world patterns
- You can manage child processes → You understand process supervision
Project 5: System Health Monitor
- File: LINUX_SYSTEM_TOOLS_MASTERY.md
- Main Programming Language: Bash
- Alternative Programming Languages: Python, Go, Rust
- Coolness Level: Level 3: Genuinely Clever
- Business Potential: 2. The “Micro-SaaS / Pro Tool”
- Difficulty: Level 1: Beginner
- Knowledge Area: System Monitoring / Metrics
- Software or Tool: uptime, free, vmstat, top, /proc
- Main Book: “How Linux Works” by Brian Ward
What you’ll build: A real-time dashboard that shows CPU load, memory usage, swap activity, and disk I/O—combining data from multiple tools into a unified view with historical trending.
Why it teaches system monitoring: You’ll understand what load average really means, how to interpret memory statistics, what swap usage indicates, and how to identify system bottlenecks.
Core challenges you’ll face:
- Parsing uptime, free, vmstat output → maps to understanding system metrics
- Calculating trends over time → maps to identifying patterns
- Distinguishing normal from abnormal → maps to capacity planning
- Handling different output formats → maps to robust parsing
Key Concepts:
- Load Average: “How Linux Works” Ch. 8 — Brian Ward
- Memory Stats: “Linux System Programming” Ch. 4 — Robert Love
- vmstat Output: “Systems Performance” Ch. 7 — Brendan Gregg
Difficulty: Beginner Time estimate: Weekend Prerequisites: Basic shell scripting, ability to read man pages
Real World Outcome
You’ll have a dashboard that tells you if your system is healthy at a glance:
Example Output:
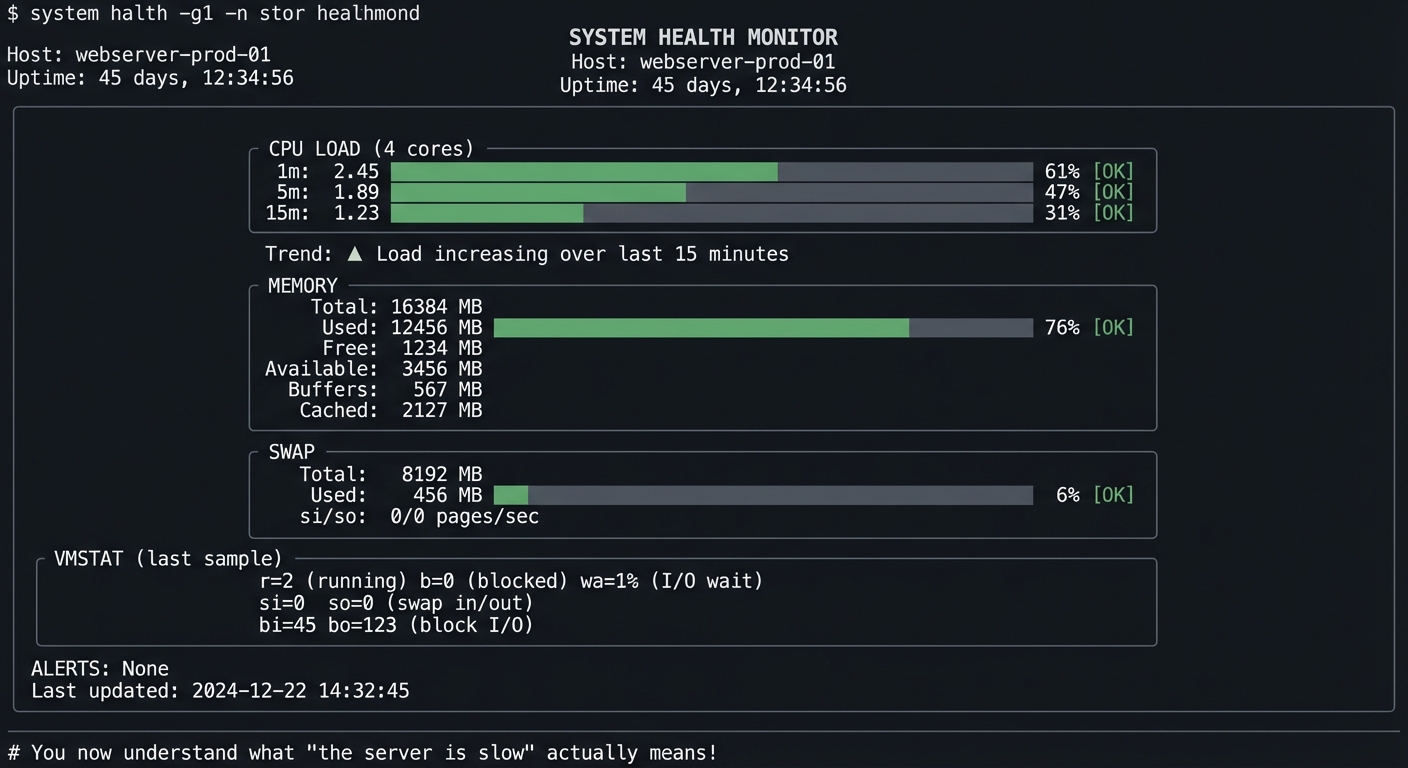
$ ./health-monitor --interval 2

╔═══════════════════════════════════════════════════════════════════════════════╗
║                     SYSTEM HEALTH MONITOR                                     ║
║                     Host: webserver-prod-01                                   ║
║                     Uptime: 45 days, 12:34:56                                 ║
╠═══════════════════════════════════════════════════════════════════════════════╣
║                                                                               ║
║  CPU LOAD (4 cores)                                                           ║
║  ┌───────────────────────────────────────────────────────────────────────┐   ║
║  │ 1m:  2.45 ██████████████████░░░░░░░░░░░░░░░░░░░░ 61% [OK]            │   ║
║  │ 5m:  1.89 ██████████████░░░░░░░░░░░░░░░░░░░░░░░░ 47% [OK]            │   ║
║  │ 15m: 1.23 █████████░░░░░░░░░░░░░░░░░░░░░░░░░░░░░ 31% [OK]            │   ║
║  └───────────────────────────────────────────────────────────────────────┘   ║
║  Trend: ▲ Load increasing over last 15 minutes                               ║
║                                                                               ║
║  MEMORY                                                                       ║
║  ┌───────────────────────────────────────────────────────────────────────┐   ║
║  │ Total:     16384 MB                                                   │   ║
║  │ Used:      12456 MB ████████████████████████████████░░░░ 76% [OK]    │   ║
║  │ Free:       1234 MB                                                   │   ║
║  │ Available:  3456 MB                                                   │   ║
║  │ Buffers:     567 MB                                                   │   ║
║  │ Cached:     2127 MB                                                   │   ║
║  └───────────────────────────────────────────────────────────────────────┘   ║
║                                                                               ║
║  SWAP                                                                         ║
║  ┌───────────────────────────────────────────────────────────────────────┐   ║
║  │ Total:  8192 MB                                                       │   ║
║  │ Used:    456 MB █░░░░░░░░░░░░░░░░░░░░░░░░░░░░░░░░░░░░ 6% [OK]        │   ║
║  │ si/so:   0/0 pages/sec                                                │   ║
║  └───────────────────────────────────────────────────────────────────────┘   ║
║                                                                               ║
║  VMSTAT (last sample)                                                         ║
║  ┌───────────────────────────────────────────────────────────────────────┐   ║
║  │ r=2 (running)  b=0 (blocked)  wa=1% (I/O wait)                       │   ║
║  │ si=0 so=0 (swap in/out)                                               │   ║
║  │ bi=45 bo=123 (block I/O)                                              │   ║
║  └───────────────────────────────────────────────────────────────────────┘   ║
║                                                                               ║
║  ALERTS: None                                                                 ║
║  Last updated: 2024-12-22 14:32:45                                           ║
╚═══════════════════════════════════════════════════════════════════════════════╝

# You now understand what "the server is slow" actually means!
The Core Question You’re Answering
“The server is slow. Is it CPU, memory, disk, or network?”
Before you write any code, sit with this question. This is THE question you’ll be asked in production incidents. This project teaches you to answer it systematically.
Concepts You Must Understand First
Stop and research these before coding:
- Load Average
- What’s the relationship between load and CPU count?
- Why does load include processes in D state?
- What’s “good” load vs “bad” load?
- Book Reference: “How Linux Works” Ch. 8
- Memory Statistics
- What’s the difference between “free” and “available”?
- What are buffers vs cached?
- When should you worry about memory?
- Book Reference: “Linux System Programming” Ch. 4
- vmstat Fields
- What do r, b, si, so, bi, bo mean?
- What’s the difference between si/so and bi/bo?
- How do you spot I/O problems vs CPU problems?
- Book Reference: “Systems Performance” Ch. 7
Questions to Guide Your Design
Before implementing, think through these:
- Data Collection
- How often should you sample?
- What’s the right balance between detail and noise?
- How much history should you keep?
- Thresholds
- What load is “too high” for 4 cores?
- What memory usage triggers a warning?
- When is swap activity concerning?
- Display
- How will you show trends?
- What colors/symbols indicate status?
- How will you handle terminal resize?
Thinking Exercise
Understand the Raw Data
Before coding, run these commands and understand every field:
# Load average
$ uptime
$ cat /proc/loadavg

# Memory (note the difference!)
$ free -m
$ cat /proc/meminfo | head -10

# vmstat (header + 5 samples)
$ vmstat 1 5

# Watch them change
$ watch -n 1 'uptime; echo "---"; free -m; echo "---"; vmstat 1 2 | tail -1'
Questions while exploring:
- Why is “available” different from “free”?
- What happens to si/so when you use swap?
- What’s the relationship between the numbers in
/proc/meminfoandfreeoutput?
The Interview Questions They’ll Ask
Prepare to answer these:
- “The load average is 8.0 on a 4-core machine. Is this a problem?”
- “Free memory shows only 200MB but the system seems fine. Why?”
- “How would you identify if a system is I/O bound?”
- “What’s the first thing you check when someone says ‘the server is slow’?”
- “What does high ‘wa’ in vmstat indicate?”
Hints in Layers
Hint 1: Starting Point
Parse uptime output with awk. The load averages are the last 3 numbers.
Hint 2: Memory Parsing
free -m gives MB values. The “available” column (if present) is what you want for “how much can I actually use?”
Hint 3: vmstat
Run vmstat 1 2 and take the second line (first is since boot, second is current).
Hint 4: Status Indicators Load per core > 1.0 is busy. Memory available < 10% is concerning. Any swap si/so > 0 sustained is a warning.
Books That Will Help
| Topic | Book | Chapter |
|---|---|---|
| Load average | “How Linux Works” by Ward | Ch. 8 |
| Memory stats | “Linux System Programming” by Love | Ch. 4 |
| vmstat deep dive | “Systems Performance” by Gregg | Ch. 7 |
| System monitoring | “The Linux Command Line” by Shotts | Ch. 10 |
Implementation Hints
Key data sources:
/proc/loadavg— Load averages (easier to parse than uptime)/proc/meminfo— Detailed memory statsvmstat 1 2 | tail -1— Current vmstat sample
For thresholds:
- Load: warn if 1-min > 0.7 * num_cpus, alert if > 1.0 * num_cpus
- Memory: warn if available < 15%, alert if < 5%
- Swap: warn if si+so > 0 sustained, alert if growing
Use tput for colors and positioning in bash.
Learning Milestones:
- You can interpret load average → You understand CPU demand
- You can explain memory statistics → You understand memory pressure
- You can read vmstat → You can diagnose system bottlenecks
Project 6: Kernel Log Analyzer
- File: LINUX_SYSTEM_TOOLS_MASTERY.md
- Main Programming Language: Python
- Alternative Programming Languages: Go, Rust, Bash
- Coolness Level: Level 3: Genuinely Clever
- Business Potential: 2. The “Micro-SaaS / Pro Tool”
- Difficulty: Level 2: Intermediate
- Knowledge Area: Kernel Debugging / Log Analysis
- Software or Tool: dmesg, journalctl
- Main Book: “Linux Kernel Development” by Robert Love
What you’ll build: A tool that parses kernel logs (dmesg/journalctl -k), categorizes messages by subsystem (USB, network, disk, memory), detects common error patterns, and alerts on critical issues.
Why it teaches kernel concepts: You’ll learn what the kernel reports, how to identify hardware issues from software ones, how to read OOM killer messages, and how to diagnose boot problems.
Core challenges you’ll face:
- Parsing dmesg timestamp formats → maps to understanding kernel time
- Categorizing by subsystem → maps to kernel architecture
- Detecting error patterns → maps to common failure modes
- Correlating events → maps to cause-and-effect debugging
Key Concepts:
- Kernel Ring Buffer: “Linux Kernel Development” Ch. 18 — Robert Love
- Hardware/Driver Messages: “Linux Device Drivers” Ch. 4 — Corbet
- Systemd Journal: “How Linux Works” Ch. 6 — Brian Ward
Difficulty: Intermediate Time estimate: 1 week Prerequisites: Basic understanding of Linux subsystems, regex skills
Real World Outcome
You’ll have a tool that makes kernel logs understandable:
Example Output:
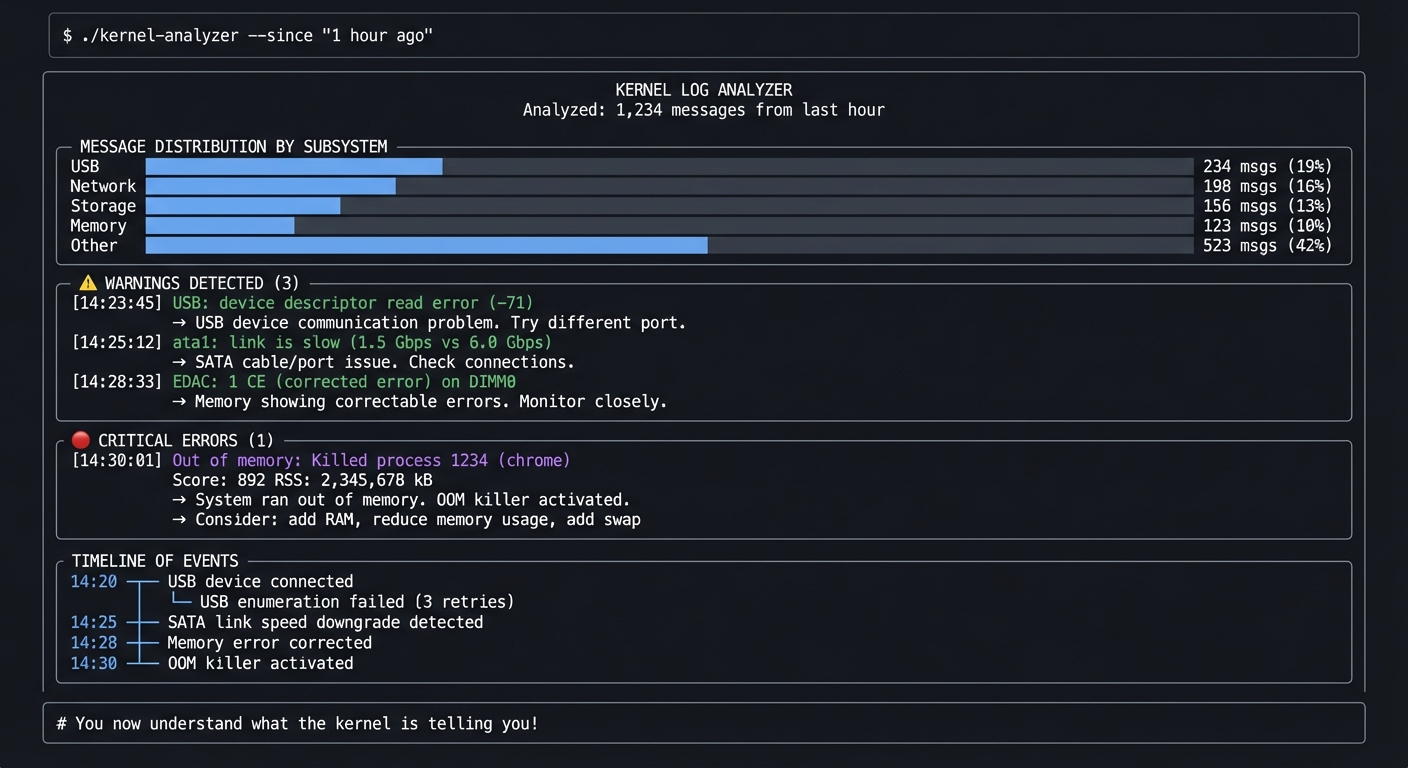
$ ./kernel-analyzer --since "1 hour ago"

╔═══════════════════════════════════════════════════════════════════════════════╗
║                     KERNEL LOG ANALYZER                                       ║
║                     Analyzed: 1,234 messages from last hour                   ║
╠═══════════════════════════════════════════════════════════════════════════════╣
║                                                                               ║
║  MESSAGE DISTRIBUTION BY SUBSYSTEM                                            ║
║  ┌─────────────────────────────────────────────────────────────────────────┐ ║
║  │ USB       ████████████░░░░░░░░░░░░░░░░░░░░░  234 msgs (19%)            │ ║
║  │ Network   ██████████░░░░░░░░░░░░░░░░░░░░░░░  198 msgs (16%)            │ ║
║  │ Storage   ████████░░░░░░░░░░░░░░░░░░░░░░░░░  156 msgs (13%)            │ ║
║  │ Memory    ██████░░░░░░░░░░░░░░░░░░░░░░░░░░░  123 msgs (10%)            │ ║
║  │ Other     ████████████████████░░░░░░░░░░░░░  523 msgs (42%)            │ ║
║  └─────────────────────────────────────────────────────────────────────────┘ ║
║                                                                               ║
║  ⚠️  WARNINGS DETECTED (3)                                                    ║
║  ┌─────────────────────────────────────────────────────────────────────────┐ ║
║  │ [14:23:45] USB: device descriptor read error (-71)                     │ ║
║  │            → USB device communication problem. Try different port.      │ ║
║  │                                                                         │ ║
║  │ [14:25:12] ata1: link is slow (1.5 Gbps vs 6.0 Gbps)                  │ ║
║  │            → SATA cable/port issue. Check connections.                  │ ║
║  │                                                                         │ ║
║  │ [14:28:33] EDAC: 1 CE (corrected error) on DIMM0                       │ ║
║  │            → Memory showing correctable errors. Monitor closely.        │ ║
║  └─────────────────────────────────────────────────────────────────────────┘ ║
║                                                                               ║
║  🔴 CRITICAL ERRORS (1)                                                       ║
║  ┌─────────────────────────────────────────────────────────────────────────┐ ║
║  │ [14:30:01] Out of memory: Killed process 1234 (chrome)                 │ ║
║  │            Score: 892  RSS: 2,345,678 kB                               │ ║
║  │            → System ran out of memory. OOM killer activated.            │ ║
║  │            → Consider: add RAM, reduce memory usage, add swap           │ ║
║  └─────────────────────────────────────────────────────────────────────────┘ ║
║                                                                               ║
║  TIMELINE OF EVENTS                                                           ║
║  14:20 ─┬─ USB device connected                                              ║
║         ├─ USB enumeration failed (3 retries)                                ║
║  14:25 ─┼─ SATA link speed downgrade detected                                ║
║  14:28 ─┼─ Memory error corrected                                            ║
║  14:30 ─┴─ OOM killer activated                                              ║
║                                                                               ║
╚═══════════════════════════════════════════════════════════════════════════════╝

# You now understand what the kernel is telling you!
The Core Question You’re Answering
“Something is wrong with the hardware or drivers. How do I find out what?”
Before you write any code, sit with this question. The kernel sees everything—every USB device connect, every disk error, every network link change, every memory issue. Learning to read its messages is like learning to read X-rays.
Concepts You Must Understand First
Stop and research these before coding:
- Kernel Ring Buffer
- What IS dmesg? Where is this data stored?
- Why is it a “ring” buffer? What happens when it’s full?
- How is it different from regular log files?
- Book Reference: “Linux Kernel Development” Ch. 18
- Kernel Subsystems
- What subsystems generate messages? (USB, PCI, SCSI, etc.)
- How can you identify which subsystem a message is from?
- What’s the significance of the timestamp format?
- Book Reference: “How Linux Works” Ch. 3
- Common Error Patterns
- What does “Out of memory: Killed process” mean?
- What are EDAC messages?
- What does “I/O error” on a block device indicate?
- Book Reference: kernel documentation (Documentation/admin-guide/)
Questions to Guide Your Design
Before implementing, think through these:
- Parsing
- How will you handle different dmesg timestamp formats?
- How will you categorize messages by subsystem?
- How will you detect multi-line messages?
- Pattern Recognition
- What regex patterns identify errors vs warnings vs info?
- How will you build a database of known issues?
- Should you use severity levels from journalctl?
- Presentation
- How will you summarize large amounts of logs?
- How will you highlight the most important issues?
- Should you offer remediation suggestions?
Thinking Exercise
Read Real Kernel Logs
Before coding, explore your system’s kernel messages:
# Recent kernel messages
$ dmesg | tail -50

# Only errors and warnings
$ dmesg --level=err,warn

# With timestamps
$ dmesg -T | tail -20

# Via journalctl
$ journalctl -k --since "1 hour ago"

# Specific subsystem
$ dmesg | grep -i usb
$ dmesg | grep -i ata
$ dmesg | grep -i memory
Questions while exploring:
- Can you identify boot messages vs runtime messages?
- What patterns indicate hardware problems?
- Can you find any error messages on your system?
The Interview Questions They’ll Ask
Prepare to answer these:
- “A server keeps crashing. Where do you look first?”
- “What’s the OOM killer and how does it decide what to kill?”
- “How would you find out if a disk is failing?”
- “What’s the difference between dmesg and /var/log/syslog?”
- “How do you check for hardware errors on a Linux system?”
Hints in Layers
Hint 1: Starting Point
Use dmesg -T to get human-readable timestamps. Parse with regex for timestamp, subsystem, message.
Hint 2: Subsystem Detection
Many messages start with a subsystem identifier: usb 1-1:, ata1:, e1000e:, EDAC MC0:. Build a pattern matcher.
Hint 3: Severity
With journalctl, use journalctl -k -p err for only errors. Map priority levels: 0=emerg, 3=err, 4=warn, 6=info.
Hint 4: Known Patterns Build a dictionary of known error patterns and their explanations. Start with: OOM, I/O error, link down, timeout.
Books That Will Help
| Topic | Book | Chapter |
|---|---|---|
| Kernel logging | “Linux Kernel Development” by Love | Ch. 18 |
| Driver messages | “Linux Device Drivers” by Corbet | Ch. 4 |
| System logs | “How Linux Works” by Ward | Ch. 6, 7 |
| Hardware debugging | “Linux Troubleshooting Bible” | Ch. 3 |
Implementation Hints
Parsing dmesg with timestamps:
[12345.678901] usb 1-1: new high-speed USB device
     ^timestamp  ^subsystem   ^message
Key patterns to detect:
Out of memory:— OOM killer eventI/O error— Disk/storage problemlink is down— Network interface issueerrorin EDAC — Memory problemata.*exception— SATA disk issuetimeout— Hardware not responding
Learning Milestones:
- You can parse and categorize dmesg → You understand kernel logging
- You can identify hardware problems → You can triage issues
- You can explain OOM events → You understand memory management
Project 7: Watch Commander
- File: LINUX_SYSTEM_TOOLS_MASTERY.md
- Main Programming Language: Bash
- Alternative Programming Languages: Python, Go, Rust
- Coolness Level: Level 2: Practical but Forgettable
- Business Potential: 2. The “Micro-SaaS / Pro Tool”
- Difficulty: Level 1: Beginner
- Knowledge Area: Monitoring / Automation
- Software or Tool: watch, bash scripting
- Main Book: “The Linux Command Line” by William Shotts
What you’ll build: An enhanced version of watch that supports multiple commands, conditional alerts, logging, and custom refresh intervals per command.
Why it teaches observation patterns: You’ll understand how periodic monitoring works, how to detect changes over time, and how to automate observation of system state.
Core challenges you’ll face:
- Running commands periodically → maps to understanding timing and loops
- Detecting changes between runs → maps to state comparison
- Alerting on conditions → maps to threshold monitoring
- Managing multiple commands → maps to process coordination
Key Concepts:
- Shell Loops and Timing: “The Linux Command Line” Ch. 29 — Shotts
- Process Substitution: “Bash Cookbook” Ch. 17 — Albing
- Monitoring Patterns: “Effective Shell” Ch. 12 — Kerr
Difficulty: Beginner Time estimate: Weekend Prerequisites: Basic shell scripting
Real World Outcome
You’ll have a powerful multi-command watcher:
Example Output:
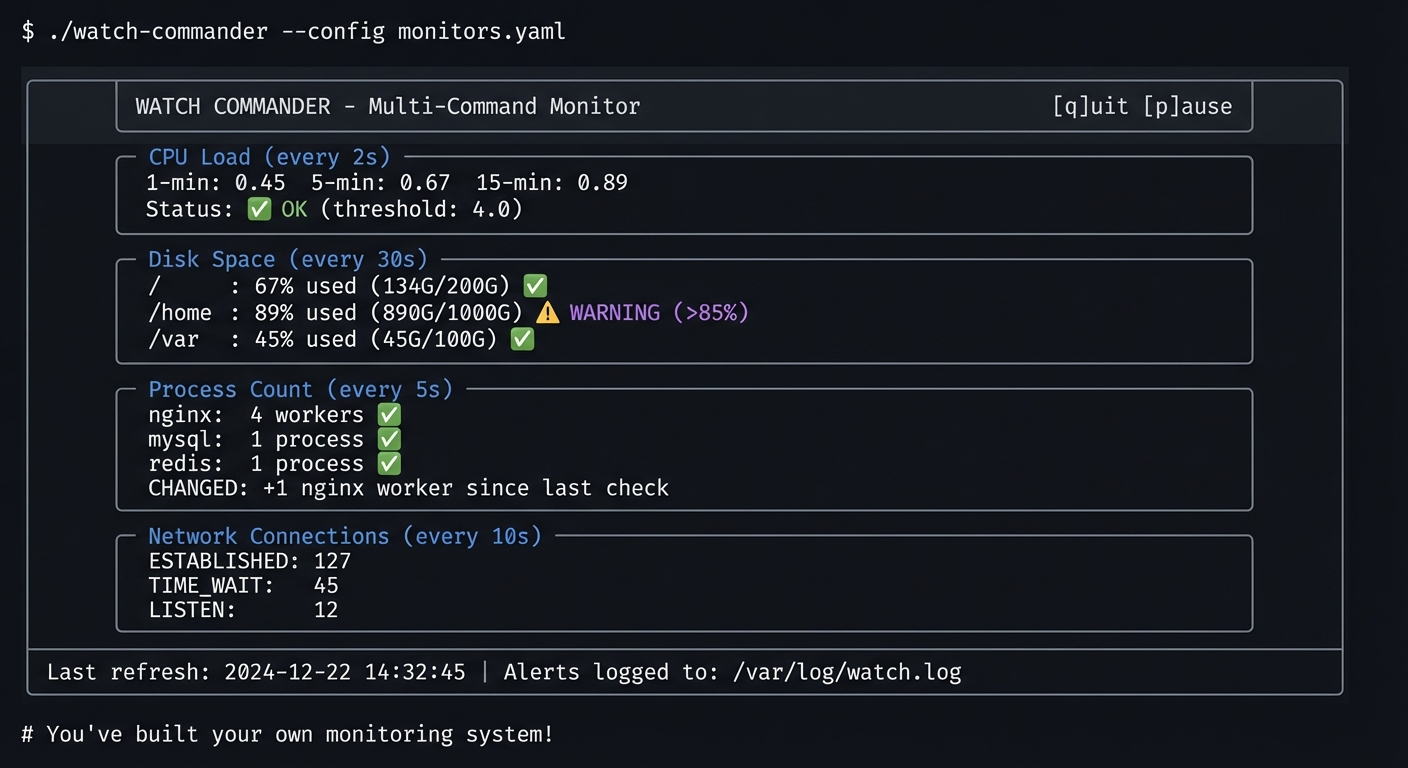
$ ./watch-commander --config monitors.yaml

╔═══════════════════════════════════════════════════════════════════════════════╗
║  WATCH COMMANDER - Multi-Command Monitor                    [q]uit [p]ause   ║
╠═══════════════════════════════════════════════════════════════════════════════╣
║                                                                               ║
║  ┌─ CPU Load (every 2s) ───────────────────────────────────────────────────┐ ║
║  │ 1-min: 0.45  5-min: 0.67  15-min: 0.89                                  │ ║
║  │ Status: ✅ OK (threshold: 4.0)                                           │ ║
║  └─────────────────────────────────────────────────────────────────────────┘ ║
║                                                                               ║
║  ┌─ Disk Space (every 30s) ────────────────────────────────────────────────┐ ║
║  │ /      : 67% used (134G/200G)  ✅                                        │ ║
║  │ /home  : 89% used (890G/1000G) ⚠️  WARNING (>85%)                        │ ║
║  │ /var   : 45% used (45G/100G)   ✅                                        │ ║
║  └─────────────────────────────────────────────────────────────────────────┘ ║
║                                                                               ║
║  ┌─ Process Count (every 5s) ──────────────────────────────────────────────┐ ║
║  │ nginx: 4 workers  ✅                                                     │ ║
║  │ mysql: 1 process  ✅                                                     │ ║
║  │ redis: 1 process  ✅                                                     │ ║
║  │ CHANGED: +1 nginx worker since last check                               │ ║
║  └─────────────────────────────────────────────────────────────────────────┘ ║
║                                                                               ║
║  ┌─ Network Connections (every 10s) ───────────────────────────────────────┐ ║
║  │ ESTABLISHED: 127                                                         │ ║
║  │ TIME_WAIT:   45                                                          │ ║
║  │ LISTEN:      12                                                          │ ║
║  └─────────────────────────────────────────────────────────────────────────┘ ║
║                                                                               ║
║  Last refresh: 2024-12-22 14:32:45  |  Alerts logged to: /var/log/watch.log ║
╚═══════════════════════════════════════════════════════════════════════════════╝

# You've built your own monitoring system!
The Core Question You’re Answering
“I need to watch several things at once, with different refresh rates, and get alerted when something changes.”
Before you write any code, sit with this question. The watch command is limited to one command at one interval. Real monitoring requires watching multiple things with different frequencies.
Concepts You Must Understand First
Stop and research these before coding:
- The watch Command
- How does
watchwork internally? - What do the
-n,-d,-gflags do? - What are watch’s limitations?
- Book Reference: watch(1) man page
- How does
- Shell Timing
- How do you run something every N seconds in bash?
- What’s the difference between sleep and wait?
- How do you run commands in background?
- Book Reference: “The Linux Command Line” Ch. 29
- Change Detection
- How do you compare command output between runs?
- How do you highlight differences?
- How do you avoid false positives?
- Book Reference: diff(1), comm(1) man pages
Questions to Guide Your Design
Before implementing, think through these:
- Timing
- How will you handle different intervals for different commands?
- What if a command takes longer than its interval?
- How will you keep commands synchronized?
- Change Detection
- Will you diff entire output or just specific values?
- How will you extract numbers for threshold comparison?
- What constitutes a “significant” change?
- Alerting
- How will you notify on threshold violations?
- Should you rate-limit alerts?
- Where will you log alerts?
Thinking Exercise
Explore watch Capabilities
Before coding, explore what watch can do:
# Basic watch
$ watch -n 2 'uptime'

# Highlight differences
$ watch -d 'ls -la'

# Exit on change
$ watch -g 'cat /proc/loadavg'

# What you CAN'T do with watch:
# - Multiple commands with different intervals
# - Threshold-based alerting
# - Logging changes over time
Questions while exploring:
- How would you watch disk space AND load at different intervals?
- How would you alert when load exceeds a threshold?
- How would you log all changes for later analysis?
The Interview Questions They’ll Ask
Prepare to answer these:
- “How would you monitor a production system’s health continuously?”
- “What’s the difference between polling and event-driven monitoring?”
- “How would you detect if a process count changed?”
- “What are the tradeoffs of frequent vs infrequent polling?”
- “How would you avoid false alerts from transient spikes?”
Hints in Layers
Hint 1: Starting Point Start with a single command in a while loop with sleep. Store output in a variable.
Hint 2: Multiple Commands Use an array of commands and intervals. Track last-run time for each.
Hint 3: Change Detection Store previous output in a file. Use diff to find changes.
Hint 4: Thresholds Parse numbers from output with grep/awk. Compare with bash arithmetic.
Books That Will Help
| Topic | Book | Chapter |
|---|---|---|
| Bash scripting | “The Linux Command Line” by Shotts | Ch. 24-29 |
| Advanced bash | “Bash Cookbook” by Albing | Ch. 17 |
| Monitoring patterns | “Effective Shell” by Kerr | Ch. 12 |
| Terminal control | “Writing Linux Commands” | Ch. 8 |
Implementation Hints
Basic structure:
while true; do
    for each monitor in monitors:
        if time_since_last_run >= interval:
            output = run_command(monitor.command)
            if output != previous_output:
                log_change()
            if threshold_exceeded(output, monitor.threshold):
                alert()
            previous_output = output
    sleep(1)  # Base tick
Use tput for cursor positioning and colors. Store state in /tmp files.
Learning Milestones:
- You can run commands periodically → You understand timing loops
- You can detect changes → You understand state comparison
- You can alert on thresholds → You understand monitoring logic
Project 8: Process Genealogist
- File: LINUX_SYSTEM_TOOLS_MASTERY.md
- Main Programming Language: Python
- Alternative Programming Languages: Go, Rust, C
- Coolness Level: Level 3: Genuinely Clever
- Business Potential: 1. The “Resume Gold”
- Difficulty: Level 2: Intermediate
- Knowledge Area: Process Relationships / Debugging
- Software or Tool: ps, pstree, /proc
- Main Book: “The Linux Programming Interface” by Michael Kerrisk
What you’ll build: A tool that traces process ancestry—given a PID, shows its entire family tree (parents, children, siblings), who started it, how it was started (the command line), and its resource inheritance.
Why it teaches process relationships: You’ll understand fork/exec, process groups, sessions, controlling terminals, and why orphan processes get adopted by init.
Core challenges you’ll face:
- Building process trees from /proc → maps to understanding PPID
- Tracing ancestry to init → maps to understanding process creation
- Showing inherited resources → maps to understanding fork()
- Handling orphan processes → maps to understanding reparenting
Key Concepts:
- Process Creation: “The Linux Programming Interface” Ch. 24-28 — Kerrisk
- Process Groups and Sessions: “APUE” Ch. 9 — Stevens
- Fork/Exec Model: “Operating Systems: Three Easy Pieces” Ch. 5 — OSTEP
Difficulty: Intermediate Time estimate: 1 week Prerequisites: Project 1 completed, understanding of fork()
Real World Outcome
You’ll have a tool that shows process relationships clearly:
Example Output:
$ ./process-genealogist 1234

╔═══════════════════════════════════════════════════════════════════════════════╗
║                 PROCESS GENEALOGIST - PID 1234                                ║
╠═══════════════════════════════════════════════════════════════════════════════╣
║                                                                               ║
║  IDENTITY                                                                     ║
║  ┌─────────────────────────────────────────────────────────────────────────┐ ║
║  │ PID:      1234                                                          │ ║
║  │ Command:  /usr/bin/python3 /home/user/app/server.py --port 8080        │ ║
║  │ Started:  2024-12-22 10:15:30 (4 hours ago)                            │ ║
║  │ User:     deploy (UID 1001)                                             │ ║
║  │ State:    S (sleeping)                                                  │ ║
║  └─────────────────────────────────────────────────────────────────────────┘ ║
║                                                                               ║
║  ANCESTRY (how this process was created)                                      ║
║  ┌─────────────────────────────────────────────────────────────────────────┐ ║
║  │ systemd (1)                                                             │ ║
║  │   └── sshd (521)                                                        │ ║
║  │         └── sshd (1198) [session for deploy]                           │ ║
║  │               └── bash (1199)                                           │ ║
║  │                     └── python3 (1234) ◄── YOU ARE HERE                │ ║
║  └─────────────────────────────────────────────────────────────────────────┘ ║
║                                                                               ║
║  DESCENDANTS (processes started by this one)                                  ║
║  ┌─────────────────────────────────────────────────────────────────────────┐ ║
║  │ python3 (1234)                                                          │ ║
║  │   ├── python3 (1301) [worker thread]                                   │ ║
║  │   ├── python3 (1302) [worker thread]                                   │ ║
║  │   └── python3 (1303) [worker thread]                                   │ ║
║  │                                                                         │ ║
║  │ Total descendants: 3                                                    │ ║
║  └─────────────────────────────────────────────────────────────────────────┘ ║
║                                                                               ║
║  SESSION & PROCESS GROUP                                                      ║
║  ┌─────────────────────────────────────────────────────────────────────────┐ ║
║  │ Session ID (SID):        1199                                           │ ║
║  │ Session Leader:          bash (1199)                                    │ ║
║  │ Process Group ID (PGID): 1234                                           │ ║
║  │ Process Group Leader:    python3 (1234) ← This process                 │ ║
║  │ Controlling Terminal:    pts/0                                          │ ║
║  │ Foreground PGID:         1234                                           │ ║
║  └─────────────────────────────────────────────────────────────────────────┘ ║
║                                                                               ║
║  INHERITED RESOURCES                                                          ║
║  ┌─────────────────────────────────────────────────────────────────────────┐ ║
║  │ Working Directory: /home/deploy/app                                     │ ║
║  │ Environment: 45 variables (PYTHONPATH, HOME, PATH, ...)                │ ║
║  │ Open Files:                                                             │ ║
║  │   0 → /dev/pts/0 (stdin)                                               │ ║
║  │   1 → /dev/pts/0 (stdout)                                              │ ║
║  │   2 → /dev/pts/0 (stderr)                                              │ ║
║  │   3 → /var/log/app.log                                                 │ ║
║  │   4 → socket:[12345] (0.0.0.0:8080)                                    │ ║
║  └─────────────────────────────────────────────────────────────────────────┘ ║
║                                                                               ║
╚═══════════════════════════════════════════════════════════════════════════════╝

# You now understand exactly how this process got here!
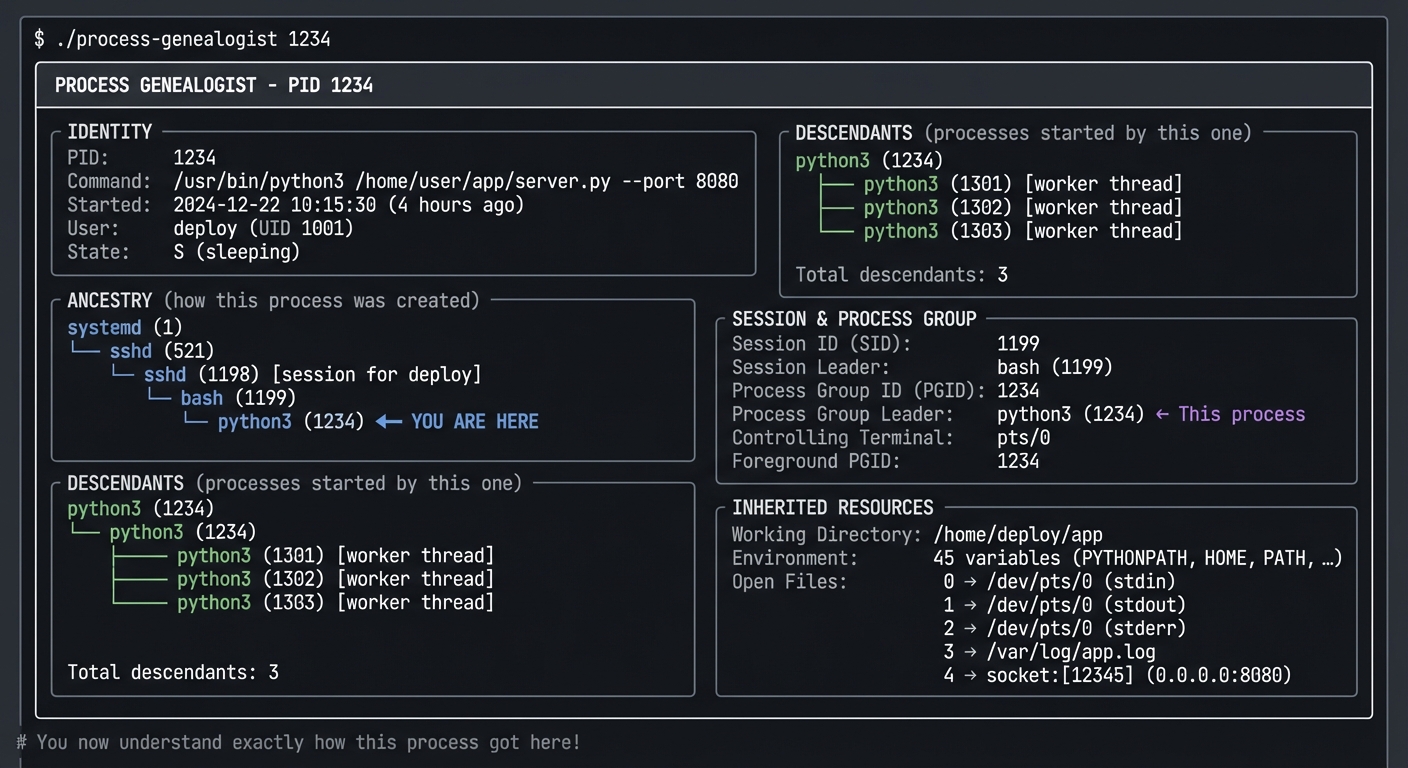
The Core Question You’re Answering
“Where did this process come from? Who started it, and why does it have these file descriptors open?”
Before you write any code, sit with this question. Every process has a parent (except init/systemd). Understanding lineage helps you understand how programs inherit their environment.
Concepts You Must Understand First
Stop and research these before coding:
- fork() and exec()
- What happens when a process calls fork()?
- What’s copied vs shared between parent and child?
- What does exec() replace?
- Book Reference: “TLPI” Ch. 24-27
- Process Groups and Sessions
- What’s a process group? What’s a session?
- What’s a session leader? What’s a controlling terminal?
- What happens when you close a terminal?
- Book Reference: “APUE” Ch. 9
- Orphans and Zombies
- What happens when a parent dies before its children?
- Why do orphans get reparented to init?
- What creates a zombie?
- Book Reference: “TLPI” Ch. 26
Questions to Guide Your Design
Before implementing, think through these:
- Data Collection
- Which /proc files contain ancestry information?
- How do you get the full command line with arguments?
- How do you trace back to init/systemd?
- Tree Building
- How will you construct the tree efficiently?
- How will you handle processes that die while you’re scanning?
- How will you display the tree visually?
- Resource Tracking
- How do you find what files a process has open?
- How do you determine inherited vs opened-by-self?
- How do you show socket information?
Thinking Exercise
Trace a Process Lineage Manually
Before coding, trace a process by hand:
# Find your shell's PID
$ echo $$
1234

# Trace its ancestry
$ cat /proc/1234/status | grep PPid
PPid: 1199

$ cat /proc/1199/comm
sshd

$ cat /proc/1199/status | grep PPid
# Continue until you reach PID 1...

# See the tree with pstree
$ pstree -p $$

# See file descriptors
$ ls -la /proc/$$/fd/
Questions while exploring:
- How many generations until you reach init?
- What processes are in your session?
- What file descriptors did you inherit from bash?
The Interview Questions They’ll Ask
Prepare to answer these:
- “What happens to child processes when the parent dies?”
- “How does fork() work? What’s copied?”
- “Why does closing the terminal kill some processes but not others?”
- “What’s a zombie process and how do you clean it up?”
- “How would you find all processes started by a specific user’s login?”
Hints in Layers
Hint 1: Starting Point
Read PPID from /proc/<pid>/status. Follow the chain until PPID is 0.
Hint 2: Building Tree
Scan all /proc/*/stat files, build a dict of PID→PPID, then construct tree.
Hint 3: Session Info
Session ID is in /proc/<pid>/stat (field 6). Controlling terminal is field 7.
Hint 4: File Descriptors
Read /proc/<pid>/fd/ directory. Each symlink points to the actual file/socket.
Books That Will Help
| Topic | Book | Chapter |
|---|---|---|
| Process creation | “TLPI” by Kerrisk | Ch. 24-28 |
| Sessions and groups | “APUE” by Stevens | Ch. 9 |
| fork() semantics | “OSTEP” | Ch. 5 |
| /proc exploration | “How Linux Works” by Ward | Ch. 8 |
Implementation Hints
Key /proc files:
/proc/<pid>/stat— PPID (field 4), PGRP (field 5), Session (field 6), TTY (field 7)/proc/<pid>/cmdline— Full command line (null-separated)/proc/<pid>/status— Human-readable status/proc/<pid>/fd/— Open file descriptors/proc/<pid>/cwd— Current working directory/proc/<pid>/environ— Environment variables
To find all children, scan all processes and filter by PPID matching target.
Learning Milestones:
- You can trace ancestry → You understand PPID chains
- You can explain sessions → You understand job control
- You can show inherited resources → You understand fork() semantics
Project 9: Zombie Hunter
- File: LINUX_SYSTEM_TOOLS_MASTERY.md
- Main Programming Language: C
- Alternative Programming Languages: Rust, Python, Go
- Coolness Level: Level 4: Hardcore Tech Flex
- Business Potential: 1. The “Resume Gold”
- Difficulty: Level 3: Advanced
- Knowledge Area: Process Lifecycle / Debugging
- Software or Tool: ps, /proc, kill, strace
- Main Book: “The Linux Programming Interface” by Michael Kerrisk
What you’ll build: A suite of programs that creates, detects, and cleans up zombie processes—plus a monitoring tool that alerts when zombies accumulate.
Why it teaches process lifecycle: You’ll understand exactly what happens at process exit, why zombies exist, what they cost, and how to prevent them in your own programs.
Core challenges you’ll face:
- Creating zombies intentionally → maps to understanding wait()
- Detecting zombies in /proc → maps to understanding process states
- Cleaning up zombies → maps to understanding parent responsibility
- Preventing zombies in code → maps to proper process management
Key Concepts:
- Process Termination: “The Linux Programming Interface” Ch. 26 — Kerrisk
- wait() System Calls: “TLPI” Ch. 26.1-26.3 — Kerrisk
- Signal Handling for SIGCHLD: “APUE” Ch. 10 — Stevens
Difficulty: Advanced Time estimate: 1 week Prerequisites: Project 4 (signals), Project 8 (process relationships)
Real World Outcome
You’ll have tools to understand and manage zombies:
Example Output:
# Create a zombie for testing
$ ./zombie-creator
Created child process 1234
Child exited, parent NOT calling wait()
Zombie created! Check with: ps aux | grep Z

# In another terminal:
$ ps aux | grep Z
user     1234  0.0  0.0      0     0 pts/0    Z    14:30   0:00 [zombie-child] <defunct>

# Detect all zombies on system
$ ./zombie-hunter --scan

╔═══════════════════════════════════════════════════════════════════════════════╗
║                     ZOMBIE HUNTER - System Scan                               ║
╠═══════════════════════════════════════════════════════════════════════════════╣
║                                                                               ║
║  ZOMBIES FOUND: 3                                                             ║
║  ┌─────────────────────────────────────────────────────────────────────────┐ ║
║  │ PID    PPID   Parent Process      Zombie Since    Age                   │ ║
║  │ 1234   1200   zombie-creator      14:30:01        5 minutes             │ ║
║  │ 5678   521    buggy-daemon        12:15:30        2 hours               │ ║
║  │ 9012   1      (orphaned)          10:00:00        4 hours               │ ║
║  └─────────────────────────────────────────────────────────────────────────┘ ║
║                                                                               ║
║  PARENT ANALYSIS                                                              ║
║  ┌─────────────────────────────────────────────────────────────────────────┐ ║
║  │ zombie-creator (PID 1200):                                              │ ║
║  │   State: S (sleeping) - NOT handling SIGCHLD                           │ ║
║  │   Fix: Parent needs to call wait() or waitpid()                        │ ║
║  │                                                                         │ ║
║  │ buggy-daemon (PID 521):                                                 │ ║
║  │   State: S (sleeping) - Accumulating zombies (12 total!)              │ ║
║  │   Fix: Investigate daemon's child handling code                        │ ║
║  │                                                                         │ ║
║  │ systemd (PID 1):                                                        │ ║
║  │   State: S (sleeping) - Will reap orphan, just slow                    │ ║
║  │   Info: This zombie was orphaned, init will clean it up               │ ║
║  └─────────────────────────────────────────────────────────────────────────┘ ║
║                                                                               ║
║  RECOMMENDATIONS                                                              ║
║  • Kill parent PID 1200 to have init reap zombie 1234                        ║
║  • Investigate buggy-daemon - it has a child handling bug                    ║
║  • Zombie 9012 will be reaped by init automatically                          ║
║                                                                               ║
╚═══════════════════════════════════════════════════════════════════════════════╝

# You now understand the zombie lifecycle completely!
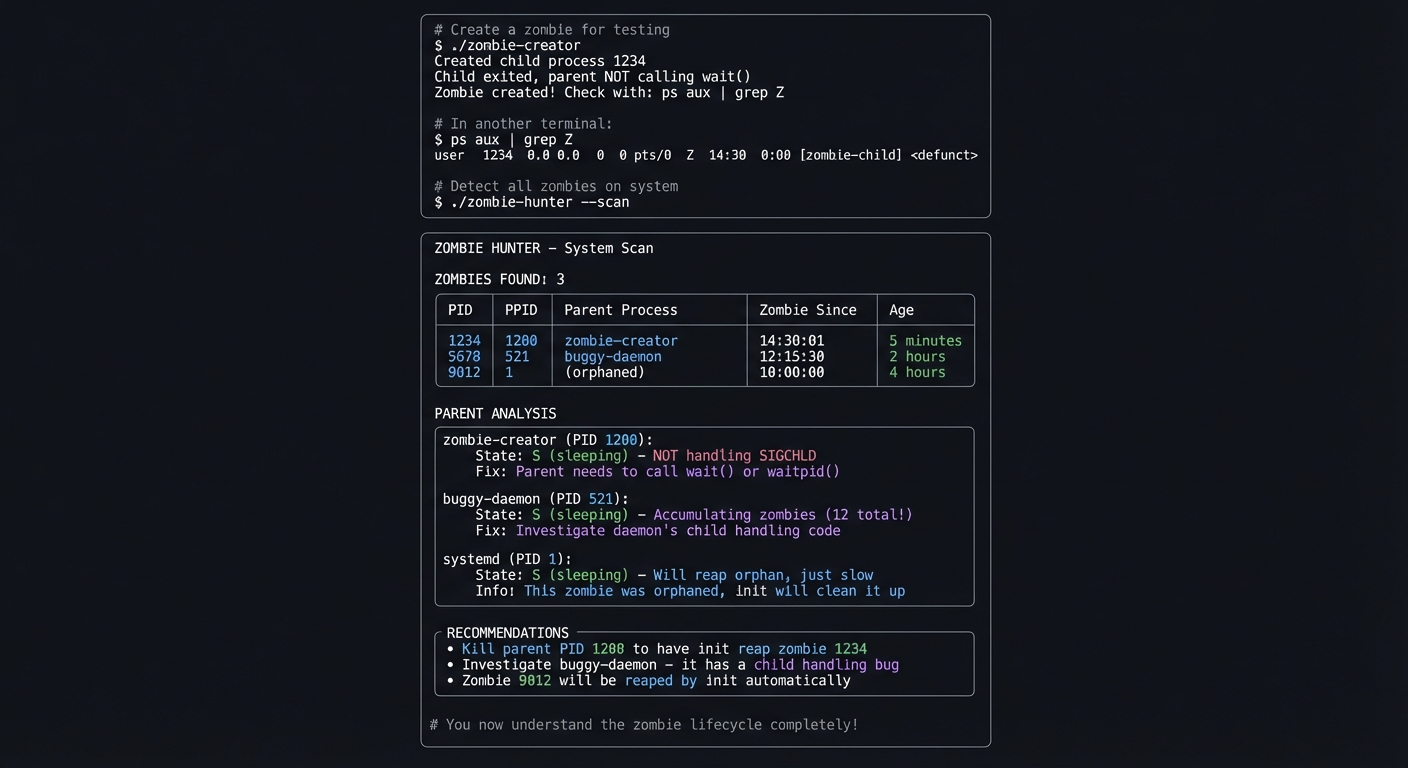
The Core Question You’re Answering
“What IS a zombie process, why do they exist, and why can’t I kill them?”
Before you write any code, sit with this question. A zombie is not a “stuck” process—it’s a dead process whose parent hasn’t collected its exit status. The zombie exists purely to hold that exit status.
Concepts You Must Understand First
Stop and research these before coding:
- Process Exit
- What happens when a process calls exit()?
- What information is preserved for the parent?
- What resources are released immediately vs held?
- Book Reference: “TLPI” Ch. 25
- The wait() Family
- What does wait() do? waitpid()? waitid()?
- What information does the parent receive?
- What happens if parent never calls wait()?
- Book Reference: “TLPI” Ch. 26
- SIGCHLD Signal
- When is SIGCHLD delivered?
- How do you handle it properly?
- What’s the “double-free” problem with SIGCHLD?
- Book Reference: “APUE” Ch. 10
Questions to Guide Your Design
Before implementing, think through these:
- Zombie Creation
- What’s the minimum code to create a zombie?
- How do you prevent the zombie from being reaped?
- How long can a zombie exist?
- Detection
- What field in /proc/*/stat indicates zombie state?
- How do you find the zombie’s parent?
- How do you determine how long it’s been a zombie?
- Cleanup
- Can you directly kill a zombie?
- What options do you have to clean up?
- What happens when you kill the parent?
Thinking Exercise
Create and Observe a Zombie
Before coding, create a zombie manually:
# Create a zombie with bash
$ bash -c 'sleep 1 & exec sleep 100' &
# After 1 second, the background sleep dies but parent (sleep 100) never waits

# Check for it
$ ps aux | grep Z

# Try to kill it
$ kill -9 <zombie_pid>  # Won't work!

# Kill the parent instead
$ kill <parent_pid>  # Zombie disappears
Questions while exploring:
- Why doesn’t kill -9 work on a zombie?
- What state does /proc/
/stat show for a zombie? - What happens to the zombie when you kill the parent?
The Interview Questions They’ll Ask
Prepare to answer these:
- “What is a zombie process and why does it exist?”
- “How do you clean up zombie processes?”
- “Why can’t you kill a zombie process?”
- “How do you prevent zombies in your code?”
- “What’s the relationship between wait() and zombie processes?”
Hints in Layers
Hint 1: Starting Point Create a simple fork() program where the parent sleeps forever and child exits immediately.
Hint 2: Detection
In /proc/<pid>/stat, field 3 is the state. ‘Z’ means zombie.
Hint 3: Parent Analysis Find parent via PPID, check if parent is handling SIGCHLD or calling wait().
Hint 4: Cleanup Strategy Can’t kill zombie directly. Options: (1) make parent call wait(), (2) kill parent so init reaps.
Books That Will Help
| Topic | Book | Chapter |
|---|---|---|
| Process termination | “TLPI” by Kerrisk | Ch. 25-26 |
| wait() family | “TLPI” by Kerrisk | Ch. 26 |
| SIGCHLD handling | “APUE” by Stevens | Ch. 10 |
| Parent-child coordination | “OSTEP” | Ch. 5 |
Implementation Hints
Zombie creator pattern:
pid_t pid = fork();
if (pid == 0) {
    // Child: exit immediately
    exit(0);
}
// Parent: sleep forever, never call wait()
while(1) sleep(1);
Detection: scan /proc/*/stat, check field 3 for ‘Z’.
To clean up without killing parent, you could attach with ptrace and force a wait()—but that’s advanced. Usually just kill the parent.
Learning Milestones:
- You can create zombies → You understand wait() responsibility
- You can detect zombies → You understand process states
- You can prevent zombies → You can write robust process code
Project 10: Performance Snapshot Tool
- File: LINUX_SYSTEM_TOOLS_MASTERY.md
- Main Programming Language: Python
- Alternative Programming Languages: Go, Rust, Bash
- Coolness Level: Level 3: Genuinely Clever
- Business Potential: 3. The “Service & Support” Model
- Difficulty: Level 2: Intermediate
- Knowledge Area: Performance Analysis / Diagnostics
- Software or Tool: top, ps, vmstat, free, uptime, strace
- Main Book: “Systems Performance” by Brendan Gregg
What you’ll build: A tool that captures a complete “snapshot” of system state—all the information a sysadmin would need to diagnose a problem—in one command.
Why it teaches holistic diagnosis: You’ll learn to collect and correlate data from multiple sources, understand what each tool reveals, and build a complete picture of system health.
Core challenges you’ll face:
- Collecting data from multiple tools → maps to understanding tool capabilities
- Correlating information → maps to understanding system relationships
- Formatting for readability → maps to effective communication
- Detecting anomalies → maps to performance baselines
Key Concepts:
- USE Method: “Systems Performance” Ch. 2 — Brendan Gregg
- Resource Analysis: “Systems Performance” Ch. 6-9 — Brendan Gregg
- Anti-Patterns: “Systems Performance” Ch. 2.5 — Brendan Gregg
Difficulty: Intermediate Time estimate: 1 week Prerequisites: Projects 1, 3, 5 completed
Real World Outcome
You’ll have a diagnostic tool that captures everything at once:
Example Output:
$ ./perf-snapshot --output report.txt

Collecting system snapshot...
  ✓ System info
  ✓ CPU and load
  ✓ Memory
  ✓ Disk I/O
  ✓ Network
  ✓ Top processes
  ✓ Recent kernel messages
  ✓ Open files

Snapshot saved to: report.txt (45 KB)

=== QUICK SUMMARY ===
⚠️  HIGH LOAD: 8.5 on 4 cores (212%)
⚠️  MEMORY PRESSURE: 94% used, swap active (500MB)
✅ DISK I/O: Normal
✅ NETWORK: Normal

Top CPU consumers:
  1. python3 (PID 1234): 145% CPU - /home/user/data_processing.py
  2. mysqld (PID 521): 45% CPU

Top memory consumers:
  1. chrome (12 processes): 4.2 GB total
  2. mysqld (PID 521): 1.8 GB

Recent kernel warnings:
  [14:23:45] Out of memory: Killed process 9999 (chrome)

RECOMMENDATION: System under memory pressure. Consider:
  - Reducing chrome tabs
  - Investigating python3 memory usage
  - Adding swap or RAM

# Complete diagnostic in one command!
The Core Question You’re Answering
“Something is wrong, but I don’t know what. How do I quickly capture everything I need to diagnose the issue?”
Before you write any code, sit with this question. In production incidents, you often have limited time. A single command that captures comprehensive system state is invaluable.
Concepts You Must Understand First
Stop and research these before coding:
- The USE Method
- What are Utilization, Saturation, and Errors?
- How do you measure each for CPU, memory, disk, network?
- Why is saturation important but often overlooked?
- Book Reference: “Systems Performance” Ch. 2
- Key Metrics Per Resource
- CPU: load, user%, system%, iowait%
- Memory: used, available, swap activity
- Disk: IOPS, throughput, latency, queue depth
- Network: bandwidth, errors, drops
- Book Reference: “Systems Performance” Ch. 6-9
- Data Correlation
- How do you connect high load to specific processes?
- How do you identify if problem is CPU-bound or I/O-bound?
- What patterns indicate specific problems?
- Book Reference: “Systems Performance” Ch. 2.5
Questions to Guide Your Design
Before implementing, think through these:
- Data Collection
- What commands capture each metric?
- How do you get “right now” vs “over time” data?
- How do you handle permission issues?
- Analysis
- What thresholds indicate problems?
- How do you prioritize findings?
- What correlations are meaningful?
- Output
- How do you make a 45KB report scannable?
- What goes in the summary vs details?
- Should you generate different formats (HTML, JSON)?
Thinking Exercise
Manual System Snapshot
Before coding, collect data manually:
# System info
$ uname -a
$ uptime

# CPU
$ cat /proc/loadavg
$ mpstat 1 3

# Memory
$ free -m
$ cat /proc/meminfo | head -20

# Disk
$ iostat -x 1 3
$ df -h

# Network
$ ss -s
$ cat /proc/net/dev

# Top processes
$ ps aux --sort=-%cpu | head -10
$ ps aux --sort=-%mem | head -10

# Kernel messages
$ dmesg | tail -30
Questions while exploring:
- How long does it take to collect all this manually?
- What patterns do you see in your system right now?
- What would you want automated?
The Interview Questions They’ll Ask
Prepare to answer these:
- “Walk me through how you’d diagnose a slow server.”
- “What information do you collect first when investigating an issue?”
- “How do you distinguish between CPU and I/O bottlenecks?”
- “What’s the USE method?”
- “How would you automate performance data collection?”
Hints in Layers
Hint 1: Starting Point Start with the commands above. Wrap them in a script that collects all output.
Hint 2: Parsing For the summary, parse specific values from each command. Load from /proc/loadavg, memory from free, etc.
Hint 3: Thresholds Define thresholds: load > cores = warn, memory > 90% = warn, swap si/so > 0 = warn.
Hint 4: Top Consumers Use ps aux –sort=-pcpu and –sort=-pmem to find top resource consumers.
Books That Will Help
| Topic | Book | Chapter |
|---|---|---|
| USE method | “Systems Performance” by Gregg | Ch. 2 |
| CPU analysis | “Systems Performance” by Gregg | Ch. 6 |
| Memory analysis | “Systems Performance” by Gregg | Ch. 7 |
| Disk analysis | “Systems Performance” by Gregg | Ch. 9 |
Implementation Hints
Key data sources:
/proc/loadavg— load averages/proc/meminfo— memory details/proc/stat— CPU times/proc/diskstats— disk I/O/proc/net/dev— network statsps aux— process listdmesg | tail— recent kernel messages
Structure output as:
- Quick summary with icons (✅/⚠️/🔴)
- Detailed sections per resource
- Top consumers per resource
- Recommendations based on findings
Learning Milestones:
- You collect comprehensive data → You understand system metrics
- You identify problems from data → You understand diagnosis
- You provide actionable recommendations → You understand remediation
Project 11: Process Debugging Toolkit
- File: LINUX_SYSTEM_TOOLS_MASTERY.md
- Main Programming Language: Bash/Python
- Alternative Programming Languages: Go, Rust
- Coolness Level: Level 4: Hardcore Tech Flex
- Business Potential: 3. The “Service & Support” Model
- Difficulty: Level 3: Advanced
- Knowledge Area: Debugging / Troubleshooting
- Software or Tool: strace, pmap, /proc, lsof
- Main Book: “The Linux Programming Interface” by Michael Kerrisk
What you’ll build: A comprehensive debugging toolkit that, given a PID, provides complete analysis: what the process is doing (strace), what files it has open, what network connections it has, its memory usage, and its recent activity.
Why it teaches debugging: You’ll combine all the tools into a coherent debugging workflow, understanding how each piece of information contributes to the full picture.
Core challenges you’ll face:
- Integrating multiple data sources → maps to holistic debugging
- Live vs snapshot analysis → maps to timing considerations
- Non-intrusive observation → maps to production debugging
- Correlating events → maps to root cause analysis
Key Concepts:
- Live Debugging: “Linux System Programming” Ch. 10 — Robert Love
- File Descriptor Analysis: “TLPI” Ch. 5 — Kerrisk
- Network Debugging: “TCP/IP Illustrated” Vol. 1 — Stevens
Difficulty: Advanced Time estimate: 2 weeks Prerequisites: Projects 1-3 completed, comfortable with all tools
Real World Outcome
Example Output:
$ ./debug-process 1234

╔═══════════════════════════════════════════════════════════════════════════════╗
║                PROCESS DEBUG REPORT - PID 1234                                ║
║                Generated: 2024-12-22 14:32:45                                 ║
╠═══════════════════════════════════════════════════════════════════════════════╣
║ Command: python3 /home/user/app/server.py --port 8080                        ║
║ User: deploy (UID 1001)  |  State: S (sleeping)  |  Running for: 4h 23m      ║
╠═══════════════════════════════════════════════════════════════════════════════╣
║                                                                               ║
║ WHAT IT'S DOING RIGHT NOW (5 second strace sample):                          ║
║ ┌─────────────────────────────────────────────────────────────────────────┐  ║
║ │ epoll_wait(5, ...) = 1                    (waiting for events)          │  ║
║ │ accept4(4, ...) = 7                       (accepting connection)        │  ║
║ │ read(7, "GET /api/data HTTP/1.1\r\n", 8192) = 234                      │  ║
║ │ write(7, "HTTP/1.1 200 OK\r\n...", 1234) = 1234                        │  ║
║ │ close(7) = 0                              (closed connection)           │  ║
║ │                                                                         │  ║
║ │ Summary: HTTP server accepting and handling requests normally           │  ║
║ └─────────────────────────────────────────────────────────────────────────┘  ║
║                                                                               ║
║ OPEN FILES:                                                                   ║
║ ┌─────────────────────────────────────────────────────────────────────────┐  ║
║ │ fd   Type      Description                                              │  ║
║ │ 0    CHR       /dev/null (stdin)                                        │  ║
║ │ 1    REG       /var/log/app/stdout.log (8.2 MB)                        │  ║
║ │ 2    REG       /var/log/app/stderr.log (124 KB)                        │  ║
║ │ 3    REG       /var/lib/app/database.db (45 MB, read)                  │  ║
║ │ 4    IPv4      *:8080 (LISTEN)                                          │  ║
║ │ 5    EPOLL     epoll instance                                           │  ║
║ └─────────────────────────────────────────────────────────────────────────┘  ║
║                                                                               ║
║ NETWORK CONNECTIONS:                                                          ║
║ ┌─────────────────────────────────────────────────────────────────────────┐  ║
║ │ LISTEN    *:8080                              (main server socket)      │  ║
║ │ ESTABLISHED  10.0.0.15:54321 → *:8080        (active request)          │  ║
║ │ TIME_WAIT    192.168.1.50:45678 → *:8080     (recent request)          │  ║
║ └─────────────────────────────────────────────────────────────────────────┘  ║
║                                                                               ║
║ MEMORY USAGE:                                                                 ║
║ ┌─────────────────────────────────────────────────────────────────────────┐  ║
║ │ RSS: 156 MB  |  VSZ: 892 MB  |  Heap: 45 MB  |  Stack: 132 KB          │  ║
║ │ Shared: 89 MB (libc, libpython, libssl)                                │  ║
║ │ Memory trend: Stable (no growth in last hour)                          │  ║
║ └─────────────────────────────────────────────────────────────────────────┘  ║
║                                                                               ║
║ DIAGNOSIS: Process appears healthy. HTTP server operating normally.          ║
╚═══════════════════════════════════════════════════════════════════════════════╝
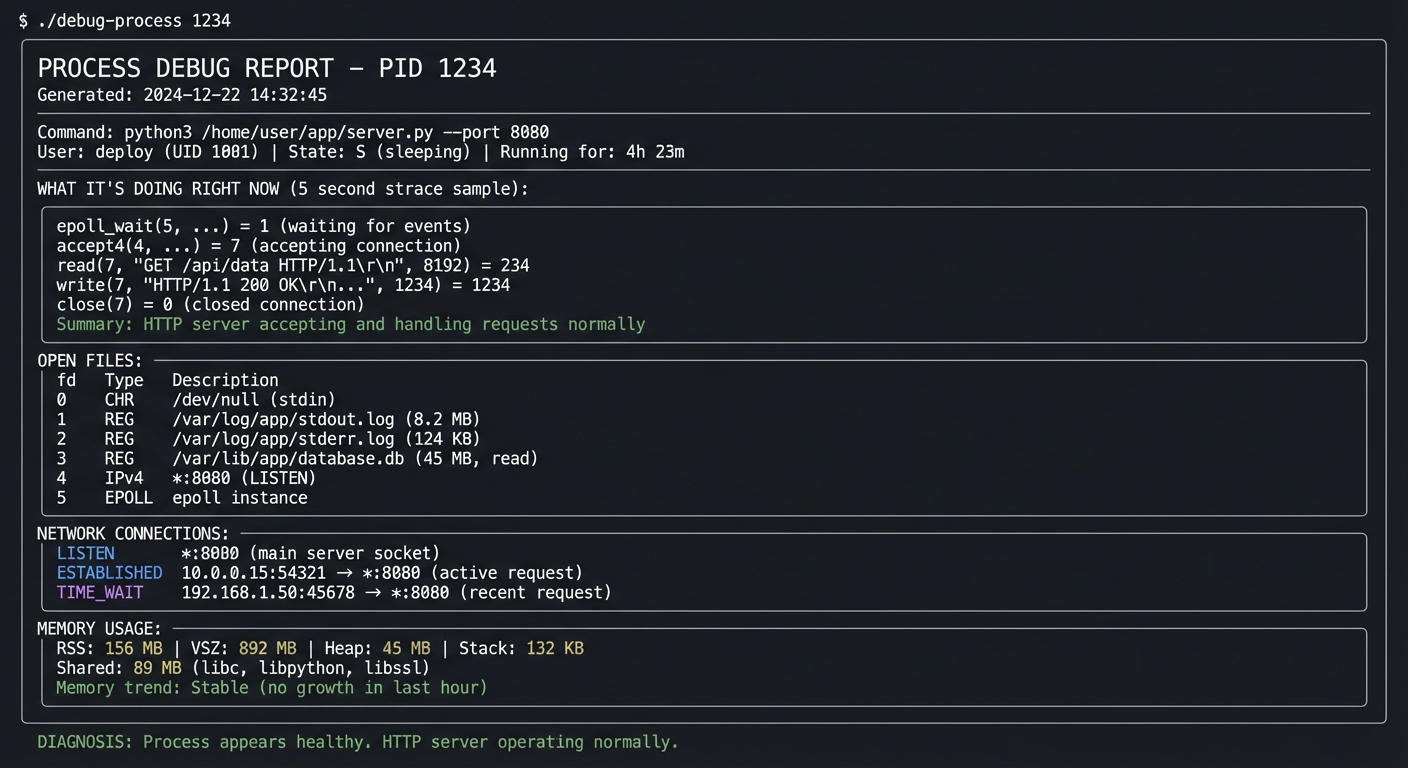
Learning Milestones:
- You can combine tools effectively → You understand debugging workflow
- You can interpret live behavior → You understand runtime analysis
- You can diagnose process issues → You are a systems debugger
Project 12: Service Watchdog
- File: LINUX_SYSTEM_TOOLS_MASTERY.md
- Main Programming Language: Go
- Alternative Programming Languages: Rust, Python, C
- Coolness Level: Level 3: Genuinely Clever
- Business Potential: 4. The “Open Core” Infrastructure
- Difficulty: Level 3: Advanced
- Knowledge Area: Process Supervision / Monitoring
- Software or Tool: All tools covered
- Main Book: “Linux System Programming” by Robert Love
What you’ll build: A process supervisor that monitors specified processes, restarts them if they crash, handles graceful shutdown with SIGTERM→SIGKILL escalation, logs events, and provides health metrics.
Why it teaches supervision: You’ll implement what systemd, supervisord, and Docker do—understanding the complete lifecycle of process management.
Core challenges you’ll face:
- Monitoring process health → maps to understanding when to restart
- Signal escalation → maps to graceful vs forced termination
- Avoiding zombies → maps to proper wait() handling
- Health checks → maps to beyond just “is it running?”
Key Concepts:
- Daemon Management: “TLPI” Ch. 37 — Kerrisk
- Process Groups: “APUE” Ch. 9 — Stevens
- Signal Escalation: Kubernetes graceful termination patterns
Difficulty: Advanced Time estimate: 2-3 weeks Prerequisites: All previous projects
Real World Outcome
Example Output:
$ ./watchdog --config services.yaml

╔═══════════════════════════════════════════════════════════════════════════════╗
║                     SERVICE WATCHDOG                                          ║
║                     Uptime: 45 days, 12:34:56                                 ║
╠═══════════════════════════════════════════════════════════════════════════════╣
║                                                                               ║
║  SERVICE STATUS                                                               ║
║  ┌─────────────────────────────────────────────────────────────────────────┐ ║
║  │ Service          PID     Status    Uptime      Restarts  Health         │ ║
║  │ web-server       1234    ✅ UP     45d 12h     0         ✅ Healthy     │ ║
║  │ api-backend      1235    ✅ UP     45d 12h     2         ✅ Healthy     │ ║
║  │ worker           1236    ✅ UP     12h 5m      0         ✅ Healthy     │ ║
║  │ scheduler        --      🔴 DOWN   --          5         ❌ Failed      │ ║
║  └─────────────────────────────────────────────────────────────────────────┘ ║
║                                                                               ║
║  RECENT EVENTS                                                                ║
║  ┌─────────────────────────────────────────────────────────────────────────┐ ║
║  │ 14:30:01  scheduler (PID 9999) exited with code 1                      │ ║
║  │ 14:30:05  scheduler restarting (attempt 6/5 - giving up)              │ ║
║  │ 14:30:05  scheduler marked as FAILED after 5 restart attempts         │ ║
║  │ 12:00:00  worker gracefully restarted for daily maintenance           │ ║
║  └─────────────────────────────────────────────────────────────────────────┘ ║
║                                                                               ║
╚═══════════════════════════════════════════════════════════════════════════════╝

# You've built your own process supervisor!
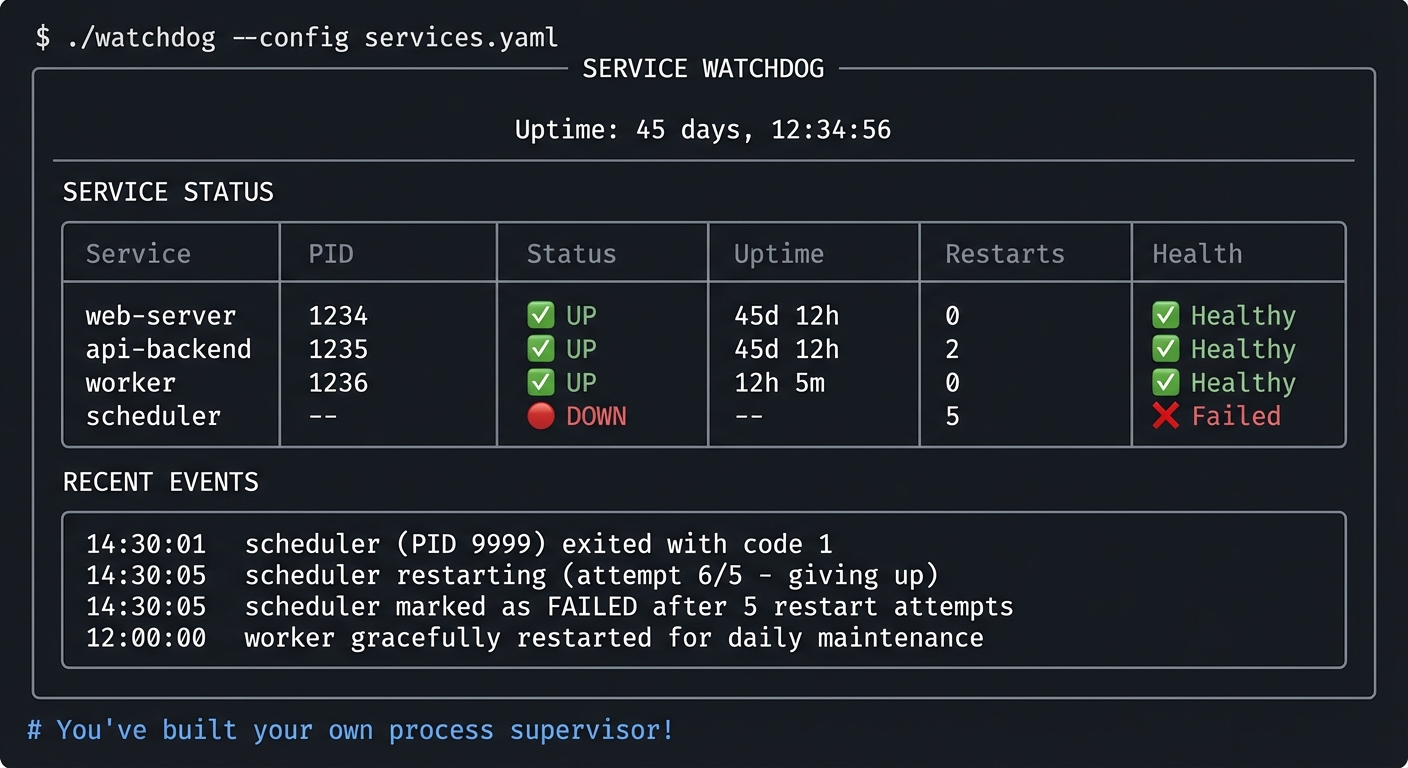
Learning Milestones:
- You can supervise processes → You understand the init system
- You can handle all exit scenarios → You understand process lifecycle
- You can implement health checks → You understand production operations
Project Comparison Table
| Project | Difficulty | Time | Depth of Understanding | Fun Factor | Tools Used |
|---|---|---|---|---|---|
| 1. Process Explorer | Beginner | Weekend | ⭐⭐⭐ | ⭐⭐⭐ | ps, top, /proc |
| 2. Memory Leak Detective | Advanced | 1-2 weeks | ⭐⭐⭐⭐⭐ | ⭐⭐⭐⭐ | pmap, free, vmstat |
| 3. Syscall Profiler | Intermediate | 1 week | ⭐⭐⭐⭐⭐ | ⭐⭐⭐⭐ | strace |
| 4. Signal Laboratory | Intermediate | Weekend | ⭐⭐⭐⭐ | ⭐⭐⭐ | kill, killall |
| 5. System Health Monitor | Beginner | Weekend | ⭐⭐⭐ | ⭐⭐⭐ | uptime, free, vmstat |
| 6. Kernel Log Analyzer | Intermediate | 1 week | ⭐⭐⭐⭐ | ⭐⭐⭐ | dmesg, journalctl |
| 7. Watch Commander | Beginner | Weekend | ⭐⭐ | ⭐⭐⭐ | watch |
| 8. Process Genealogist | Intermediate | 1 week | ⭐⭐⭐⭐⭐ | ⭐⭐⭐⭐ | ps, pstree, /proc |
| 9. Zombie Hunter | Advanced | 1 week | ⭐⭐⭐⭐⭐ | ⭐⭐⭐⭐⭐ | ps, kill |
| 10. Performance Snapshot | Intermediate | 1 week | ⭐⭐⭐⭐ | ⭐⭐⭐ | All tools |
| 11. Debug Toolkit | Advanced | 2 weeks | ⭐⭐⭐⭐⭐ | ⭐⭐⭐⭐ | All tools |
| 12. Service Watchdog | Advanced | 2-3 weeks | ⭐⭐⭐⭐⭐ | ⭐⭐⭐⭐⭐ | All tools |
Recommendation
For Beginners (little Linux experience):
Start with these projects in order:
- Project 1: Process Explorer — Learn /proc basics
- Project 5: System Health Monitor — Understand metrics
- Project 7: Watch Commander — Build monitoring intuition
- Project 4: Signal Laboratory — Understand process control
For Intermediate (comfortable with Linux):
Jump to:
- Project 3: Syscall Profiler — Deep strace understanding
- Project 8: Process Genealogist — Process relationships
- Project 6: Kernel Log Analyzer — Kernel communication
- Project 2: Memory Leak Detective — Memory mastery
For Advanced (want to master systems):
Focus on:
- Project 9: Zombie Hunter — Process lifecycle expertise
- Project 11: Debug Toolkit — Comprehensive debugging
- Project 12: Service Watchdog — Build a real supervisor
Final Overall Project: Mini-htop Clone
- File: LINUX_SYSTEM_TOOLS_MASTERY.md
- Main Programming Language: C
- Alternative Programming Languages: Rust, Go
- Coolness Level: Level 5: Pure Magic (Super Cool)
- Business Potential: 4. The “Open Core” Infrastructure
- Difficulty: Level 4: Expert
- Knowledge Area: Complete System Mastery
- Software or Tool: All 12 tools mastered
- Main Book: “The Linux Programming Interface” by Michael Kerrisk
What you’ll build: A fully-featured process monitor like htop—interactive terminal UI, process tree view, sorting by CPU/memory, sending signals, filtering, and real-time updates.
Why this is the capstone: This project requires EVERYTHING you’ve learned:
- Reading /proc for all process data
- Calculating CPU percentages from jiffies
- Understanding memory statistics
- Sending signals to processes
- Building process trees
- Understanding process states
- Terminal UI programming
Real World Outcome:
╔════════════════════════════════════════════════════════════════════════════════╗
║ mini-htop                              Uptime: 45d 12:34:56    Load: 2.45 1.89 ║
╠════════════════════════════════════════════════════════════════════════════════╣
║ Tasks: 234 total, 2 running, 232 sleeping, 0 stopped, 0 zombie                 ║
║ CPU: ████████████░░░░░░░░░░░░░░░░░░░░░░░░░░░░ 28.5%                           ║
║ Mem: ██████████████████████████░░░░░░░░░░░░░░ 65.2% (10.5G/16.0G)             ║
║ Swap: █░░░░░░░░░░░░░░░░░░░░░░░░░░░░░░░░░░░░░░ 2.3% (189M/8.0G)                ║
╠════════════════════════════════════════════════════════════════════════════════╣
║  PID USER      PRI  NI  VIRT   RES   SHR S CPU% MEM%   TIME+  Command         ║
╠════════════════════════════════════════════════════════════════════════════════╣
║ 1234 user       20   0 1.2G  156M   89M S 45.2  1.0  12:34.56 python3 server  ║
║  521 mysql      20   0 2.4G  1.8G  45M S 23.1 11.2  45:12.34 mysqld          ║
║  622 www-data   20   0 450M   78M  34M S  5.6  0.5   1:23.45 nginx: worker   ║
║  723 root       20   0  45M   12M   8M S  0.3  0.1   0:45.12 sshd            ║
╠════════════════════════════════════════════════════════════════════════════════╣
║ F1Help F2Setup F3Search F4Filter F5Tree F6SortBy F9Kill F10Quit              ║
╚════════════════════════════════════════════════════════════════════════════════╝
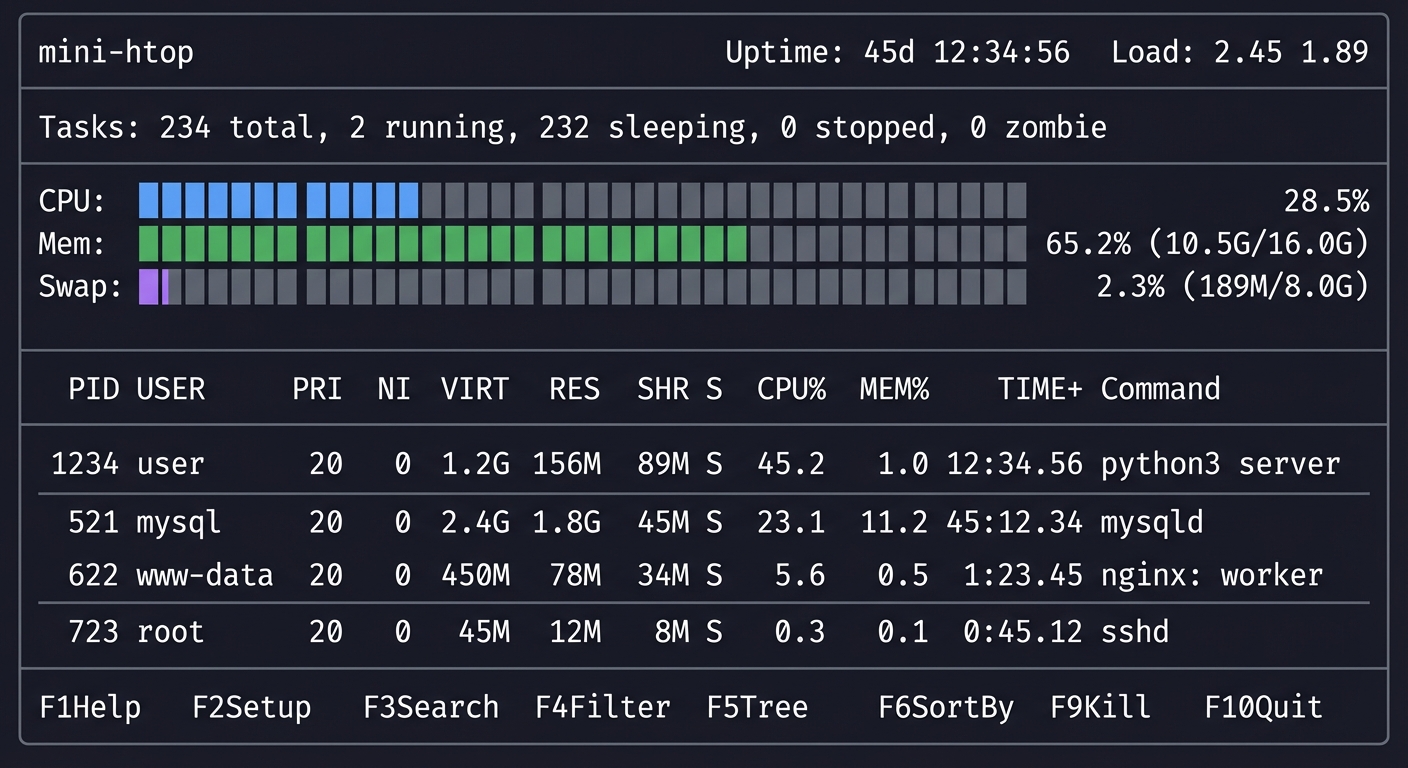
Core challenges:
- Reading and parsing /proc efficiently
- Calculating CPU% from two samples
- Building interactive terminal UI
- Handling terminal resize
- Implementing process tree view
- Sending signals interactively
Prerequisites: All 12 projects completed
Time estimate: 1-2 months
This is your graduation project. When you can build this, you truly understand Linux processes.
Summary
This learning path covers Linux system tools through 12 hands-on projects plus a capstone. Here’s the complete list:
| # | Project Name | Main Language | Difficulty | Time Estimate |
|---|---|---|---|---|
| 1 | Process Explorer Dashboard | Bash | Beginner | Weekend |
| 2 | Memory Leak Detective | C | Advanced | 1-2 weeks |
| 3 | Syscall Profiler | Python | Intermediate | 1 week |
| 4 | Signal Laboratory | C | Intermediate | Weekend |
| 5 | System Health Monitor | Bash | Beginner | Weekend |
| 6 | Kernel Log Analyzer | Python | Intermediate | 1 week |
| 7 | Watch Commander | Bash | Beginner | Weekend |
| 8 | Process Genealogist | Python | Intermediate | 1 week |
| 9 | Zombie Hunter | C | Advanced | 1 week |
| 10 | Performance Snapshot Tool | Python | Intermediate | 1 week |
| 11 | Process Debugging Toolkit | Bash/Python | Advanced | 2 weeks |
| 12 | Service Watchdog | Go | Advanced | 2-3 weeks |
| Final | Mini-htop Clone | C | Expert | 1-2 months |
Tools Covered
- strace: System call tracing
- top: Real-time process monitoring
- ps: Process snapshots
- free: Memory statistics
- uptime: System load
- watch: Periodic command execution
- kill/killall: Process signaling
- pmap: Process memory maps
- vmstat: Virtual memory statistics
- dmesg: Kernel ring buffer
- journalctl: Systemd journal
Recommended Learning Path
For beginners: Start with projects #1, #5, #7, #4
For intermediate: Jump to projects #3, #8, #6, #2
For advanced: Focus on projects #9, #11, #12, Final
Expected Outcomes
After completing these projects, you will:
- Read /proc like a book — Every process’s secrets are exposed there
- Understand system calls — See the kernel API in action
- Debug any process — Know exactly what it’s doing and why
- Diagnose performance issues — Identify CPU, memory, I/O bottlenecks
- Manage processes professionally — Signals, supervision, lifecycle
- Read kernel messages — Understand hardware and driver events
- Monitor systems effectively — Build your own tools
- Answer any interview question — About Linux processes and systems
You’ll have built 12+ working tools that demonstrate deep understanding of Linux systems from first principles.
Sources
The following resources were used in creating this learning path: