Learn LLDB: From Zero to Debugging Master
Goal: Build a precise, repeatable debugging workflow with LLDB that works for crashes, hangs, and data corruption. You will understand how LLDB models a program (target -> process -> thread -> frame), how it uses DWARF debug info to map source to machine code, and how to extract evidence from stack frames, registers, and memory. You will also learn to extend LLDB with Python so you can automate analyses and teach the debugger to understand your own data structures. By the end, you can debug real systems under pressure, not just toy examples.
Introduction
LLDB is the debugger built for the LLVM/Clang toolchain. It is fast, scriptable, and deeply integrated with modern C/C++/ObjC/Swift toolchains. Debugging is not just about “finding a bug” - it is about building evidence from a running program and turning that evidence into a fixable hypothesis.
In this guide you will build a series of C programs that intentionally crash, hang, or corrupt memory. You will learn how to attach, pause, inspect, and automate debugging sessions in LLDB, and you will finish by building a custom Python data formatter that makes complex structures readable.
Scope: The examples assume C on macOS or Linux with clang/LLVM installed. The same concepts apply to C++ and Objective-C. You can adapt almost all of this to Swift by using Swift-friendly formatters and Xcode integration.
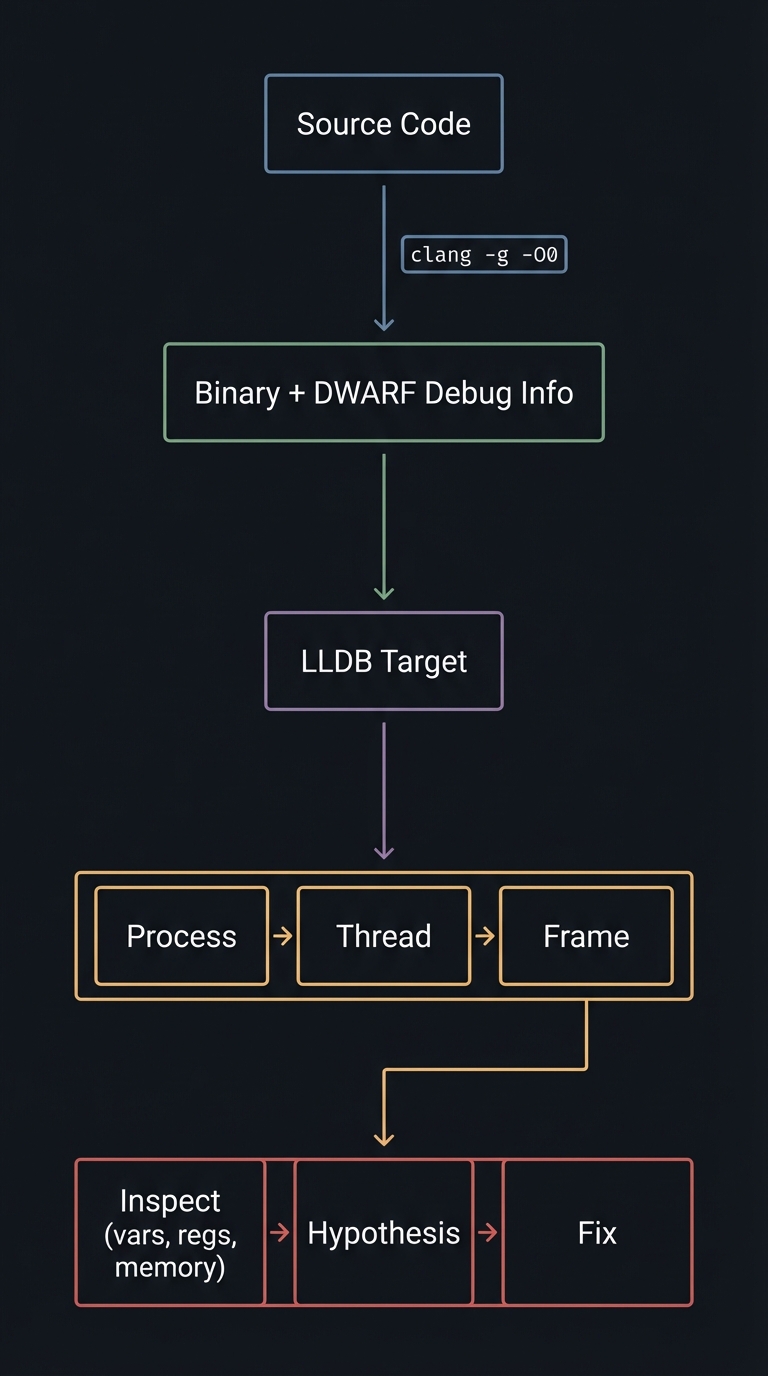
Big picture diagram (what you are about to master):
Source Code
   |
   |  clang -g -O0
   v
Binary + DWARF Debug Info
   |
   v
LLDB Target
   |
   v
Process -> Thread -> Frame
   |
   v
Inspect (vars, regs, memory) -> Hypothesis -> Fix
How to Use This Guide
- Read the Theory Primer first. It is the mini-book that gives you the mental model you will need while debugging.
- Build each project. Every project is a deliberate bug with a targeted LLDB skill.
- Write your own debugging log. After each project, write a short note of what you observed, the hypothesis you formed, and what proved it.
- Automate what you repeat. If you typed the same commands twice, you should consider a stop-hook or Python command.
Prerequisites & Background Knowledge
1) Essential Prerequisites (Must Have)
- Comfort with C syntax (functions, pointers, structs).
- Basic command-line usage (compiling, running, navigating files).
- Mental model of stack vs heap memory.
2) Helpful But Not Required
- Familiarity with assembly or calling conventions.
- Understanding of ELF/Mach-O binaries.
- Basic Python scripting.
3) Self-Assessment Questions
- Can you explain what a stack frame is without looking it up?
- Do you understand what a segmentation fault means at the CPU level?
- Can you compile with debug symbols and explain why
-gmatters? - Have you ever attached a debugger to a running process?
4) Development Environment Setup
- macOS: Xcode Command Line Tools (includes LLDB).
- Linux:
lldb,clang,llvmpackages from your distro. - Compile with:
clang -g -O0 -Wall -Wextra -o target target.c - Optional: enable core dumps:
ulimit -c unlimited
5) Time Investment
- Projects 1-2: 1-2 hours each.
- Projects 3-4: 2-3 hours each.
- Projects 5-6: 1-2 weeks total (Python scripting + custom formatter).
6) Important Reality Check
Debugging is a skill you build through repetition. You will feel slow at first. That is normal. The goal is to build a repeatable workflow that scales to real systems, not to memorize commands.
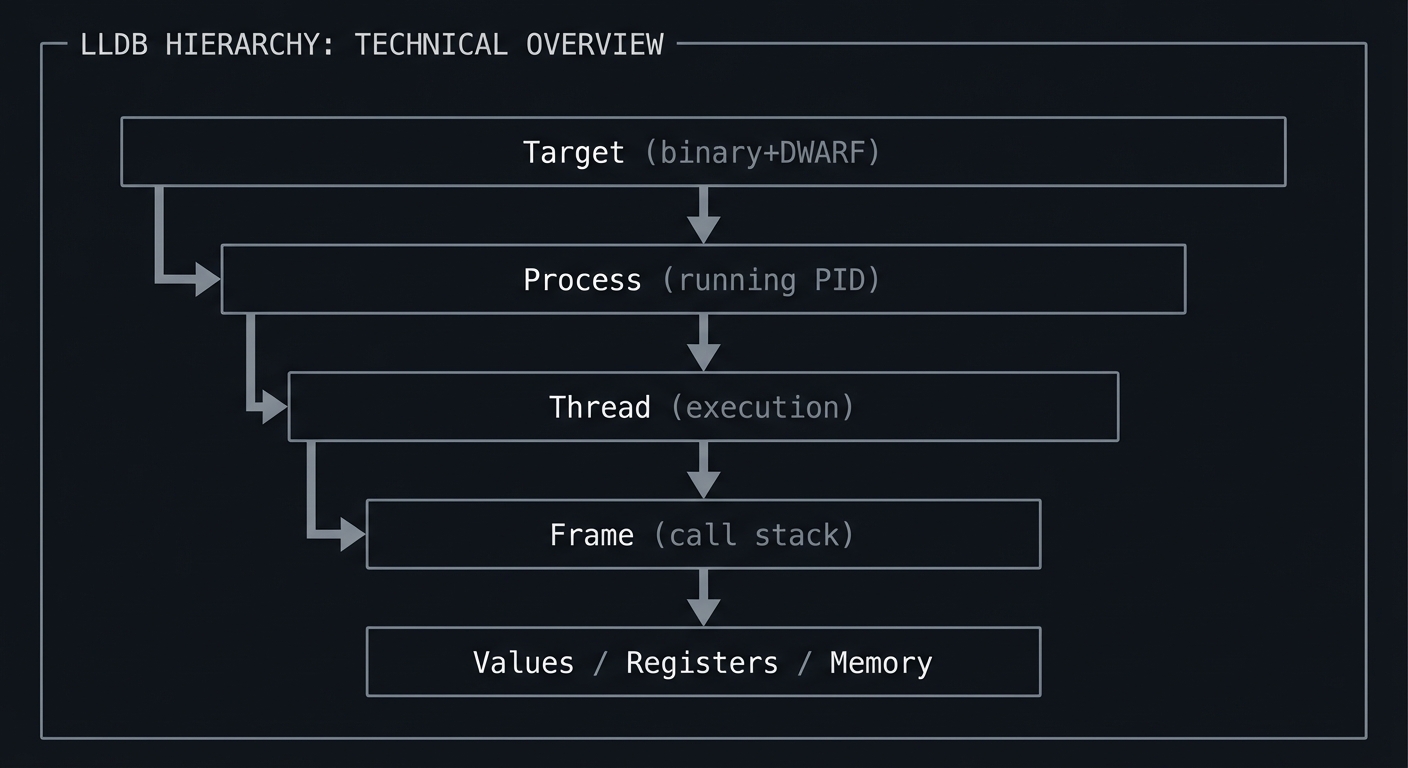
Big Picture / Mental Model
Think of LLDB as a microscope with a strict hierarchy. You must always know where you are in the hierarchy, because every command operates at a specific level.
+-----------------------+
| Target (binary+DWARF) |
+-----------+-----------+
            |
            v
+-----------+-----------+
| Process (running PID) |
+-----------+-----------+
            |
            v
+-----------+-----------+
| Thread (execution)    |
+-----------+-----------+
            |
            v
+-----------+-----------+
| Frame (call stack)    |
+-----------+-----------+
            |
            v
  Values / Registers / Memory
Theory Primer (Mini-Book)
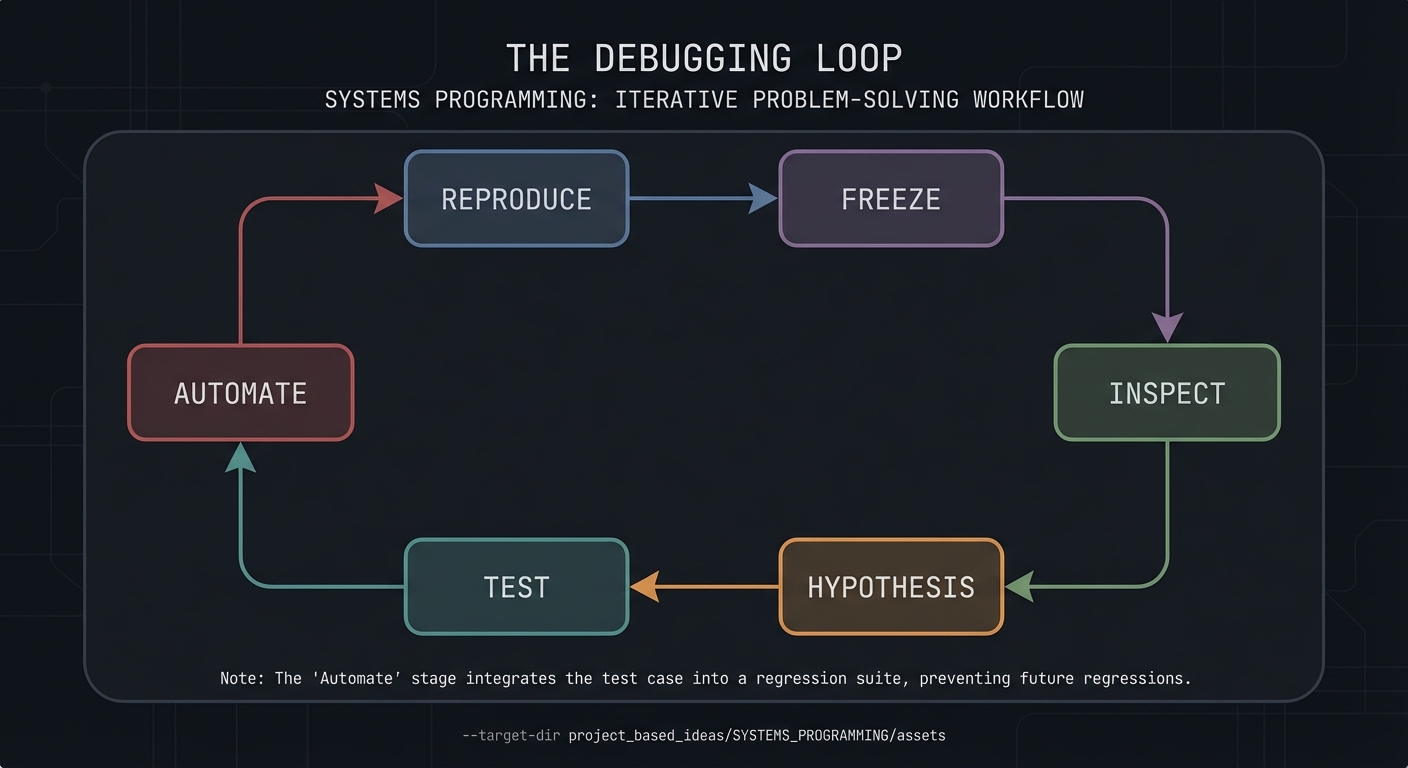
Chapter 1: Debugging as a Scientific Loop
Definitions & key terms
- Symptom: What you observe (crash, hang, wrong output).
- Repro: A way to trigger the issue consistently.
- Hypothesis: A testable explanation for the symptom.
- Evidence: Concrete observations from debugger state.
- Minimal repro: The smallest input that still fails.
Mental model diagram
Reproduce -> Freeze -> Inspect -> Hypothesis -> Test -> Automate
     ^                                            |
     +--------------------------------------------+
How it works (step-by-step)
- Make the bug reproducible.
- Freeze execution at the most informative point.
- Inspect state (stack, locals, registers, memory).
- Form a hypothesis about the root cause.
- Prove or disprove with targeted breakpoints or watchpoints.
- Automate the inspection so you never repeat manual work.
Trade-offs
- Print debugging is fast but noisy and often changes timing.
- Debugger-driven inspection is precise but requires mental discipline.
- Over-instrumentation can hide race conditions or timing bugs.
Minimal concrete example
(lldb) b main
(lldb) run
(lldb) frame variable
(lldb) thread step-over
Common misconceptions
- “The first crash frame is always the bug.” (It often only shows where the symptom occurs.)
- “Stepping one line means one machine instruction.” (Optimizations can merge or reorder instructions.)
Check-your-understanding questions
- What is the difference between a symptom and a root cause?
- Why is a minimal repro valuable in debugging?
- When would you prefer a watchpoint over a breakpoint?
Where you will apply it
Projects 1-6 (all projects depend on this loop).
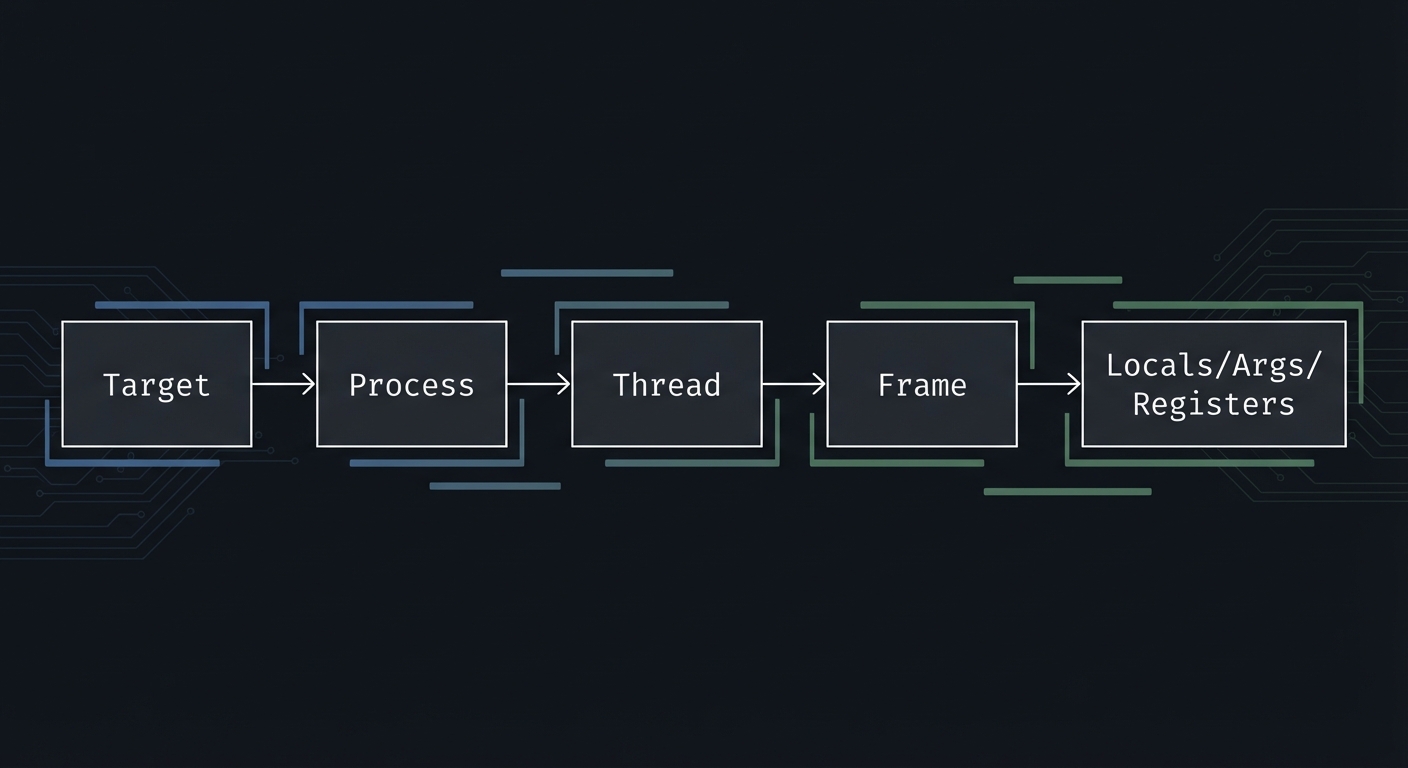
Chapter 2: LLDB Object Model and Execution Context
Definitions & key terms
- Target: The binary plus its debug symbols.
- Process: A running instance of the target.
- Thread: A single execution path within the process.
- Frame: One function call on the stack.
- Stop reason: Why execution paused.
Mental model diagram
Target
  -> Process
     -> Thread
        -> Frame
           -> Locals/Args/Registers
How it works (step-by-step)
- Create or select a target (
target create). - Launch or attach to a process (
run,process attach). - Choose a thread (
thread list,thread select). - Choose a frame (
frame select). - Inspect state (
frame variable,register read).
Trade-offs
- Process-level operations affect all threads.
- Frame-level operations focus on one call site but can miss cross-thread interactions.
Minimal concrete example
(lldb) target create ./target
(lldb) run
(lldb) thread list
(lldb) thread select 1
(lldb) frame select 0
(lldb) frame variable
Common misconceptions
- “A frame is the same as a thread.” (A thread has many frames.)
- “LLDB only understands source code.” (It always reasons about machine code too.)
Check-your-understanding questions
- What changes if you select a different thread?
- Why might LLDB show fewer variables in optimized builds?
Where you will apply it
Projects 1, 2, 3, and 4 (all rely on precise thread/frame selection).
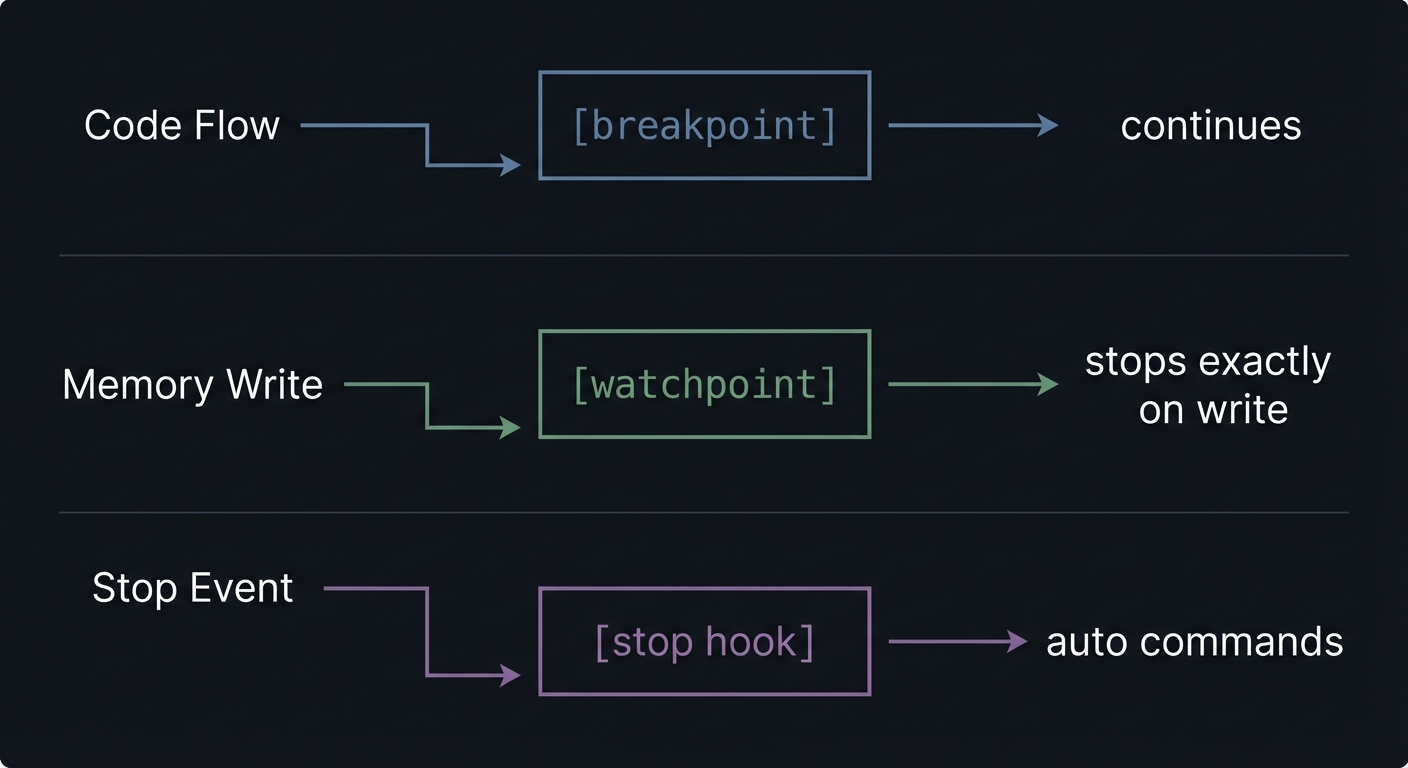
Chapter 3: Control Points - Breakpoints, Watchpoints, and Stop Hooks
Definitions & key terms
- Breakpoint: Stops before a line or function executes.
- Watchpoint: Stops when memory at an address changes.
- Stop hook: Automatically runs commands whenever a stop occurs.
- Condition: A boolean expression that gates a breakpoint.
Mental model diagram
Code Flow -----> [breakpoint] -----> continues
Memory Write ---> [watchpoint] ----> stops exactly on write
Stop Event ----> [stop hook] ------> auto commands
How it works (step-by-step)
- Use breakpoints to control where execution stops.
- Use watchpoints to find who changed memory.
- Use stop hooks to run your inspection commands automatically.
Trade-offs
- Hardware watchpoints are limited in number.
- Conditional breakpoints can slow execution.
- Stop hooks can be noisy if you overuse them.
Minimal concrete example
(lldb) breakpoint set --file main.c --line 12
(lldb) watchpoint set variable counter
(lldb) target stop-hook add -o "frame variable"
Common misconceptions
- “Watchpoints track a variable even if it is optimized out.” (They track addresses, not source names.)
- “A stop hook changes program state.” (It only runs debugger commands.)
Check-your-understanding questions
- Why are watchpoints better than repeated stepping for corruption bugs?
- When would you use a condition vs a manual check?
Where you will apply it
Projects 1 and 4 (control flow and corruption).
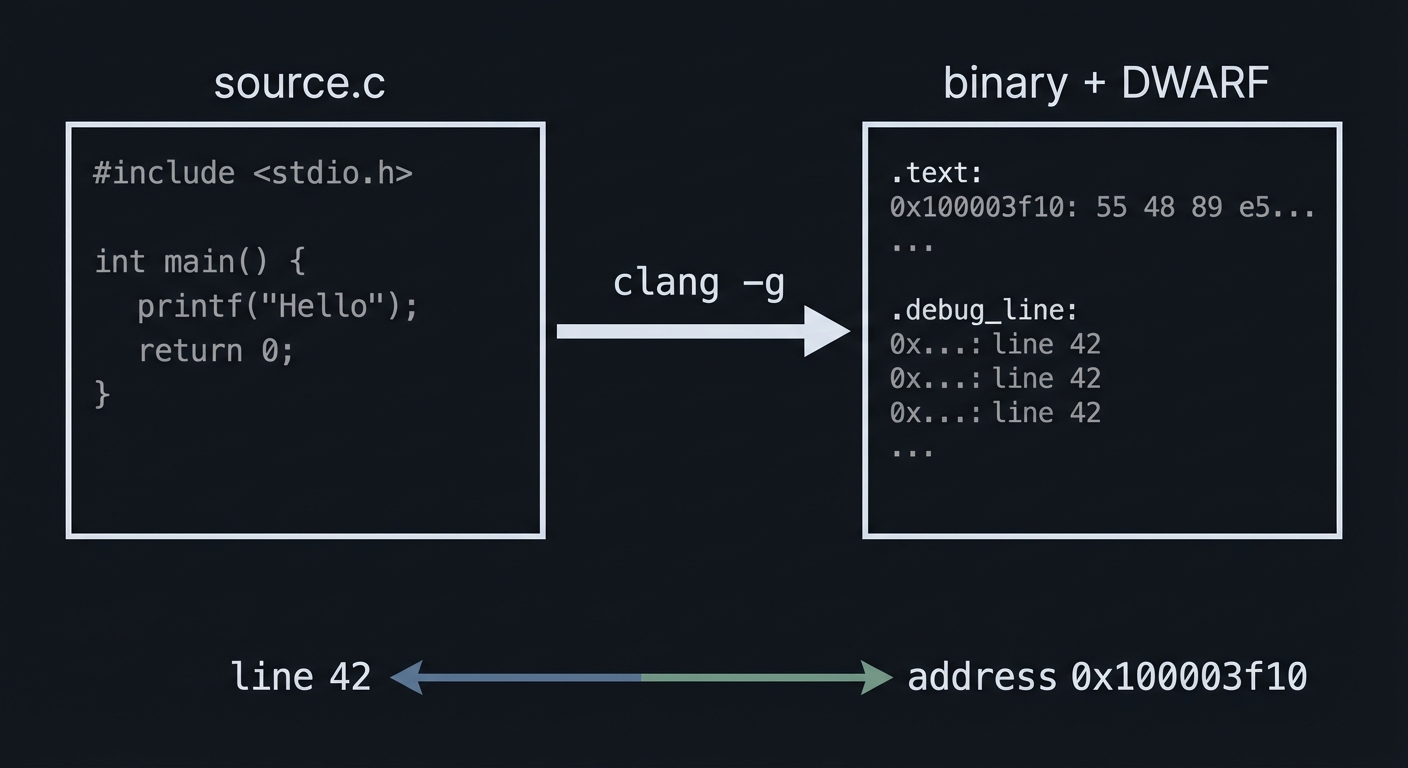
Chapter 4: Symbols, DWARF, and Source Mapping
Definitions & key terms
- Symbols: Names for functions/variables in a binary.
- DWARF: Debug metadata mapping source to machine code.
- Line table: Maps source lines to addresses.
- Compile unit: A source file compiled into the binary.
Mental model diagram
source.c --clang -g--> binary + DWARF
  line 42  <---------> address 0x100003f10
How it works (step-by-step)
- Compile with
-gto emit DWARF debug info. - LLDB reads DWARF to map source lines to addresses.
- If optimized (
-O2), variables may be in registers or optimized away.
Trade-offs
-O0 -ggives the most faithful debugging experience.- Higher optimization levels can reorder instructions and hide variables.
Minimal concrete example
clang -g -O0 -o target target.c
(lldb) image lookup -n main
Common misconceptions
- “Debug symbols are only for backtraces.” (They enable locals, types, and source mapping.)
- “DWARF is optional for source debugging.” (Without it, you debug assembly only.)
Check-your-understanding questions
- Why might a variable show as “optimized out”?
- What does
-gchange in the binary?
Where you will apply it
Projects 1-4 (all depend on good debug symbols).
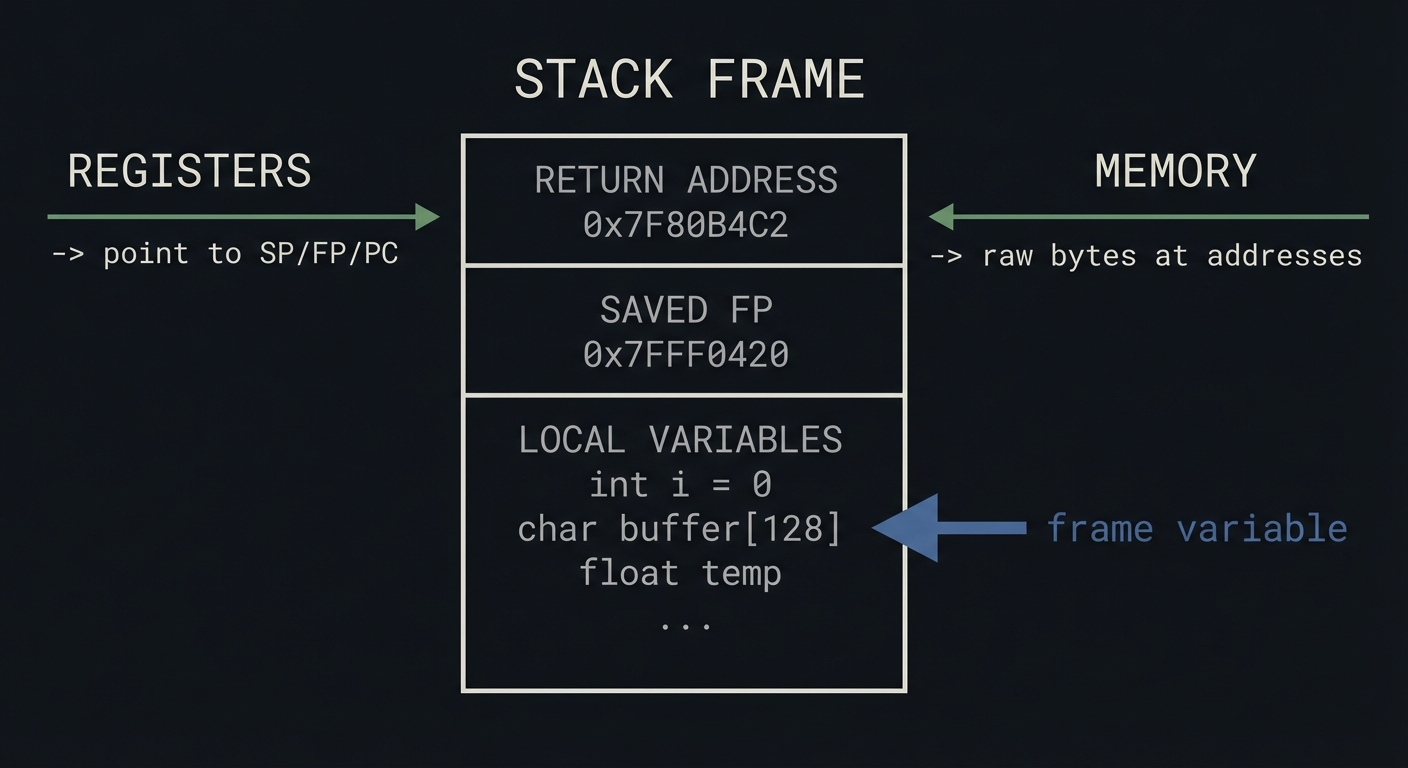
Chapter 5: State Inspection - Frames, Registers, Memory, Expressions
Definitions & key terms
- Backtrace: The call stack for a thread.
- Register: CPU state (RIP, RSP, etc.).
- Memory view: Raw bytes at an address.
- Expression evaluation: Using Clang to evaluate code in context.
Mental model diagram
Stack Frame
+--------------------+
| Return Address     |
| Saved FP           |
| Local Variables    | <-- frame variable
+--------------------+
Registers -> point to SP/FP/PC
Memory -> raw bytes at addresses
How it works (step-by-step)
- Use
btto see the call stack. - Use
frame variableto inspect locals/args. - Use
register readto inspect CPU state. - Use
memory readfor raw bytes. - Use
exprto evaluate expressions in the current frame.
Trade-offs
- Expression evaluation can have side effects.
- Memory reads require you to interpret endianness and type sizes.
Minimal concrete example
(lldb) bt
(lldb) frame variable
(lldb) register read
(lldb) memory read --format x --size 4 --count 8 $sp
(lldb) expr my_struct->count
Common misconceptions
- “
expris just a print command.” (It runs code in the program context.) - “Registers are only for assembly debugging.” (They explain crash addresses.)
Check-your-understanding questions
- What is the difference between
frame variableandexpr? - Why does reading memory require a size and format?
Where you will apply it
Projects 1-5 (inspection is the core skill).
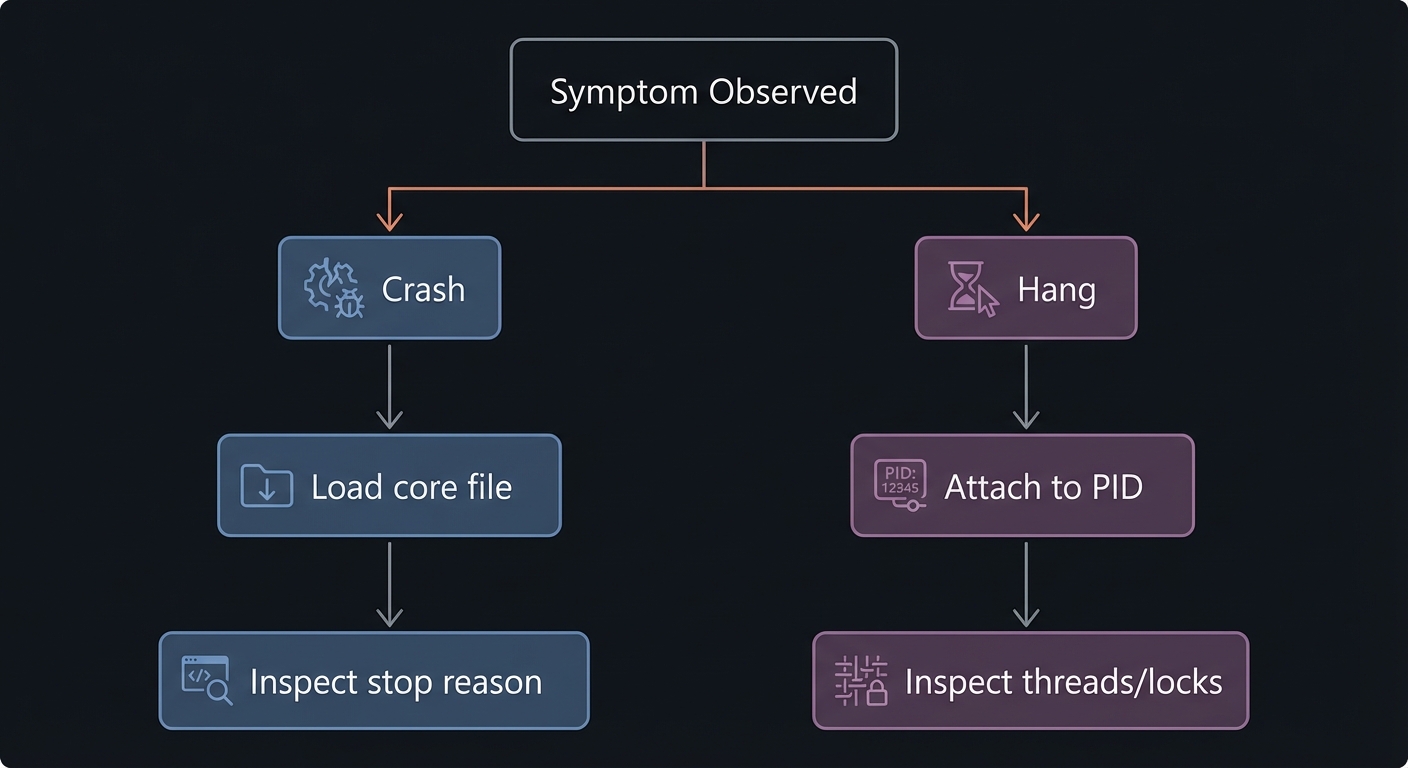
Chapter 6: Failure Mode Triage - Crashes, Hangs, and Core Files
Definitions & key terms
- Crash: Program stopped by a signal or exception.
- Hang: Program still running but not making progress.
- Core file: A snapshot of process memory at crash time.
- Attach: Connecting LLDB to a live process.
Mental model diagram
            +--------------------+
            | Symptom Observed   |
            +---------+----------+
                      |
         +------------+------------+
         |                         |
      Crash                     Hang
         |                         |
   Load core file           Attach to PID
         |                         |
 Inspect stop reason    Inspect threads/locks
How it works (step-by-step)
- Crashes: open a core file or crash report, inspect stop reason and frame 0.
- Hangs: attach to a live process, inspect all threads and where they block.
- Use backtraces and locks to find the blocking path.
Trade-offs
- Core files are frozen snapshots (no live state changes).
- Attaching can briefly pause or perturb a production process.
Minimal concrete example
lldb ./crash -c core
(lldb) process attach --pid 12345
Common misconceptions
- “A hang is random.” (There is always a reason - usually a lock or wait.)
- “Core files are enough to see everything.” (You cannot observe dynamic state.)
Check-your-understanding questions
- What information is missing from a core file?
- Why is a full thread backtrace critical for hangs?
Where you will apply it
Projects 2 and 3.
Chapter 7: Automation and Extensibility (Python + Formatters)
Definitions & key terms
- Command script: A Python file loaded into LLDB.
- SB API: LLDB’s object-oriented Python API (SBDebugger, SBTarget, etc.).
- Summary provider: A one-line string description for a type.
- Synthetic children: Custom “virtual” fields for pretty printing.
Mental model diagram
LLDB Core
  |  exposes SB API
  v
Python Scripts
  |  register commands/formatters
  v
Custom Debugging UX
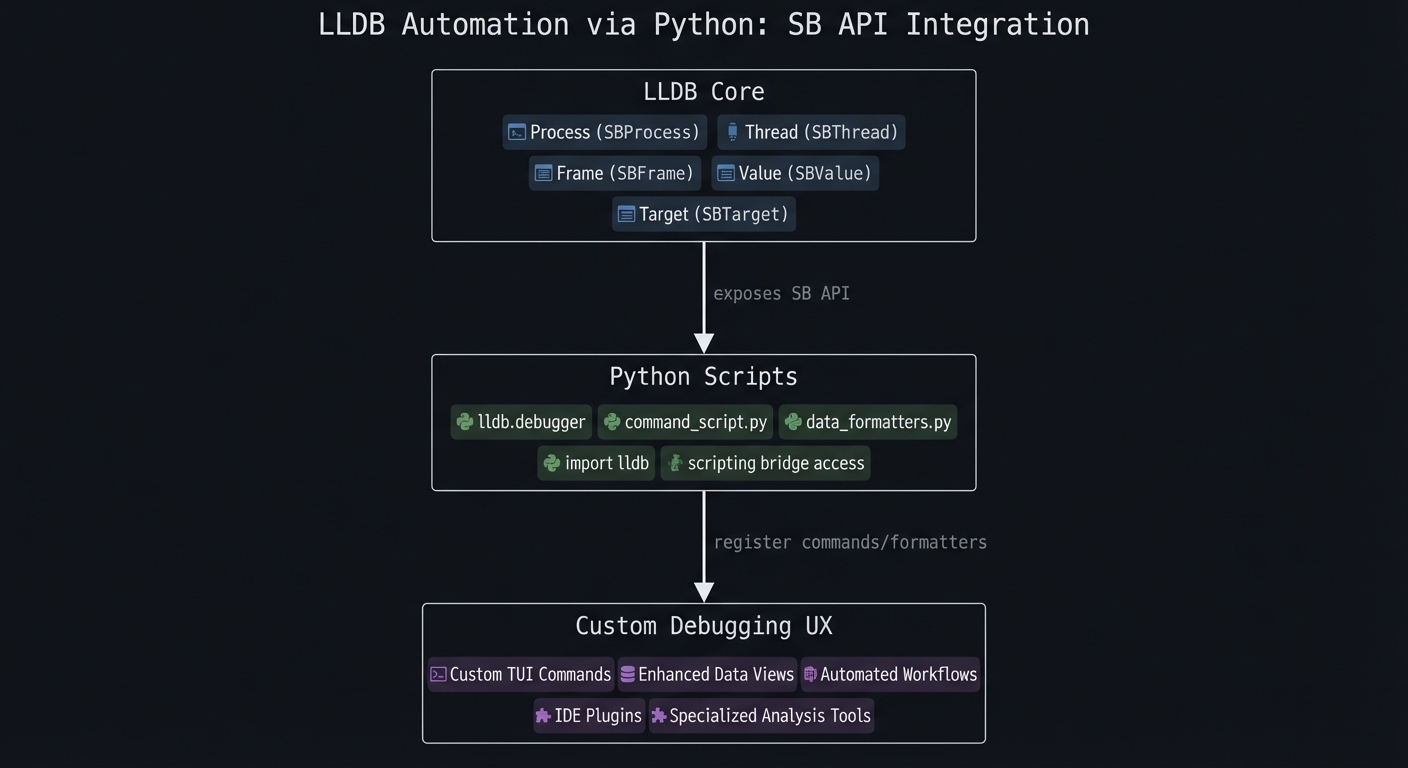
How it works (step-by-step)
- Write a Python module with custom commands.
- Import it in LLDB (
command script import). - Register commands or data formatters.
- Use
~/.lldbinitto load automatically.
Trade-offs
- Powerful customization, but you own the maintenance.
- Over-automation can hide understanding if you do not learn the underlying commands.
Minimal concrete example
import lldb

def __lldb_init_module(debugger, internal_dict):
    debugger.HandleCommand(
        'command script add -f mymod.hello hello'
    )
Common misconceptions
- “Python scripting is only for big teams.” (Even one custom command saves hours.)
- “Formatters are only cosmetic.” (They change how fast you understand state.)
Check-your-understanding questions
- What object represents the current frame in the SB API?
- What is the difference between a summary provider and synthetic children?
Where you will apply it
Projects 5 and 6.
Glossary (High-Signal)
- Target: The debugged binary plus symbol information.
- Process: A running instance of the target program.
- Thread: A single execution context within a process.
- Frame: A single function call in a thread’s stack.
- Breakpoint: A stop point based on a code location.
- Watchpoint: A stop point based on a memory write/read.
- Stop hook: Auto-executed debugger commands on stop.
- Stop reason: Why LLDB paused execution.
- DWARF: Standard debug info format mapping source to machine code.
- Core file: Snapshot of process state at crash time.
- Summary provider: Python function that returns a one-line summary for a type.
- Synthetic children: Custom, virtual children exposed for a type.
Why LLDB Matters (Context & Evolution)
Modern systems are large, concurrent, and often performance-sensitive. When something fails, you need evidence fast. Debuggers let you inspect real program state without re-instrumenting or redeploying.
A widely cited NIST report estimated software defects cost the US economy $59.5B annually (2002 dollars), largely due to debugging and downtime. The ability to debug efficiently is not just a convenience; it is an economic necessity. Source: https://www.nist.gov/director/planning/upload/report02-3.pdf
LLDB specifically matters because it is built on LLVM libraries and leverages the Clang expression parser, making it a natural fit for LLVM/Clang-based toolchains. Source: https://lldb.llvm.org/
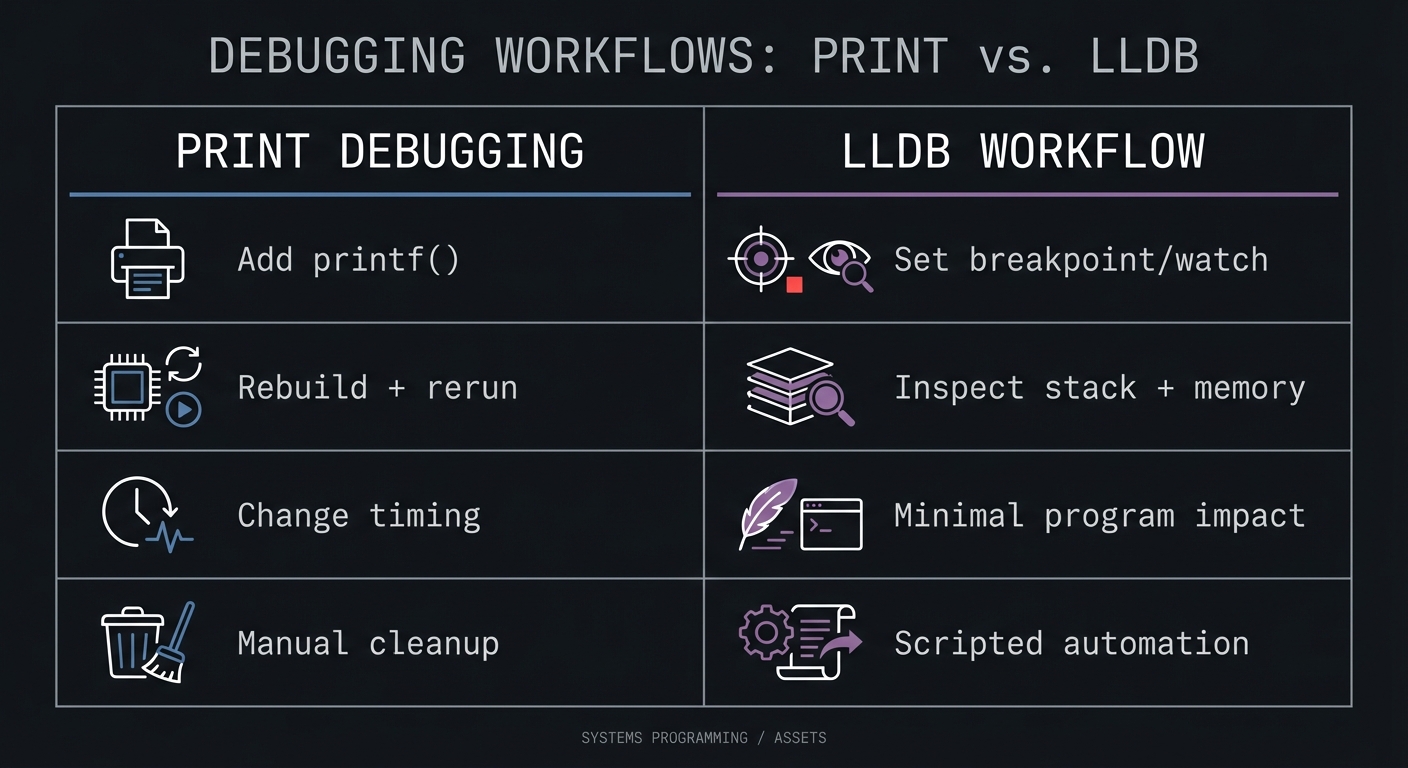
Old style vs modern LLDB workflow:
Print Debugging                 LLDB Workflow
-----------------              -----------------------
Add printf()                    Set breakpoint/watch
Rebuild + rerun                 Inspect stack + memory
Change timing                   Minimal program impact
Manual cleanup                  Scripted automation
Context & Evolution (optional): LLDB is built as a set of reusable LLVM components, which helps it integrate closely with modern toolchains. Source: https://lldb.llvm.org/
Concept Summary Table
| Concept Cluster | What You Need to Internalize |
|---|---|
| Debugging workflow | Reproduce -> freeze -> inspect -> test -> automate. |
| LLDB object model | Target -> Process -> Thread -> Frame determines scope. |
| Control points | Breakpoints stop flow; watchpoints catch memory changes; stop hooks automate inspection. |
| Symbols & DWARF | Source mapping depends on debug info and compile flags. |
| State inspection | Stack, registers, memory, and expressions are your evidence. |
| Crash vs hang triage | Crashes use stop reasons/core files; hangs require attach + full thread analysis. |
| Automation | Python API and formatters make debugging repeatable and faster. |
Project-to-Concept Map
| Project | Primary Concepts |
|---|---|
| 1. The Basics | Workflow, object model, stepping, inspection |
| 2. The Crash | Symbols/DWARF, stop reasons, core files |
| 3. The Hang | Attach, thread inspection, locks/waits |
| 4. The Corruption | Watchpoints, memory inspection |
| 5. Python Scripting | SB API, command scripts, stop hooks |
| 6. Custom Data Formatter | SBValue, summaries, synthetic children |
Deep Dive Reading by Concept
| Concept | Book & Chapter | Why This Matters |
|---|---|---|
| Debugging workflow | The Art of Debugging with GDB, DDD, and Eclipse - Ch. 1-3 | Core mental model for debugging sessions. |
| Stack frames & calling | Computer Systems: A Programmer’s Perspective - Ch. 3 | Understanding frames makes backtraces meaningful. |
| Linking & symbols | Computer Systems: A Programmer’s Perspective - Ch. 7 | Explains symbols and relocation. |
| Process & threads | Operating Systems: Three Easy Pieces - Ch. 4-5, 26 | Explains execution contexts and concurrency. |
| Memory layout | The Linux Programming Interface - Ch. 6 | Memory mapping and process address space. |
| Python automation | Fluent Python (2nd Ed.) - Ch. 7-10 | Python constructs for writing LLDB scripts. |
| Debugger internals | Building a Debugger - Ch. 1-4 | Understands how debuggers work under the hood. |
Quick Start (First 48 Hours)
Day 1 (2-4 hours)
- Read Chapters 1-4 in the primer.
- Build Project 1 and log every LLDB command you used.
- Create a cheat sheet of 10 commands you will reuse.
Day 2 (2-4 hours)
- Read Chapters 5-6.
- Build Project 2 (core file) and Project 3 (attach).
- Write a 1-page “debugging playbook” you can reuse later.
Recommended Learning Paths
- C Developer Path: Chapters 1-5 -> Projects 1-4 -> Chapter 6 -> Projects 2-3 -> Chapter 7 -> Projects 5-6.
- Systems Engineer Path: Chapters 1-2 -> Project 1 -> Chapter 6 -> Projects 2-3 -> Chapter 4 -> Project 4 -> Chapter 7 -> Projects 5-6.
- Automation Path: Chapters 1-2 -> Project 1 -> Chapter 7 -> Project 5 -> Project 6 (then circle back to Projects 2-4).
Success Metrics
- You can attach to a running PID, inspect state, and detach without killing it.
- You can diagnose a crash from a core file in under 10 minutes.
- You can pinpoint a memory corruption bug with a watchpoint.
- You can write and load a custom LLDB Python command.
- You can create a data formatter that prints a linked list cleanly.
- You can explain the difference between a stop reason and a crash root cause.
Optional Appendices
Appendix A: LLDB Command Cheat Sheet
| Task | Command |
|---|---|
| Create target | target create ./a.out |
| Run | run |
| Set breakpoint | breakpoint set --name main |
| List breakpoints | breakpoint list |
| Set watchpoint | watchpoint set variable myvar |
| Continue | continue |
| Backtrace | bt |
| Inspect locals | frame variable |
| Inspect registers | register read |
| Read memory | memory read --format x --size 4 --count 8 $sp |
| Attach to PID | process attach --pid 1234 |
| Detach | detach |
| Load core file | target create --core core ./a.out |
| Add stop hook | target stop-hook add -o "frame variable" |
Appendix B: Debugging Checklist
- Do I have a minimal repro?
- Do I know the stop reason?
- Did I inspect all threads?
- Do I know what memory changed and when?
- Have I ruled out optimized-out variables?
- Did I automate any repeated inspection?
Project List
| # | Project | Difficulty | Time | Key Skill |
|---|---|---|---|---|
| 1 | The Basics - First Steps | Beginner | 1-2h | Stepping + inspection |
| 2 | The Crash - Crash Report Analysis | Beginner | 1-2h | Core file + stop reason |
| 3 | The Hang - Attaching to a Running Process | Intermediate | 2-3h | Attach + thread analysis |
| 4 | The Corruption - Using Watchpoints | Intermediate | 2-3h | Watchpoints |
| 5 | LLDB Python Scripting | Advanced | 1 week | Automation |
| 6 | Custom Data Formatter | Expert | 1 week | Python formatters |
Project 1: The Basics - First Steps
What you’ll build: A tiny C program with a loop and a function call. You will use LLDB to step, inspect variables, and build confidence with the object model.
Why it matters: This is the core muscle memory you will use in every real debugging session.
Real World Outcome
You will compile and debug a program like this:
// target.c
#include <stdio.h>

void greet(int count) {
    printf("Hello for the %dth time!\n", count);
}

int main() {
    int i;
    for (i = 0; i < 5; ++i) {
        greet(i);
    }
    return 0;
}
Expected LLDB session output:
$ clang -g -O0 -o target target.c
$ lldb ./target
(lldb) target create "./target"
Current executable set to '/path/to/target' (x86_64).
(lldb) breakpoint set --name main
Breakpoint 1: where = target`main at target.c:8, address = 0x0000000100003f70
(lldb) run
Process 4242 launched: '/path/to/target' (x86_64)
Process 4242 stopped
* thread #1, queue = 'com.apple.main-thread', stop reason = breakpoint 1.1
    frame #0: 0x0000000100003f70 target`main at target.c:8
(lldb) thread step-over
(lldb) frame variable i
(int) i = 0
(lldb) thread step-in
(lldb) bt
* thread #1, queue = 'com.apple.main-thread', stop reason = step in
  * frame #0: 0x0000000100003f44 target`greet(count=0) at target.c:4
    frame #1: 0x0000000100003f7a target`main at target.c:9
The Core Question You’re Answering
“How do I freeze a running program at the exact line I care about and prove what the variables and call stack look like?”
Concepts You Must Understand First
- Targets, processes, and frames
- Book reference: Computer Systems: A Programmer’s Perspective - Ch. 3
- Stack frames and call stacks
- Book reference: The Art of Debugging with GDB, DDD, and Eclipse - Ch. 1-2
- Debug symbols (
-g)- Book reference: Computer Systems: A Programmer’s Perspective - Ch. 7
Questions to Guide Your Design
- How do you create a target and set a breakpoint at
main? - What is the difference between
thread step-inandthread step-over? - Which command shows locals vs registers vs stack frames?
Thinking Exercise
Before using LLDB, predict what the call stack looks like right after greet() is entered. Draw the stack frames and annotate which frame is active.
The Interview Questions They’ll Ask
- What is the difference between a process and a thread in LLDB?
- When should you use
frame variablevsexpr? - Why do you compile with
-g -O0while learning? - What does the stop reason tell you?
Hints in Layers
Hint 1: Start with help
(lldb) help breakpoint
Hint 2: Use aliases
(lldb) b main
(lldb) n
(lldb) s
Hint 3: Combine stepping + inspection
(lldb) n
(lldb) frame variable
Books That Will Help
| Topic | Book | Chapter |
|---|---|---|
| Debugging workflow | The Art of Debugging with GDB, DDD, and Eclipse | Ch. 1-2 |
| Stack frames | Computer Systems: A Programmer’s Perspective | Ch. 3 |
| Symbols | Computer Systems: A Programmer’s Perspective | Ch. 7 |
Common Pitfalls & Debugging
Problem 1: “Breakpoint never hits”
- Why: You compiled without
-gor set the breakpoint on the wrong symbol. - Fix: Rebuild with
-g -O0and verify withbreakpoint list. - Quick test:
image lookup -n main
Problem 2: “No local variables shown”
- Why: Optimization removed them.
- Fix: Rebuild with
-O0and verify in LLDB.
Definition of Done
- You can set a breakpoint by name and by file/line.
- You can step in, step over, and step out.
- You can print a local variable and view the call stack.
- You can explain why
-g -O0matters.
Project 2: The Crash - Crash Report Analysis
What you’ll build: A small program that reliably segfaults. You will analyze the crash with a core file and identify the root cause using LLDB.
Why it matters: Crash triage is a real-world skill. You often debug what already crashed, not what you can run in a debugger.
Real World Outcome
// crash.c
void crash_me() {
    char *p = 0;
    *p = 'A';
}
int main() { crash_me(); return 0; }
Expected LLDB session output:
$ clang -g -O0 -o crash crash.c
$ ulimit -c unlimited
$ ./crash
Segmentation fault (core dumped)
$ lldb ./crash -c core
(lldb) target create "./crash" --core "core"
Core file '/path/to/core' successfully loaded.
Process 5312 stopped
* thread #1, stop reason = signal SIGSEGV: invalid address (fault address: 0x0)
    frame #0: 0x000055555555513d crash`crash_me() at crash.c:3
(lldb) bt
* thread #1, stop reason = signal SIGSEGV
  * frame #0: 0x000055555555513d crash`crash_me at crash.c:3
    frame #1: 0x0000555555555152 crash`main at crash.c:5
(lldb) register read
(lldb) frame variable p
(char *) p = 0x0000000000000000
The Core Question You’re Answering
“Given a crash that already happened, how do I reconstruct what went wrong from the frozen state?”
Concepts You Must Understand First
- Stop reasons and signals
- Book reference: The Art of Debugging with GDB, DDD, and Eclipse - Ch. 3
- Core files and process snapshots
- Book reference: The Linux Programming Interface - Ch. 6
- Stack frames & backtraces
- Book reference: Computer Systems: A Programmer’s Perspective - Ch. 3
Questions to Guide Your Design
- How do you load a core file in LLDB?
- What is the faulting address and which instruction accessed it?
- Which frame is the symptom and which is the root cause?
Thinking Exercise
On paper, trace which line is likely to fault first and predict the register that will contain the bad address.
The Interview Questions They’ll Ask
- What is the difference between a crash log and a core file?
- How do you identify the faulting instruction?
- Why might frame #0 not be the real bug?
- What does SIGSEGV mean at the CPU level?
Hints in Layers
Hint 1: Look at the stop reason
(lldb) thread info
Hint 2: Verify the bad address
(lldb) register read
Hint 3: Walk the stack
(lldb) bt
Books That Will Help
| Topic | Book | Chapter |
|---|---|---|
| Debugging crashes | The Art of Debugging with GDB, DDD, and Eclipse | Ch. 3 |
| Core files | The Linux Programming Interface | Ch. 6 |
| Stack frames | Computer Systems: A Programmer’s Perspective | Ch. 3 |
Common Pitfalls & Debugging
Problem 1: “No core file is generated”
- Why: Core dumps are disabled by default.
- Fix: Run
ulimit -c unlimited. - Quick test: Trigger a crash and confirm
coreappears.
Problem 2: “LLDB can’t find symbols”
- Why: Binary rebuilt or stripped after crash.
- Fix: Use the exact binary that generated the core.
Definition of Done
- You can load a core file and see the stop reason.
- You can identify the faulting instruction and address.
- You can explain why the crash happened.
Project 3: The Hang - Attaching to a Running Process
What you’ll build: A program with an infinite loop. You will attach LLDB to a running process, inspect its state, and detach safely.
Why it matters: Hanging services are common in production. You must debug them without killing them.
Real World Outcome
// hang.c
#include <unistd.h>
int main() {
    volatile int counter = 0;
    while (1) { counter++; sleep(1); }
    return 0;
}
Expected LLDB session output:
$ clang -g -O0 -o hang hang.c
$ ./hang
$ pgrep hang
12345
$ lldb
(lldb) process attach --pid 12345
Process 12345 stopped
* thread #1, stop reason = signal SIGSTOP
    frame #0: 0x00007fff2031d7d8 libsystem_c.dylib`nanosleep
(lldb) bt
* thread #1, stop reason = signal SIGSTOP
  * frame #0: 0x00007fff2031d7d8 libsystem_c.dylib`nanosleep
    frame #1: 0x0000000100003f72 hang`main at hang.c:5
(lldb) frame select 1
(lldb) frame variable counter
(int) counter = 10
(lldb) expr counter = 100
(int) $0 = 100
(lldb) detach
Process 12345 detached
The Core Question You’re Answering
“How do I pause a live process, inspect its state, and leave it running without disruption?”
Concepts You Must Understand First
- Process attach/detach
- Book reference: Operating Systems: Three Easy Pieces - Ch. 4-5
- Thread states and blocking calls
- Book reference: Operating Systems: Three Easy Pieces - Ch. 26
- Live inspection
- Book reference: The Art of Debugging with GDB, DDD, and Eclipse - Ch. 2-3
Questions to Guide Your Design
- What process ID should you attach to?
- How do you identify which thread is blocked?
- How do you confirm you are in your code vs a library call?
Thinking Exercise
List 3 reasons a program might hang. For each, describe what the backtrace would look like.
The Interview Questions They’ll Ask
- What is the difference between attaching and launching?
- How do you find a deadlock using a debugger?
- Why is detaching safer than killing the process?
- What does SIGSTOP mean in this context?
Hints in Layers
Hint 1: Start by listing threads
(lldb) thread list
Hint 2: Get all backtraces
(lldb) thread backtrace all
Hint 3: Change state in place
(lldb) expr counter = 100
Books That Will Help
| Topic | Book | Chapter |
|---|---|---|
| Processes | Operating Systems: Three Easy Pieces | Ch. 4-5 |
| Threads | Operating Systems: Three Easy Pieces | Ch. 26 |
| Debugging workflow | The Art of Debugging with GDB, DDD, and Eclipse | Ch. 2-3 |
Common Pitfalls & Debugging
Problem 1: “Attach fails with permission error”
- Why: OS security restrictions.
- Fix: Run as same user or use sudo if required.
Problem 2: “No symbols after attach”
- Why: Debug symbols missing in binary.
- Fix: Rebuild with
-gand run that binary.
Definition of Done
- You can attach to a running process by PID.
- You can locate the active frame in your code.
- You can modify a variable and detach safely.
Project 4: The Corruption - Using Watchpoints
What you’ll build: A program with a subtle memory corruption. You will use a watchpoint to stop on the exact write that corrupts data.
Why it matters: This is one of the most powerful debugging techniques in low-level programming.
Real World Outcome
// corrupt.c
#include <stdio.h>
int global_value = 100;
void buggy_function() {
    int *p = &global_value;
    *(p + 1) = 0; // Off-by-one write
}
int main() {
    int local_value = 200;
    buggy_function();
    return 0;
}
Expected LLDB session output:
$ clang -g -O0 -o corrupt corrupt.c
$ lldb ./corrupt
(lldb) b main
(lldb) run
(lldb) watchpoint set variable local_value
Watchpoint created: Watchpoint 1: addr = 0x7ffeefbff5ec size = 4
(lldb) continue
Process 7777 resuming
Watchpoint 1 hit:
old value: 200
new value: 0
* thread #1, stop reason = watchpoint 1
    frame #0: 0x0000000100003f48 corrupt`buggy_function at corrupt.c:5
(lldb) bt
* thread #1, stop reason = watchpoint 1
  * frame #0: 0x0000000100003f48 corrupt`buggy_function at corrupt.c:5
    frame #1: 0x0000000100003f7a corrupt`main at corrupt.c:9
The Core Question You’re Answering
“Who changed this memory, and what exact line caused it?”
Concepts You Must Understand First
- Pointer arithmetic and memory layout
- Book reference: Understanding and Using C Pointers - Ch. 1-3
- Stack vs global memory
- Book reference: Computer Systems: A Programmer’s Perspective - Ch. 3
- Watchpoints
- Book reference: The Art of Debugging with GDB, DDD, and Eclipse - Ch. 5
Questions to Guide Your Design
- Which variable should you watch and why?
- How many hardware watchpoints does your CPU allow?
- How would you use a conditional watchpoint to reduce noise?
Thinking Exercise
Draw the memory layout around global_value and local_value. Predict where the off-by-one write lands.
The Interview Questions They’ll Ask
- What is a watchpoint and how is it implemented in hardware?
- Why might a watchpoint not trigger?
- How do you debug memory corruption without stepping line-by-line?
- What is the difference between a read and a write watchpoint?
Hints in Layers
Hint 1: Set the watchpoint on the corrupted variable
(lldb) watchpoint set variable local_value
Hint 2: Inspect the address
(lldb) frame variable &local_value
Hint 3: Add a condition
(lldb) watchpoint modify -c 'new_val == 0'
Books That Will Help
| Topic | Book | Chapter |
|---|---|---|
| Pointer arithmetic | Understanding and Using C Pointers | Ch. 1-3 |
| Memory layout | Computer Systems: A Programmer’s Perspective | Ch. 3 |
| Watchpoints | The Art of Debugging with GDB, DDD, and Eclipse | Ch. 5 |
Common Pitfalls & Debugging
Problem 1: “Watchpoint never triggers”
- Why: You set it on the wrong variable or the variable optimized out.
- Fix: Rebuild with
-O0and verify withwatchpoint list.
Problem 2: “Too many watchpoints”
- Why: CPUs have limited hardware watchpoints.
- Fix: Remove unused watchpoints with
watchpoint delete.
Definition of Done
- You can set a watchpoint on a variable and trigger it.
- You can identify the exact line that corrupts memory.
- You can explain why watchpoints are more efficient than stepping.
Project 5: LLDB Python Scripting
What you’ll build: A Python module that adds a custom LLDB command which prints a summarized view of the current frame.
Why it matters: This is how you turn LLDB into a tool that understands your workflow.
Real World Outcome
# myscripts.py
import lldb

def frame_summary_command(debugger, command, result, internal_dict):
    target = debugger.GetSelectedTarget()
    thread = target.GetProcess().GetSelectedThread()
    frame = thread.GetSelectedFrame()

    func_name = frame.GetFunctionName()
    line = frame.GetLineEntry().GetLine()
    file_path = frame.GetLineEntry().GetFileSpec().fullpath

    result.AppendMessage(f"Function: {func_name}")
    result.AppendMessage(f"Location: {file_path}:{line}")
    result.AppendMessage("Locals:")
    for var in frame.GetVariables(True, True, False, False):
        result.AppendMessage(f"  - {var.GetName()} = {var.GetValue()}")


def __lldb_init_module(debugger, internal_dict):
    debugger.HandleCommand(
        'command script add -f myscripts.frame_summary_command frame_summary'
    )
Expected LLDB session output:
$ lldb ./target
(lldb) command script import myscripts.py
(lldb) b main
(lldb) run
(lldb) frame_summary
Function: main
Location: /path/to/target.c:8
Locals:
  - i = 0
The Core Question You’re Answering
“How can I turn repetitive inspection steps into a single command?”
Concepts You Must Understand First
- LLDB SB API basics
- Book reference: Building a Debugger - Ch. 1-2
- Python modules and functions
- Book reference: Fluent Python - Ch. 7-9
- LLDB command scripting
- Book reference: The Art of Debugging with GDB, DDD, and Eclipse - Ch. 7
Questions to Guide Your Design
- Which LLDB objects do you need to access the current frame?
- How will you format output so it is readable at a glance?
- Should your command handle invalid targets/frames gracefully?
Thinking Exercise
Write down 3 pieces of data you always check when you stop in LLDB. Could you print them in one command?
The Interview Questions They’ll Ask
- What does
SBDebuggerrepresent? - How do you register a Python function as an LLDB command?
- How would you make your command load automatically?
- What is the difference between
frame.GetVariablesandframe.FindVariable?
Hints in Layers
Hint 1: Use the function signature LLDB expects
def mycmd(debugger, command, result, internal_dict):
    pass
Hint 2: Always validate the target
if not debugger.GetSelectedTarget():
    result.SetError("Invalid target")
Hint 3: Add the command in __lldb_init_module
def __lldb_init_module(debugger, internal_dict):
    debugger.HandleCommand('command script add -f mymod.mycmd mycmd')
Books That Will Help
| Topic | Book | Chapter |
|---|---|---|
| Debugger internals | Building a Debugger | Ch. 1-2 |
| Python scripting | Fluent Python | Ch. 7-9 |
| Debugging mindset | The Art of Debugging with GDB, DDD, and Eclipse | Ch. 7 |
Common Pitfalls & Debugging
Problem 1: “Command not found”
- Why: Script not imported or
__lldb_init_modulemissing. - Fix: Run
command script importand check for errors.
Problem 2: “AttributeError on SB objects”
- Why: Using the wrong API method.
- Fix: Print the object type and check LLDB Python docs.
Definition of Done
- You can import a Python module into LLDB.
- Your custom command prints a structured summary of the frame.
- You can reload the command without restarting LLDB.
Final Overall Project: Custom Data Formatter
What you’ll build: A C program that uses a linked list, and a Python data formatter that teaches LLDB how to print that list clearly.
Why it matters: This is LLDB’s superpower - teaching the debugger to understand your data structures.
Real World Outcome
// linkedlist.c
typedef struct Node {
    int value;
    struct Node *next;
} Node;

int main() {
    Node c = {3, 0};
    Node b = {2, &c};
    Node a = {1, &b};
    Node *head = &a; // Breakpoint here
    return 0;
}
Without formatter:
(lldb) fr v head
(Node *) head = 0x00007ffeefbff5e8
With your Python formatter:
# formatter.py
import lldb

def LinkedListSummary(valobj, internal_dict):
    head = valobj
    count = 0
    while head.GetChildMemberWithName("next").GetValueAsUnsigned() != 0:
        count += 1
        head = head.GetChildMemberWithName("next")
    return f"Linked list with {count+1} nodes"

def __lldb_init_module(debugger, internal_dict):
    debugger.HandleCommand(
        'type summary add --python-function formatter.LinkedListSummary "Node *"'
    )
Expected LLDB session output:
(lldb) command script import formatter.py
(lldb) b 10
(lldb) run
(lldb) fr v head
(Node *) head = 0x00007ffeefbff5e8 (Linked list with 3 nodes)
The Core Question You’re Answering
“How can I make LLDB show my custom data structures in a human-friendly way?”
Concepts You Must Understand First
- SBValue and traversal
- Book reference: Building a Debugger - Ch. 2-3
- Pointers and structs
- Book reference: Understanding and Using C Pointers - Ch. 4
- Python formatting APIs
- Book reference: Fluent Python - Ch. 7-9
Questions to Guide Your Design
- How will you traverse the list safely from Python?
- How do you handle cycles or null pointers?
- How do you register the formatter only for the correct type?
Thinking Exercise
Draw the linked list in memory and annotate where the pointers live. Predict how LLDB will show the raw data before the formatter.
The Interview Questions They’ll Ask
- What is a summary provider in LLDB?
- How do you register a type summary for
Node *? - How would you prevent infinite loops when traversing a list?
- What is the difference between a summary and a synthetic child provider?
Hints in Layers
Hint 1: Start with a one-line summary
(lldb) type summary add --summary-string "nodes = ${var}" "Node *"
Hint 2: Use GetChildMemberWithName
next_ptr = valobj.GetChildMemberWithName("next")
Hint 3: Handle null pointers
if valobj.GetValueAsUnsigned() == 0:
    return "(null)"
Books That Will Help
| Topic | Book | Chapter |
|---|---|---|
| Debugger internals | Building a Debugger | Ch. 2-3 |
| Pointers & structs | Understanding and Using C Pointers | Ch. 4 |
| Python scripting | Fluent Python | Ch. 7-9 |
Common Pitfalls & Debugging
Problem 1: “Formatter never runs”
- Why: The type name does not match the summary rule.
- Fix: Use
type summary listand verify the exact type string.
Problem 2: “Infinite loop in formatter”
- Why: Cycles in the list or missing termination.
- Fix: Add a maximum node limit or detect visited addresses.
Definition of Done
- LLDB prints a human-friendly summary of the linked list.
- The formatter handles null pointers safely.
- You can enable/disable the formatter at will.
Summary
| Project | Main Programming Language |
|---|---|
| The Basics | LLDB Commands (on a C target) |
| The Crash | LLDB Commands (on a C target) |
| The Hang | LLDB Commands (on a C target) |
| The Corruption | LLDB Commands (on a C target) |
| Python Scripting | Python (in LLDB) |
| Custom Data Formatter | Python (in LLDB) |