Project 1: “Hello, Toolchain” — Build Pipeline Explorer
Build a CLI tool that reveals every transformation your C code undergoes from source to running process.
Quick Reference
| Attribute | Value |
|---|---|
| Language | C (alt: Rust, Zig, C++) |
| Difficulty | Intermediate |
| Time | 1–2 weeks |
| Chapters | 1, 7 |
| Coolness | ★★★☆☆ Genuinely Clever |
| Portfolio Value | Resume Gold |
Learning Objectives
By completing this project, you will:
- Trace the complete compilation pipeline: Explain what happens at each stage from
.cto running process - Read object file metadata: Parse and interpret ELF section headers, symbol tables, and relocation entries
- Understand static vs dynamic linking: Predict how symbol resolution differs and demonstrate the tradeoffs
- Map runtime memory layout: Connect debugger output to the theoretical process address space model
- Debug using binary artifacts: Given a crash address, trace back through the pipeline to find the source
- Use professional tooling fluently: Master
gcc,objdump,readelf,nm,ldd, and debuggers
The Core Question You’re Answering
“What exactly happens between typing gcc hello.c and having a running process, and why does each transformation exist?”
This question forces you to confront the reality that compilation is not magic—it is a deterministic pipeline where each stage produces artifacts that the next stage consumes. Understanding this pipeline is the foundation for debugging linker errors, understanding security vulnerabilities, optimizing build times, and reasoning about what code actually executes.
Concepts You Must Understand First
Before starting this project, ensure you understand these concepts:
| Concept | Why It Matters | Where to Learn |
|---|---|---|
| C preprocessor directives (#include, #define) | You’ll trace how these expand | CS:APP 1.2, any C book Ch. 1 |
| Basic assembly syntax (mov, call, ret) | You’ll read compiler output | CS:APP 3.1-3.4 |
| What a function call does at the machine level | You’ll see call/ret in action | CS:APP 3.7 |
| Hexadecimal notation | Object files are full of hex | CS:APP 2.1 |
| What “address” means for code and data | Linking assigns addresses | CS:APP 1.4, 7.1 |
| Difference between source, object, and executable files | Core of this project | CS:APP 1.2, Chapter 7 intro |
Key Concepts Deep Dive
- The Translation Pipeline (Preprocessing, Compilation, Assembly, Linking)
- What is the output of each stage and what format does it take?
- Why does preprocessing happen before compilation?
- What would break if you skipped the assembly stage and went directly from compiler output to object file?
- CS:APP Ch. 1.2, Ch. 7.1-7.2
- Object Files and ELF Format
- What are sections and why do .text, .data, .rodata, and .bss exist as separate concepts?
- What is a symbol table and why does it contain both defined and undefined symbols?
- What is a relocation entry and why can’t the assembler resolve all addresses itself?
- CS:APP Ch. 7.3-7.4
- Symbol Resolution and Linking
- How does the linker decide which definition to use when multiple object files define the same symbol?
- What is the difference between strong and weak symbols?
- Why do static libraries and dynamic libraries resolve symbols differently?
- CS:APP Ch. 7.5-7.7
- Loading and Process Creation
- What does the loader do with the ELF file before main() runs?
- Where do the various segments end up in virtual memory?
- What is the role of the dynamic linker (ld-linux.so)?
- CS:APP Ch. 7.9, Ch. 8.2
- Compilation and Code Generation
- What decisions does the compiler make when translating C to assembly?
- How do optimization levels affect the generated code?
- What information is lost during compilation that cannot be recovered?
- CS:APP Ch. 1.2, Ch. 3.1-3.2
Theoretical Foundation
The Compilation Pipeline
When you type gcc hello.c -o hello, you’re invoking not one tool but four distinct programs, each performing a specific transformation:
┌─────────────┐     ┌─────────────┐     ┌─────────────┐     ┌─────────────┐     ┌─────────────┐
│   hello.c   │────▶│   hello.i   │────▶│   hello.s   │────▶│   hello.o   │────▶│   hello     │
│   (source)  │ cpp │(preprocessed)│ cc1 │ (assembly)  │ as  │  (object)   │ ld  │(executable) │
└─────────────┘     └─────────────┘     └─────────────┘     └─────────────┘     └─────────────┘
     Text              Text               Text              Binary             Binary
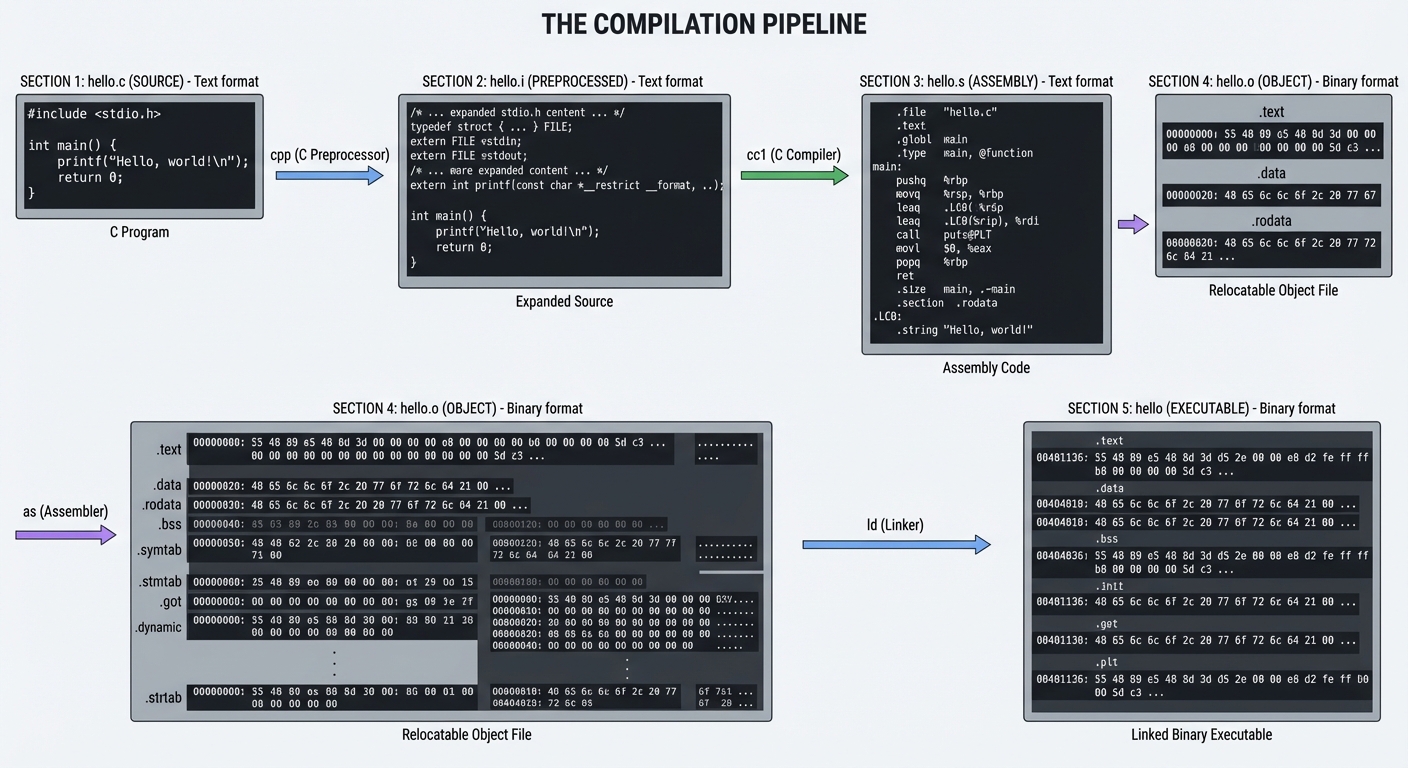
Stage 1: Preprocessing (cpp)
The C preprocessor handles all directives starting with #:
// Before preprocessing
#include <stdio.h>
#define MAX 100

int main() {
    printf("Max is %d\n", MAX);
}
// After preprocessing (hello.i) - simplified
// ... thousands of lines from stdio.h ...
typedef struct _IO_FILE FILE;
extern int printf(const char *__format, ...);
// ... more declarations ...

int main() {
    printf("Max is %d\n", 100);  // MAX replaced with 100
}
Key insight: The preprocessor is a text-to-text transformation. It knows nothing about C syntax—it just does text substitution and file inclusion.
Run: gcc -E hello.c -o hello.i
Stage 2: Compilation (cc1)
The compiler proper transforms C into assembly. This is where:
- Syntax is parsed into an Abstract Syntax Tree
- Type checking occurs
- Optimizations are applied
- Code is generated for the target architecture
# hello.s (simplified x86-64)
    .section .rodata
.LC0:
    .string "Max is %d\n"

    .text
    .globl main
main:
    pushq   %rbp
    movq    %rsp, %rbp
    movl    $100, %esi        # Second argument (MAX value)
    leaq    .LC0(%rip), %rdi  # First argument (format string)
    movl    $0, %eax          # varargs convention
    call    printf@PLT
    movl    $0, %eax          # return 0
    popq    %rbp
    ret
Run: gcc -S hello.c -o hello.s
Stage 3: Assembly (as)
The assembler converts human-readable assembly to machine code, producing an object file (.o). This is the first binary stage.
Object files contain:
- Machine code (the
.textsection) - Data (
.data,.rodata,.bsssections) - Symbol table (what symbols are defined/referenced)
- Relocation entries (addresses to fix up during linking)
Run: gcc -c hello.c -o hello.o
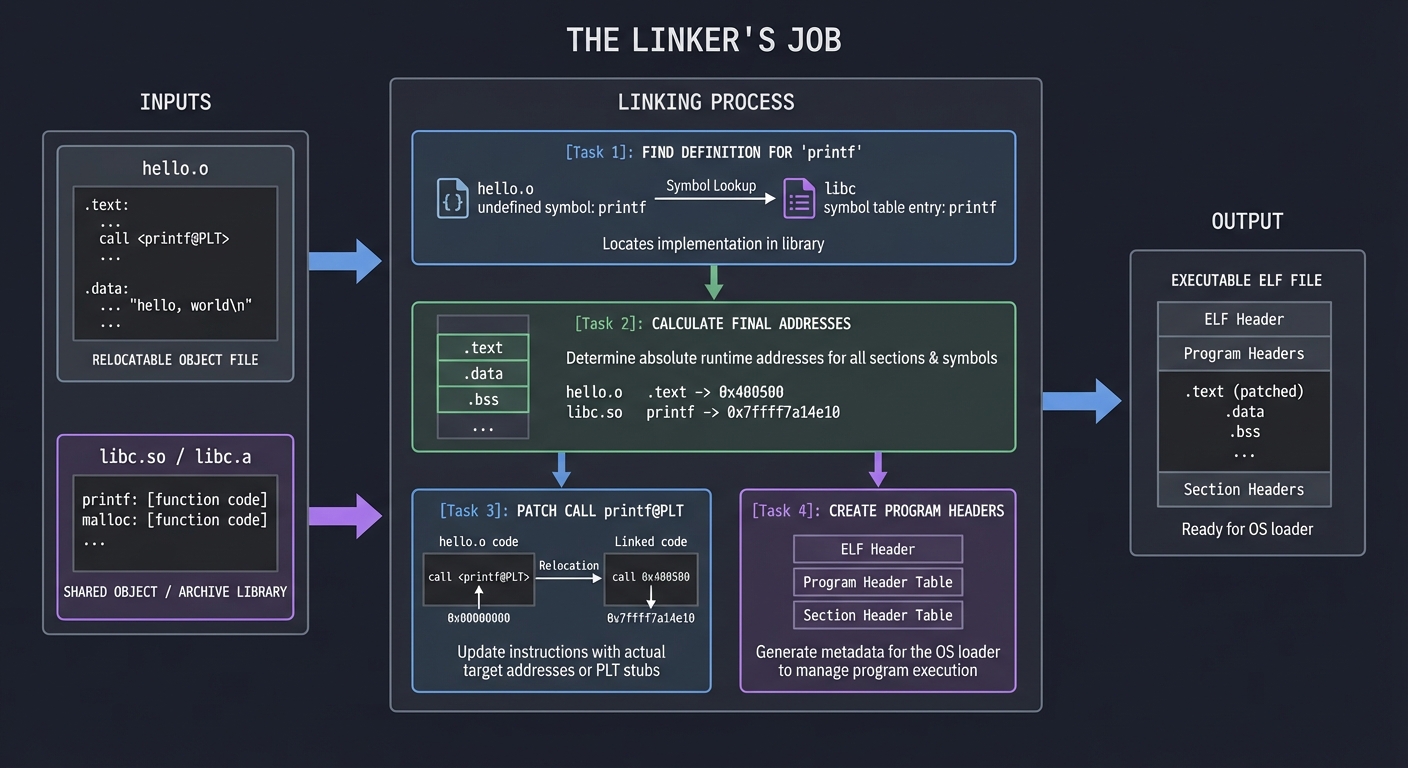
Stage 4: Linking (ld)
The linker combines object files and libraries into an executable:
- Symbol resolution: Match each symbol reference to exactly one definition
- Relocation: Fix up addresses now that final layout is known
- Layout: Organize sections into a loadable format
┌─────────────────────────────────────────────────────────────┐
│                    Linker's Job                             │
├─────────────────────────────────────────────────────────────┤
│  Input: hello.o + libc.so (or libc.a)                       │
│                                                             │
│  1. Find definition for 'printf' → in libc                  │
│  2. Calculate final addresses for all symbols               │
│  3. Patch call printf@PLT with actual jump target          │
│  4. Create program headers for OS loader                    │
│  5. Output: Executable ELF file                             │
└─────────────────────────────────────────────────────────────┘
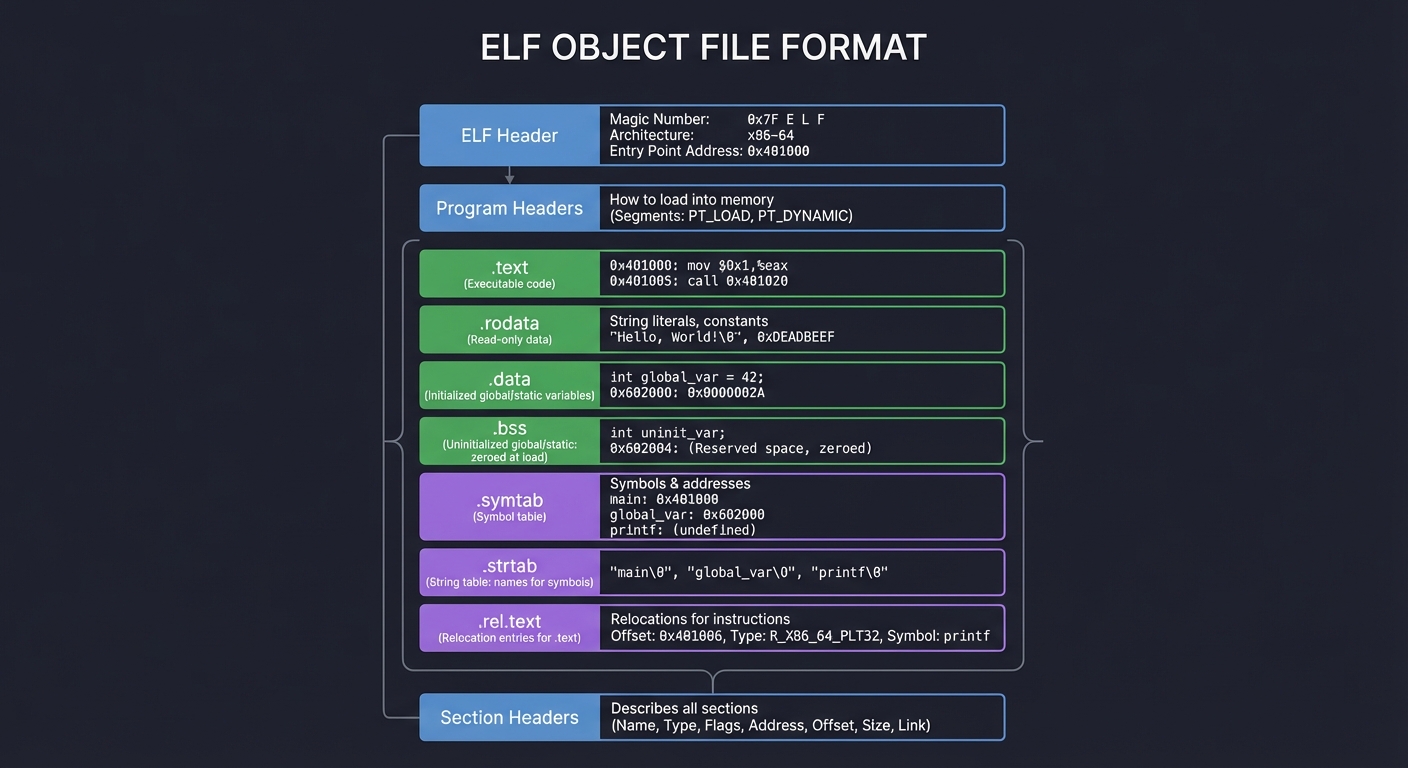
ELF Object File Format
ELF (Executable and Linkable Format) is the standard binary format on Linux/Unix. Understanding it is crucial:
┌─────────────────────────────────────┐
│           ELF Header                │  Magic number, architecture, entry point
├─────────────────────────────────────┤
│       Program Headers               │  How to load into memory (for executables)
├─────────────────────────────────────┤
│         .text                       │  Executable code
├─────────────────────────────────────┤
│         .rodata                     │  Read-only data (string literals, constants)
├─────────────────────────────────────┤
│         .data                       │  Initialized global/static variables
├─────────────────────────────────────┤
│         .bss                        │  Uninitialized global/static (zeroed at load)
├─────────────────────────────────────┤
│         .symtab                     │  Symbol table
├─────────────────────────────────────┤
│         .strtab                     │  String table (names for symbols)
├─────────────────────────────────────┤
│         .rel.text                   │  Relocation entries for .text
├─────────────────────────────────────┤
│       Section Headers               │  Describes all sections
└─────────────────────────────────────┘
Symbol Types
| Type | Meaning | Example |
|---|---|---|
T |
Text (code) symbol, globally visible | main |
t |
Text symbol, local to file | helper_func with static |
D |
Data symbol, globally visible | int global_var = 5; |
B |
BSS symbol (uninitialized) | int uninit_global; |
U |
Undefined (needs to be resolved) | Reference to printf |
Static vs Dynamic Linking
Static Linking (gcc -static):
- All library code is copied into the executable
- Larger binary, but self-contained
- No runtime dependencies
- Symbol resolution happens entirely at link time
Dynamic Linking (default):
- Library code stays in shared libraries (
.sofiles) - Smaller binaries, shared memory for common libraries
- Resolution happens partly at load time
- PLT (Procedure Linkage Table) and GOT (Global Offset Table) enable lazy binding
Static:  hello (executable) contains printf code
Dynamic: hello (executable) contains PLT stub → jumps to libc.so at runtime
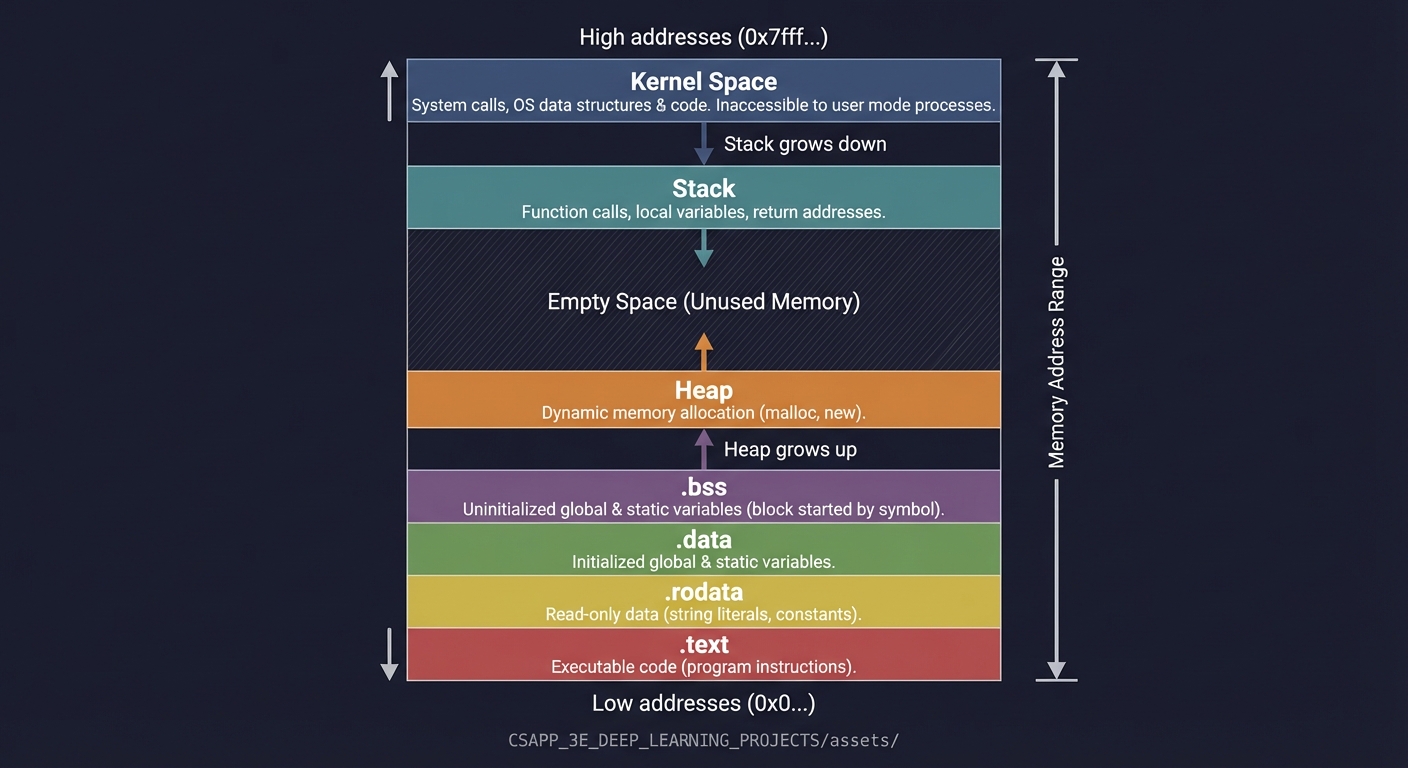
Process Memory Layout
When the OS loads your program, it creates an address space:
High addresses (0x7fff...)
┌─────────────────────────────────────┐
│            Kernel Space             │  Not accessible to user code
├─────────────────────────────────────┤
│              Stack                  │  ↓ grows down (local vars, return addrs)
│                 │                   │
│                 ▼                   │
├─────────────────────────────────────┤
│                                     │  (unmapped region)
├─────────────────────────────────────┤
│                 ▲                   │
│                 │                   │
│              Heap                   │  ↑ grows up (malloc'd memory)
├─────────────────────────────────────┤
│         .bss (uninitialized)        │
├─────────────────────────────────────┤
│         .data (initialized)         │
├─────────────────────────────────────┤
│         .rodata (read-only)         │
├─────────────────────────────────────┤
│         .text (code)                │
└─────────────────────────────────────┘
Low addresses (0x0...)
Why This Matters
Understanding the compilation pipeline enables you to:
- Debug effectively: A crash at address
0x401234means something—you can trace it to the exact instruction and source line - Optimize intelligently: Understanding what the compiler does helps you write code it can optimize well
- Write portable code: Knowing about linking helps you manage symbol visibility and avoid conflicts
- Security analysis: Buffer overflows, return-oriented programming, and other attacks exploit this layout
- Embedded systems: Resource-constrained systems require understanding exactly what ends up in the binary
Common Misconceptions
Misconception 1: “The compiler converts C directly to machine code” Reality: There are four distinct stages, each with its own tools and artifacts.
Misconception 2: “Object files are executables” Reality: Object files contain machine code but can’t run—they have unresolved symbols and no load information.
Misconception 3: “Static linking is always better for deployment” Reality: Dynamic linking saves memory (shared libraries), enables updates without recompilation, and is required for some features (plugins, LGPL compliance).
Misconception 4: “The stack grows up” Reality: On x86/x86-64, the stack grows DOWN (toward lower addresses). This is crucial for understanding buffer overflows.
Project Specification
What You Will Build
A command-line “pipeline explainer” that takes a C source file and produces a structured report showing:
- Every artifact produced at each compilation stage
- Symbol and section analysis of the object file
- Linking information (resolved symbols, required libraries)
- Runtime process layout (via controlled execution with debugger)
Functional Requirements
- Pipeline Capture (
--pipeline):- Save preprocessed output (
.i) - Save assembly output (
.s) - Save object file (
.o) - Save final executable
- Save preprocessed output (
- Object Analysis (
--analyze):- List all sections with sizes and types
- List symbols by category (defined, undefined, local, global)
- Show relocation entries
- Link Analysis (
--link):- Identify required shared libraries
- Compare static vs dynamic link outputs
- Show symbol resolution decisions
- Runtime Inspection (
--runtime):- Launch under debugger, pause at main
- Report stack and heap boundaries
- Show loaded shared libraries
- Demonstrate memory regions
- Crash Analysis (
--crash <address>):- Given a crash address, trace back to source line
- Show the relevant assembly
- Explain what stage produced that code
Non-Functional Requirements
- Determinism: Same input produces same output (modulo runtime addresses)
- Portability: Works on Linux x86-64 (primary) and macOS (stretch goal)
- Educational: Output explains “why” not just “what”
- Clean: Uses proper error handling, no crashes on malformed input
Real World Outcome
When complete, you will have a CLI tool that produces comprehensive build pipeline analysis:
$ ./pipeline-explorer hello.c --all

================================================================================
                    BUILD PIPELINE ANALYSIS: hello.c
================================================================================

[STAGE 1: PREPROCESSING]
--------------------------------------------------------------------------------
Input:  hello.c (45 bytes, 5 lines)
Output: hello.i (18,432 bytes, 847 lines)
Time:   0.003s

Preprocessing transformations:
  - #include <stdio.h> expanded: +842 lines from /usr/include/stdio.h
  - Header chain: stdio.h -> stddef.h -> bits/types.h -> ...
  - Macros defined: 127 (from system headers)
  - Macros used in source: 0
  - Conditional compilation: 23 #ifdef blocks evaluated

[STAGE 2: COMPILATION]
--------------------------------------------------------------------------------
Input:  hello.i (18,432 bytes)
Output: hello.s (512 bytes, 28 lines)
Time:   0.012s

Assembly characteristics:
  - Target: x86-64 (AT&T syntax)
  - Functions generated: 1 (main)
  - Instructions: 14
  - String literals: 1 ("Hello, World!\n")
  - Section directives: .text, .rodata, .note.GNU-stack

Code generation summary:
  - Stack frame: 16 bytes (aligned)
  - Callee-saved registers used: none
  - External calls: puts@PLT

[STAGE 3: ASSEMBLY]
--------------------------------------------------------------------------------
Input:  hello.s (512 bytes)
Output: hello.o (1,688 bytes)
Time:   0.002s

Object file analysis:
  Section        Size    Type           Flags
  .text          26      PROGBITS       AX (alloc, execute)
  .rodata        15      PROGBITS       A  (alloc)
  .comment       46      PROGBITS       MS (merge, strings)
  .note.GNU-s    0       NOBITS         -
  .eh_frame      56      PROGBITS       A  (alloc)

Symbol table (4 entries):
  Symbol         Type    Bind    Section   Value
  main           FUNC    GLOBAL  .text     0x0
  puts           NOTYPE  GLOBAL  UND       0x0 (undefined - needs linking)

Relocations (2 entries):
  Offset    Type              Symbol    Addend
  0x0a      R_X86_64_PC32     .rodata   -4
  0x0f      R_X86_64_PLT32    puts      -4

[STAGE 4: LINKING]
--------------------------------------------------------------------------------
Input:  hello.o + libc
Output: hello (16,696 bytes)
Time:   0.024s

Linking type: Dynamic
Interpreter: /lib64/ld-linux-x86-64.so.2

Linked binary analysis:
  Section          VMA              Size    Type
  .interp          0x0000000000400318   28    interpreter path
  .text            0x0000000000401040   147   executable code
  .rodata          0x0000000000402000   19    read-only data
  .dynamic         0x0000000000403e10   480   dynamic linking info
  .got.plt         0x0000000000404000   32    GOT for PLT
  .data            0x0000000000404020   0     initialized data
  .bss             0x0000000000404020   0     uninitialized data

Symbol resolution:
  - puts: resolved via PLT/GOT (lazy binding)
  - __libc_start_main: resolved via PLT/GOT
  - Dynamic libraries required: libc.so.6

Entry point: 0x401040 (_start, not main!)

[STAGE 5: RUNTIME OBSERVATION]
--------------------------------------------------------------------------------
Process memory map at main() entry:

Address Range                    Perms  Size    Mapping
0x00400000-0x00401000           r--p   4K      hello (ELF header)
0x00401000-0x00402000           r-xp   4K      hello (.text)
0x00402000-0x00403000           r--p   4K      hello (.rodata)
0x00403000-0x00405000           rw-p   8K      hello (.data, .bss, .got)
0x7ffff7c00000-0x7ffff7c28000   r--p   160K    libc.so.6
0x7ffff7c28000-0x7ffff7dbd000   r-xp   1620K   libc.so.6 (.text)
0x7ffff7fc3000-0x7ffff7fc7000   r--p   16K     ld-linux-x86-64.so.2
0x7ffffffde000-0x7ffffffff000   rw-p   132K    [stack]

Stack frame at main():
  RSP: 0x7fffffffe3d0
  RBP: 0x7fffffffe3e0
  Return address: 0x7ffff7c29d90 (__libc_start_call_main+128)
  argc: 1
  argv[0]: "./hello"

================================================================================
PIPELINE SUMMARY
================================================================================
Total build time: 0.041s
Size amplification: 45 bytes (source) -> 16,696 bytes (binary) = 371x
Symbol resolution: 2 external symbols resolved dynamically
Recommendation: Use -static for deployment, dynamic for development
The tool can also produce focused reports:
$ ./pipeline-explorer hello.c --symbols
$ ./pipeline-explorer hello.c --relocations
$ ./pipeline-explorer hello.c --compare-linking  # static vs dynamic comparison
$ ./pipeline-explorer hello.c --trace-symbol puts  # full resolution chain for one symbol
Questions to Guide Your Design
Work through these questions BEFORE writing code:
-
How will you invoke each stage of the pipeline separately? (Hint: gcc -E, gcc -S, gcc -c, gcc)
-
How will you parse the output of tools like
objdump,readelf, andnmto extract structured information? -
What format will your report take—plain text, JSON, or both? How will you handle reports that need to show binary data?
-
How will you capture runtime information? Will you use GDB scripting, ptrace, or /proc filesystem parsing?
-
How will you handle error cases—what if compilation fails? What if the input is not valid C?
-
How will you make the tool educational? Should it explain why each transformation happened, not just what changed?
-
How will you compare static vs dynamic linking? What metrics are meaningful to show?
Thinking Exercise
Before writing any code, trace through this program by hand:
// main.c
extern int helper(int x);
int global_var = 42;

int main(void) {
    return helper(global_var);
}

// helper.c
int helper(int x) {
    return x + 1;
}
Answer these questions on paper:
-
Preprocessing phase: What will main.i look like? Will it be different from main.c in any meaningful way for this example?
- Symbol table for main.o: List every symbol. For each one, state:
- Name
- Type (FUNC, OBJECT, NOTYPE)
- Binding (LOCAL, GLOBAL)
- Section (which section, or UND if undefined)
-
Relocations in main.o: There will be at least two relocations. What are they and why?
-
Linking main.o + helper.o: Draw the combined symbol table. Which symbols from main.o were undefined before linking but defined after?
-
Memory layout after loading: If the .text section of the final binary starts at 0x401000, and main is at offset 0x20 within .text, what is the absolute address of main?
- Dynamic linking alternative: If helper() were in a shared library instead of helper.o, what would be different about:
- The symbol table
- The relocations
- The PLT/GOT sections
- The runtime behavior on first call to helper()
Hints in Layers
If you’re stuck, reveal hints one at a time:
Hint 1: Getting Started
Start by manually running each stage and saving the outputs:
gcc -E hello.c -o hello.i      # Preprocess only
gcc -S hello.c -o hello.s      # Compile to assembly
gcc -c hello.c -o hello.o      # Assemble to object file
gcc hello.o -o hello           # Link to executable
Look at each output file. What tools can parse them? (file, cat, objdump, readelf, nm)
Hint 2: Extracting Object File Information
These commands give you structured output you can parse:
readelf -h hello.o      # ELF header
readelf -S hello.o      # Section headers
readelf -s hello.o      # Symbol table
readelf -r hello.o      # Relocations
objdump -d hello.o      # Disassembly
Consider using readelf --wide for easier parsing.
Hint 3: Capturing Runtime Information
For the runtime stage, you can use GDB non-interactively:
gdb -batch -ex "break main" -ex "run" -ex "info registers" -ex "x/20x \$rsp" ./hello
Or parse /proc/[pid]/maps from a wrapper program.
Hint 4: Comparing Linking Strategies
Build both versions and compare:
gcc -o hello_dynamic hello.c
gcc -static -o hello_static hello.c
ls -l hello_dynamic hello_static
ldd hello_dynamic
readelf -d hello_dynamic | grep NEEDED
Hint 5: Tool Architecture
Structure your code as:
struct stage_result {
    char *stage_name;
    char *input_file;
    char *output_file;
    size_t input_size;
    size_t output_size;
    double elapsed_time;
    /* stage-specific data */
};

struct preprocess_result { int lines_added; int macros_expanded; ... };
struct compile_result { int instructions; int functions; ... };
struct assemble_result { struct section *sections; struct symbol *symbols; ... };
struct link_result { struct segment *segments; char *entry_point; ... };
Hint 6: The Educational Value
Don’t just report numbers—explain them:
The symbol 'puts' appears in hello.o with type NOTYPE and section UND (undefined).
This means the assembler encountered a call to puts() but has no idea where it is.
The relocation entry at offset 0x0f tells the linker: "When you find puts,
patch this location with the correct address."

After linking, puts is still not directly resolved—instead, the linker created
a PLT entry at 0x401030 and a GOT slot at 0x404018. The first call to puts()
will trigger the dynamic linker to fill in the GOT slot.
Solution Architecture
High-Level Design
┌─────────────────────────────────────────────────────────────────────────┐
│                         pipeline-explorer                                │
├─────────────────────────────────────────────────────────────────────────┤
│                                                                          │
│  ┌──────────────┐   ┌──────────────┐   ┌──────────────┐   ┌───────────┐ │
│  │   Compiler   │──▶│    Object    │──▶│     Link     │──▶│  Runtime  │ │
│  │   Invoker    │   │   Analyzer   │   │   Analyzer   │   │ Inspector │ │
│  └──────────────┘   └──────────────┘   └──────────────┘   └───────────┘ │
│         │                  │                  │                 │        │
│         ▼                  ▼                  ▼                 ▼        │
│  ┌──────────────────────────────────────────────────────────────────────┐│
│  │                        Report Generator                              ││
│  └──────────────────────────────────────────────────────────────────────┘│
│                                    │                                      │
│                                    ▼                                      │
│                             [Formatted Output]                            │
└─────────────────────────────────────────────────────────────────────────┘
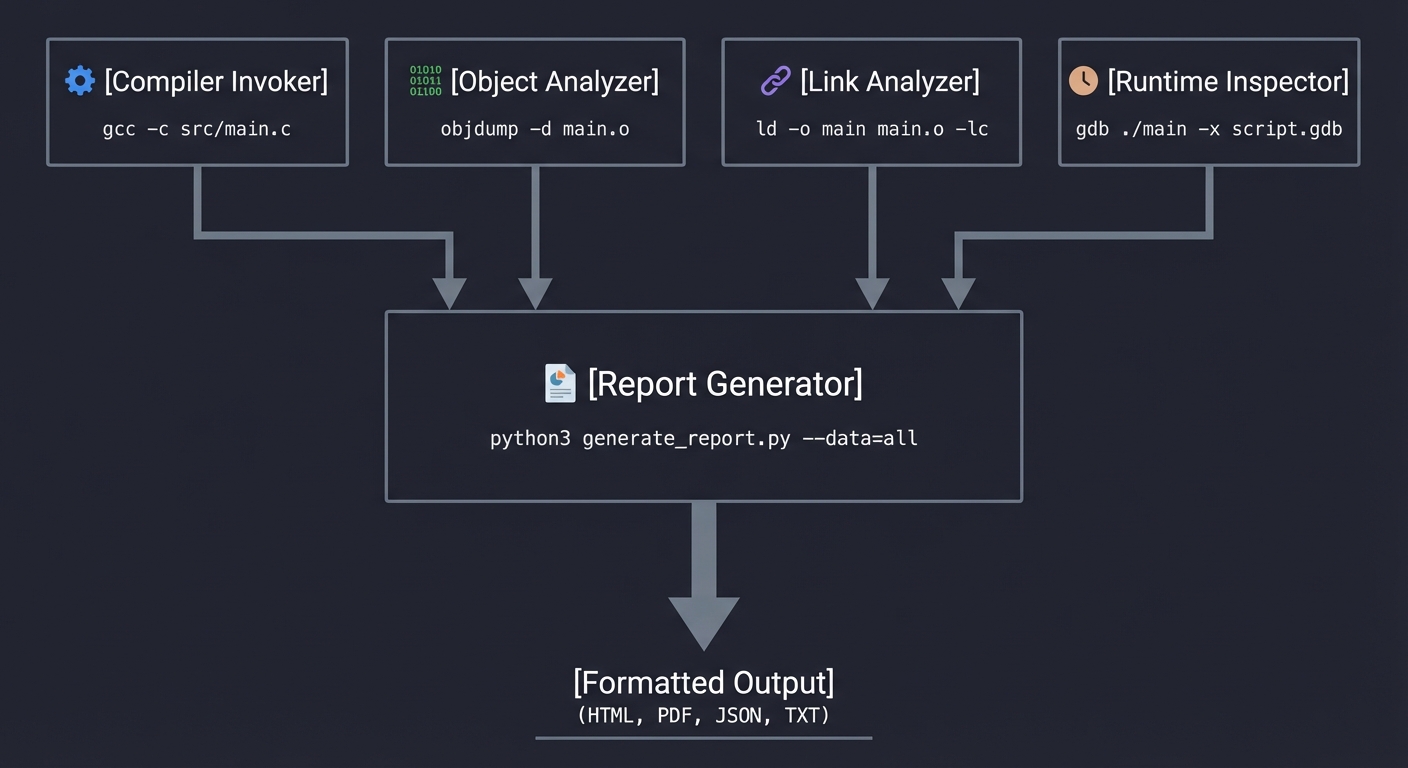
Key Components
| Component | Responsibility | Key Decisions |
|---|---|---|
| Compiler Invoker | Runs gcc with flags to produce each stage artifact | Uses -save-temps or explicit stage flags; captures stderr for warnings |
| Object Analyzer | Parses ELF object files | Can use readelf/objdump output OR parse ELF directly (stretch goal) |
| Link Analyzer | Compares static/dynamic linking, identifies dependencies | Uses ldd, nm, compares sizes |
| Runtime Inspector | Launches executable under debugger, queries state | Uses GDB in batch mode with scripted commands |
| Report Generator | Formats analysis into readable output | Structured text, optionally JSON for machine consumption |
Data Structures
// Core structures for the analyzer

typedef struct {
    char *name;
    size_t size;
    uint64_t address;
    char type;  // 'T', 'D', 'B', 'U', etc.
    int is_global;
} Symbol;

typedef struct {
    char *name;
    size_t size;
    uint64_t address;
    uint32_t flags;  // SHF_* flags
} Section;

typedef struct {
    uint64_t offset;
    char *symbol_name;
    int type;  // R_X86_64_* relocation type
} Relocation;

typedef struct {
    Section *sections;
    size_t section_count;
    Symbol *symbols;
    size_t symbol_count;
    Relocation *relocations;
    size_t relocation_count;
} ObjectAnalysis;

typedef struct {
    uint64_t text_start, text_end;
    uint64_t data_start, data_end;
    uint64_t heap_start;
    uint64_t stack_top;
    char **loaded_libraries;
    size_t library_count;
} RuntimeLayout;
Algorithm Overview
Main Algorithm Flow:
- Parse command line → determine source file and requested analyses
- Invoke pipeline stages:
- Run
gcc -E→ capture preprocessed output - Run
gcc -S→ capture assembly - Run
gcc -c→ create object file - Run
gcc→ create executable (both static and dynamic versions)
- Run
- Analyze object file:
- Run
readelf -h→ header info - Run
readelf -S→ section table - Run
readelf -s→ symbol table - Run
readelf -r→ relocations - Parse outputs into data structures
- Run
- Analyze linking:
- Compare file sizes
- Run
lddon dynamic version - Run
nmto see resolved symbols
- Runtime inspection:
- Launch with
gdb -batch -ex "..." executable - Query memory mappings (
info proc mappings) - Query stack (
info frame) - Parse GDB output
- Launch with
- Generate report → format and output all collected data
Complexity Analysis:
- Time: O(n) where n is source file size, dominated by gcc invocations
- Space: O(m) where m is size of largest artifact (typically the executable)
Implementation Guide
Development Environment Setup
# Required tools
sudo apt-get install gcc gdb binutils build-essential

# Verify installations
gcc --version
gdb --version
readelf --version
objdump --version

# Create project structure
mkdir -p pipeline-explorer/{src,tests,artifacts}
cd pipeline-explorer
Project Structure
pipeline-explorer/
├── src/
│   ├── main.c              # Entry point, CLI parsing
│   ├── compiler.c          # Invokes gcc stages
│   ├── object_analyzer.c   # Parses ELF via readelf/objdump
│   ├── link_analyzer.c     # Analyzes linking
│   ├── runtime_inspector.c # GDB automation
│   ├── report.c            # Output formatting
│   └── util.c              # String handling, process execution
├── include/
│   ├── pipeline.h          # Shared data structures
│   └── util.h              # Utility declarations
├── tests/
│   ├── simple.c            # Basic test case
│   ├── multifile/          # Multi-file test
│   └── expected/           # Expected outputs
├── Makefile
└── README.md
Implementation Phases
Phase 1: Foundation (Days 1-3)
Goals:
- Set up project structure and build system
- Implement basic pipeline invocation
- Capture all stage artifacts
Tasks:
- Create Makefile that builds your tool
- Implement
run_command()utility that executes shell commands and captures output - Implement
invoke_preprocessor(),invoke_compiler(),invoke_assembler(),invoke_linker() - Verify artifacts are created in a temp directory
Checkpoint: ./pipeline-explorer hello.c produces hello.i, hello.s, hello.o, and hello in an artifacts directory.
Phase 2: Object File Analysis (Days 4-7)
Goals:
- Parse
readelfoutput for sections, symbols, relocations - Build internal data structures
- Format readable output
Tasks:
- Run
readelf -Sand parse section table output - Run
readelf -sand parse symbol table (handling local/global, types) - Run
readelf -rand parse relocation entries - Connect symbols to their sections
- Format and output the analysis
Checkpoint: Running on hello.o shows all sections with sizes, categorizes symbols correctly, and lists relocations.
Phase 3: Link Analysis (Days 8-10)
Goals:
- Compare static vs dynamic linking
- Identify all dependencies
- Show symbol resolution
Tasks:
- Create both static (
-static) and dynamic versions - Use
lddto list shared library dependencies - Use
nmon final executable to show resolved symbols - Calculate and compare file sizes
- Explain the tradeoffs in output
Checkpoint: Output shows library dependencies, size comparison, and where undefined symbols were resolved.
Phase 4: Runtime Inspection (Days 11-13)
Goals:
- Automate GDB to pause and inspect running process
- Extract memory layout
- Show stack state at entry
Tasks:
- Create GDB command script that sets breakpoint at main, runs, queries state
- Parse
info proc mappingsoutput for memory regions - Parse
info frameoutput for stack information - Handle GDB output parsing robustly
- Integrate into final report
Checkpoint: Running on an executable shows correct memory layout matching expected regions.
Phase 5: Polish & Integration (Day 14)
Goals:
- Error handling for all edge cases
- Clean output formatting
- Testing on various inputs
Tasks:
- Handle compilation errors gracefully
- Test with multi-file programs
- Test with C++ if time permits
- Write documentation
- Clean up code, remove debug output
Checkpoint: Tool handles malformed input gracefully, produces clean reports for variety of test cases.
Key Implementation Decisions
| Decision | Options | Recommendation | Rationale |
|---|---|---|---|
| ELF Parsing | Parse directly vs use readelf | Use readelf | Simpler, ELF parsing is a project unto itself |
| GDB Control | Expect scripts vs Python API | Expect scripts | More portable, simpler to implement |
| Output Format | Text only vs JSON option | Text with JSON flag | Text for humans, JSON for tooling integration |
| Temp Files | System temp vs local dir | Local artifacts/ dir | Easier debugging, user can inspect |
| Static Analysis | Required vs optional | Required with –static flag | Shows important tradeoff but not always available |
Hints in Layers
If you’re stuck, reveal hints one at a time:
Hint 1: Getting Started
Start by manually running each stage and saving the outputs:
gcc -E hello.c -o hello.i      # Preprocess only
gcc -S hello.c -o hello.s      # Compile to assembly
gcc -c hello.c -o hello.o      # Assemble to object file
gcc hello.o -o hello           # Link to executable
Look at each output file. What tools can parse them? (file, cat, objdump, readelf, nm)
Hint 2: Extracting Object File Information
These commands give you structured output you can parse:
readelf -h hello.o      # ELF header
readelf -S hello.o      # Section headers
readelf -s hello.o      # Symbol table
readelf -r hello.o      # Relocations
objdump -d hello.o      # Disassembly
Consider using readelf --wide for easier parsing.
Hint 3: Capturing Runtime Information
For the runtime stage, you can use GDB non-interactively:
gdb -batch -ex "break main" -ex "run" -ex "info registers" -ex "x/20x \$rsp" ./hello
Or parse /proc/[pid]/maps from a wrapper program.
Hint 4: Comparing Linking Strategies
Build both versions and compare:
gcc -o hello_dynamic hello.c
gcc -static -o hello_static hello.c
ls -l hello_dynamic hello_static
ldd hello_dynamic
readelf -d hello_dynamic | grep NEEDED
Hint 5: Tool Architecture
Structure your code as:
struct stage_result {
    char *stage_name;
    char *input_file;
    char *output_file;
    size_t input_size;
    size_t output_size;
    double elapsed_time;
    /* stage-specific data */
};

struct preprocess_result { int lines_added; int macros_expanded; ... };
struct compile_result { int instructions; int functions; ... };
struct assemble_result { struct section *sections; struct symbol *symbols; ... };
struct link_result { struct segment *segments; char *entry_point; ... };
Hint 6: The Educational Value
Don’t just report numbers—explain them:
The symbol 'puts' appears in hello.o with type NOTYPE and section UND (undefined).
This means the assembler encountered a call to puts() but has no idea where it is.
The relocation entry at offset 0x0f tells the linker: "When you find puts,
patch this location with the correct address."

After linking, puts is still not directly resolved—instead, the linker created
a PLT entry at 0x401030 and a GOT slot at 0x404018. The first call to puts()
will trigger the dynamic linker to fill in the GOT slot.
Testing Strategy
Test Categories
| Category | Purpose | Examples |
|---|---|---|
| Unit Tests | Test parsing functions in isolation | Symbol parser handles all types correctly |
| Integration Tests | Test full pipeline on sample programs | hello.c produces expected output |
| Regression Tests | Verify fixes don’t break existing | Compare output to known-good baselines |
| Edge Cases | Handle unusual inputs | Empty file, no symbols, huge files |
Critical Test Cases
- Minimal Program:
int main() { return 0; }Expected: No undefined symbols except _start, minimal sections
- External Dependencies:
#include <stdio.h>
#include <math.h>
int main() { printf("%f\n", sin(1.0)); return 0; }
Expected: Shows printf, sin as undefined → resolved from libc, libm
- Global Variables:
int initialized = 42;
int uninitialized;
const char *message = "hello";
int main() { return initialized + uninitialized; }
Expected: Shows .data, .bss, .rodata usage correctly
- Multi-file:
// main.c
extern int helper(int);
int main() { return helper(5); }

// helper.c
int helper(int x) { return x * 2; }
Expected: Shows symbol resolution between files
- Static vs Dynamic: Same program linked both ways, compare sizes and dependencies
Test Data
# Create test suite
mkdir -p tests

# Test 1: Minimal
echo 'int main() { return 0; }' > tests/minimal.c

# Test 2: Printf
echo '#include <stdio.h>
int main() { printf("hello\n"); return 0; }' > tests/printf.c

# Test 3: Global data
echo 'int x = 1; int y; const char *s = "hi";
int main() { return x + y; }' > tests/globals.c

# Expected output patterns to grep for
# minimal: no.data, minimal.text
# printf: printf in undefined symbols
# globals: all three sections populated
Common Pitfalls & Debugging
Frequent Mistakes
| Pitfall | Symptom | Solution |
|---|---|---|
| Not handling spaces in paths | Tool fails on “/home/user/My Programs/test.c” | Quote all paths in shell commands |
| Parsing readelf wrong | Missing symbols or wrong types | Test parser on diverse binaries first |
| GDB version differences | Commands fail on different systems | Test GDB commands standalone first |
| Forgetting -g for debug info | No source line mapping | Always compile with -g for debug builds |
| Ignoring stderr | Silent failures | Capture and check stderr from all tools |
| Hardcoded paths | Works on your machine only | Use which() or PATH lookup |
Debugging Strategies
- Print intermediate states: After each parsing step, dump the data structure
- Test tools independently: Before integrating, verify
readelf,objdump,gdbproduce expected output - Use simple inputs first: Get minimal.c working perfectly before complex cases
- Compare with manual: Run tools manually and compare to your parsed output
- Binary diff for determinism: Same input should produce byte-identical artifacts (ignoring timestamps)
Performance Traps
- Spawning too many processes: Batch related queries (one readelf call with multiple flags)
- Reading huge outputs: For large binaries, process output line-by-line, don’t load all into memory
- GDB startup time: GDB is slow to start; for multiple queries, use one session with multiple commands
Extensions & Challenges
Beginner Extensions
- Add JSON output:
--format jsonfor machine-readable output - Colorized output: Highlight different symbol types, sections
- Verbose mode: Show actual readelf/objdump commands being run
Intermediate Extensions
- Direct ELF parsing: Read ELF format directly without external tools
- Disassembly integration: Show assembly for specific functions
- Diff mode: Compare two binaries’ symbols and sections
- Cross-compilation support: Analyze ARM/RISC-V binaries
Advanced Extensions
- Debug info parsing: Read DWARF to show full source mapping
- Dynamic analysis: Use ptrace to trace actual symbol resolutions at runtime
- Optimization analysis: Show what changes between -O0, -O1, -O2, -O3
- Security audit: Check for common vulnerabilities (no stack canary, RELRO, etc.)
Self-Assessment Checklist
Before considering this project complete, verify:
Understanding
- I can explain each of the 4 pipeline stages without looking at notes
- I can list the main ELF sections and what goes in each
- I can explain what relocations are and why they’re needed
- I understand the difference between static and dynamic linking
- I can draw the process memory layout and explain each region
Implementation
- Tool correctly identifies all pipeline artifacts
- Symbol parsing correctly categorizes defined/undefined, local/global
- Section sizes match what readelf reports
- Runtime inspection shows correct memory regions
- Error handling works for malformed input
Growth
- I debugged at least one issue by examining the actual binary
- I can now read assembly output and connect it to C source
- I’m comfortable using readelf, objdump, nm, ldd, gdb
The Interview Questions They’ll Ask
After completing this project, you’ll be ready for these common interview questions:
- “Walk me through what happens when you run
gcc -o hello hello.c“- They want: preprocessing expands includes/macros, compiler generates assembly, assembler creates object file with relocations, linker resolves symbols and creates executable
- Bonus: mention that ld.so loads dynamic dependencies at runtime
- “What’s the difference between a linker error and a compiler error?”
- They want: compiler errors are syntax/type errors in a single translation unit; linker errors are symbol resolution failures across multiple object files
- Example: undefined reference vs undeclared identifier
- “Explain static vs dynamic linking and when you’d use each”
- They want: static bundles everything (larger binary, no dependencies, faster startup), dynamic shares libraries (smaller binary, security updates, slower first-call)
- Discuss: deployment scenarios, licensing implications (LGPL)
- “What is Position Independent Code (PIC) and why is it needed?”
- They want: code that works regardless of load address, required for shared libraries (ASLR), uses PC-relative addressing and GOT/PLT
- “How would you debug a ‘symbol not found’ error at runtime?”
- They want: ldd to check dependencies, LD_DEBUG=all to trace resolution, readelf/nm to inspect symbol tables, verify library paths
- “What’s in an ELF file and how does the loader use it?”
- They want: ELF header, program headers (segments for loading), section headers (for linking/debugging), symbol/string tables, relocation entries
Real-World Connections
Industry Applications
- Build systems (Bazel, CMake): Understand these pipelines to debug build failures
- Package managers (apt, rpm): Know how shared libraries are managed
- Containerization (Docker): Static linking simplifies container images
- Embedded systems: Every byte counts; understanding sections is crucial
- Reverse engineering: This is step 1 of analyzing any binary
Related Open Source Projects
- binutils: The tools you’re wrapping (readelf, objdump, nm)
- LLVM: Alternative compiler with similar pipeline concepts
- pwntools: Python library for similar analysis (CTF-oriented)
- Ghidra/radare2: Advanced binary analysis tools
- libelf: Library for direct ELF parsing
Interview Relevance
This project prepares you for questions like:
- “Walk me through what happens when you compile and run a C program”
- “What’s the difference between static and dynamic linking?”
- “How would you debug a segfault at address X?”
- “Explain the process memory layout”
- “What are symbols and relocations in object files?”
Resources
Essential Reading
- CS:APP Chapter 1: “A Tour of Computer Systems” - Overview of the pipeline
- CS:APP Chapter 7: “Linking” - Deep dive into object files and linking
- “Linkers and Loaders” by John Levine: The definitive book on linking
- System V ABI: Official specification for ELF format and calling conventions
Video Resources
- MIT 6.004 lectures on compilation and linking
- “How do compilers work?” on Computerphile YouTube channel
- LiveOverflow series on binary exploitation (covers ELF in depth)
Tools & Documentation
- readelf(1):
man readelf- ELF file display - objdump(1):
man objdump- Object file disassembly - nm(1):
man nm- Symbol listing - ldd(1):
man ldd- Shared library dependencies - ld(1):
man ld- Linker documentation
Books That Will Help
| Topic | Book | Chapter |
|---|---|---|
| The compilation pipeline overview | Computer Systems: A Programmer’s Perspective | Ch. 1 (A Tour of Computer Systems) |
| Object files, symbols, and relocations | Computer Systems: A Programmer’s Perspective | Ch. 7 (Linking) |
| ELF format deep dive | Practical Binary Analysis | Ch. 2 (ELF Format) |
| Static and dynamic linking | Computer Systems: A Programmer’s Perspective | Ch. 7.6-7.7 |
| Position-independent code and GOT/PLT | Computer Systems: A Programmer’s Perspective | Ch. 7.12 |
| The C compilation model | The C Programming Language (K&R) | Ch. 4 (Functions and Program Structure) |
| Separate compilation in C | C Programming: A Modern Approach | Ch. 15 (Writing Large Programs) |
| x86-64 assembly basics | Computer Systems: A Programmer’s Perspective | Ch. 3.1-3.4 |
| Process loading and execution | Computer Systems: A Programmer’s Perspective | Ch. 7.9, Ch. 8.2 |
| Low-level executable analysis | Low-Level Programming | Ch. 3-4 (Assembly and Linking) |
Related Projects in This Series
- Previous: None (this is the foundation project)
- Next: P2 (Bitwise Data Inspector) builds on your understanding of how data is represented; P10 (ELF Link Map) goes deeper into linking
Submission / Completion Criteria
Minimum Viable Completion:
- Pipeline stage artifacts are captured and reported
- Object file sections and symbols are analyzed
- Basic output formatting works
- Runs without crashing on valid input
Full Completion:
- All analysis modes work (pipeline, object, link, runtime)
- Static vs dynamic comparison works
- GDB integration shows memory layout
- Clean error handling
- Tested on multiple input files
Excellence (Going Above & Beyond):
- Direct ELF parsing (no readelf dependency)
- Cross-platform support (macOS)
- JSON output format
- Crash address analysis mode
- DWARF debug info parsing
This guide was expanded from CSAPP_3E_DEEP_LEARNING_PROJECTS.md. For the complete learning path, see the project index.